. 2017 Apr 18;114(16):E3344-E3353.
doi: 10.1073/pnas.1616733114. Epub 2017 Apr 3.

Parathyroid hormone controls paracellular Ca2+ transport in the thick ascending limb by regulating the tight-junction protein Claudin14

Affiliations

Parathyroid hormone controls paracellular Ca2+ transport in the thick ascending limb by regulating the tight-junction protein Claudin14

Tadatoshi Sato et al. Proc Natl Acad Sci U S A. .

Abstract

Renal Ca2+ reabsorption is essential for maintaining systemic Ca2+ homeostasis and is tightly regulated through the parathyroid hormone (PTH)/PTHrP receptor (PTH1R) signaling pathway. We investigated the role of PTH1R in the kidney by generating a mouse model with targeted deletion of PTH1R in the thick ascending limb of Henle (TAL) and in distal convoluted tubules (DCTs): Ksp-cre;Pth1rfl/fl Mutant mice exhibited hypercalciuria and had lower serum calcium and markedly increased serum PTH levels. Unexpectedly, proteins involved in transcellular Ca2+ reabsorption in DCTs were not decreased. However, claudin14 (Cldn14), an inhibitory factor of the paracellular Ca2+ transport in the TAL, was significantly increased. Analyses by flow cytometry as well as the use of Cldn14-lacZ knock-in reporter mice confirmed increased Cldn14 expression and promoter activity in the TAL of Ksp-cre;Pth1rfl/fl mice. Moreover, PTH treatment of HEK293 cells stably transfected with CLDN14-GFP, together with PTH1R, induced cytosolic translocation of CLDN14 from the tight junction. Furthermore, mice with high serum PTH levels, regardless of high or low serum calcium, demonstrated that PTH/PTH1R signaling exerts a suppressive effect on Cldn14. We therefore conclude that PTH1R signaling directly and indirectly regulates the paracellular Ca2+ transport pathway by modulating Cldn14 expression in the TAL. Finally, systemic deletion of Cldn14 completely rescued the hypercalciuric and lower serum calcium phenotype in Ksp-cre;Pth1rfl/fl mice, emphasizing the importance of PTH in inhibiting Cldn14. Consequently, suppressing CLDN14 could provide a potential treatment to correct urinary Ca2+ loss, particularly in patients with hypoparathyroidism.

Keywords: CLDN14; PTH1R; hypercalciuria; mouse kidney; paracellular.


Conflict of interest statement

The authors declare no conflict of interest.

Figures
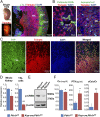
Fig. 1.
Fig. 1.
Illustration of Ksp-cre specificity by immunofluorescence (IF) and analyses of renal tubule-specific deletion of Pth1r. (A, Left) Stereomicroscopic image of the whole kidney of a 6-wk-old Ksp-cre;Tomatofl/+ mouse visualized by bright-field and fluorescence for Tomato. (A, Right) Overview of a Ksp-cre;Tomatofl/+ kidney section by IF staining: blue (DAPI, nuclei), green [Lotus tetragonolobus Lectin (LTL)-specific staining for a proximal convoluted tubule (PCT)], and red (antibody staining for Tomato representing Cadherin-16/Ksp-cre–positive cells). No Tomato-positive staining was seen in glomeruli (blue nuclei, DAPI) and PCTs (green). (B) Higher magnification of kidney sections of Ksp-cre;Tomatofl/+ mouse triple-stained with various antibodies to determine the overlap of expression of Cadherin-16 (Ksp-cre;Tomato, red) with Calbindin D28k (green) in DCTs and DAPI (blue) (Left), and with Cadherin-16 (Ksp-cre;Tomato, red) with Aquaporin-2 (green) in CDs and DAPI (blue) (Right). Some Tomato-positive signals were found in DCTs and CDs, as shown by double staining with Calbindin D28k (yellow arrowheads) and Aquaporin-2, respectively. Aquaporin-2–positive cells (green) appear in yellow (turquoise arrowheads) due to the overlapping expression with Ksp-cre;Tomato (red). (C) Kidney section stained with antibodies for Tamm–Horsfall protein (THP, green) specific for the TAL, Tomato (red), and DAPI (blue). The merged image illustrates the strong overlap in expression of THP and Ksp-cre;Tomato, indicating that Cre activity is strongest in the TAL. (D) qRT-PCR analyses from whole-kidney (Left) and TAL (Right) RNA of 6-wk-old Pth1rfl/fl and Ksp-cre;Pth1rfl/fl mice confirms efficient deletion of Pth1r in mutants (n = 5–10). *P < 0.05; **P < 0.01. (E) Expression of p-CREB protein, reflecting the PTH1R intracellular signaling pathway in the TAL from Pth1rfl/fl and Ksp-cre;Pth1rfl/fl mice, was determined by Western blot analysis, showing lower p-CREB levels in KspCre;Pth1rfl/fl mice compared with controls. (F) Serum and urinary (u) parameters of 6-wk-old Pth1rfl/fl and Ksp-cre;Pth1rfl/fl mice (n = 5–6). *P < 0.05; **P < 0.01.
Fig. S1.
Fig. S1.
Generation of mice with specific Pth1r deletion in the distal parts of the nephron. (A) Schematic representation of wild-type Pth1r allele (Pth1r flox), targeting vector (Ksp-cre), floxed allele (Ksp-cre;Pth1rfl/fl), wild-type Tomato allele (tdTomato flox), targeting vector (Ksp-cre), and floxed allele (Ksp-cre;Tomatofl/+). (B) Electrophoresis results of genotyping. Representative PCR products: M, DNA size marker; lane1, Pth1r+/+ (210 kb); lane 2, Pth1rfl/+ (210 and 280 kb); lane 3, Pth1rfl/fl (280 kb); lane 4, Ksp-cre (200 bp, internal positive control for PCR); lane 5, Ksp-cre+ (200 and 420 bp); lane 6, Tomato+/+(297 bp); lane 7, Tomatofl/+ (196 and 297 bp); lane 8, Tomatofl/fl (196 bp). A macroscopic picture (C) and body weight (B.W., measured in grams) (D) of Pth1rfl/fl and Ksp-cre;Pth1rfl/fl mice at 6 wk are shown. (E) Serum 1,25(OH)2D levels (n = 7) and renal expression of 1aOHase and 24OHase in Pth1rfl/fl and Ksp-cre;Pth1rfl/fl mice (n = 3–4).
Fig. 2.
Fig. 2.
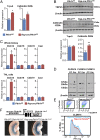
Renal calcium transport proteins and gene expression. (A) mRNA expression of transcellular calcium transport proteins (Trpv5, Calbindin D28k) in whole kidneys of Pth1rfl/fl and Ksp-cre;Pth1rfl/fl mice at 6 wk of age (n = 3–4). Gene expression was normalized to Gapdh. *P < 0.05. (B) Protein expression of TRPV5 and Calbindin D28k. The protein expression was quantified by image-analyzing software (ImageJ) and normalized to β-actin. Calbindin D28k was up-regulated in Ksp-cre;Pth1rfl/fl mice compared with the control group (n = 5). **P < 0.01. (C) mRNA expression of paracellular calcium transport proteins (Cldn14, Cldn16, and Cldn19) and Casr in whole kidneys of Pth1rfl/fl and Ksp-cre;Pth1rfl/fl mice at 6 wk of age (n = 3–4). Cldn14 expression in isolated TAL cells from Ksp-cre;Pth1rfl/fl mice was markedly up-regulated. Gene expression was normalized to Gapdh. *P < 0.05; **P < 0.01. (D) Protein expression of Cldn14, Cldn16, and Cldn19. Cldn14 expression (25.7 kDa) in Ksp-cre;Pth1rfl/fl mice was up-regulated, whereas Cldn16 (∼26 kDa) and Cldn19 (∼26 kDa) were down-regulated. The black arrow depicts the expected band size for Cldn14, Cldn16, and Cldn19. The 10- to 15-Da band is common to all claudins and might represent a cleaved fragment. (E) Flow cytometry of Cldn14 in the TAL. Renal cells expressing Tomato protein were isolated from Ksp-cre;Tomatofl/+;Pth1r+/+ and Ksp-cre;Tomatofl/+;Pth1rfl/fl mice. Cldn14 expression was assessed in Tomato-positive cells from whole kidneys from mutant and control mice. Max, maximum. (F) In vivo Cldn14 promoter-LacZ reporter assay. LacZ staining was performed in kidneys from Pth1rfl/fl;Cldn14+/LacZ mice and Ksp-cre;Pth1rfl/fl;Cldn14+/LacZ mice, showing increased LacZ staining in Ksp-cre;Pth1rfl/fl;Cldn14+/LacZ kidneys.
Fig. 3.
Fig. 3.
PTH (1–34) injection into Pth1rfl/fl and Ksp-Cre;Pth1rfl/fl mice. (A) Serum Ca and 1,25(OH)2D3 and 1αOHase mRNA expression in 6-wk-old Ksp-cre;Pth1rfl/fl and Pth1rfl/fl mice (n = 5–6) 2 h after injection of 0.9% NaCl (vehicle) or PTH (1–34). (B) mRNA expression of Cldn14, Cldn16, and Cldn19 in kidneys of Pth1rfl/fl and Ksp-cre;Pth1rfl/fl mice at 6 wk of age (n = 3–4) 2 h after injection of 0.9% NaCl or PTH (1–34). Expression was normalized to Gapdh. *P < 0.05, **P < 0.01, ***P < 0.001 vs. NaCl in Pth1rfl/fl; P < 0.05; ††P < 0.01, †††P < 0.001 vs. NaCl in Ksp-cre;Pth1rfl/fl; ‡‡‡P < 0.001 vs. PTH in Pth1rfl/fl.
Fig. 4.
Fig. 4.
Ksp-cre;Pth1rfl/fl mice on a Ca-deficient diet. Mice were fed either a control Ca2+ (0.6% Ca) or Ca2+-deficient (0% Ca) diet for 3 wk. (A) Serum calcium, PTH, and 1,25(OH)2D of 6-wk-old Pth1rfl/fl and Ksp-cre;Pth1rfl/fl mice (n = 5–6). ***P < 0.001 vs. Pth1rfl/fl on 0.6% Ca; †††P < 0.001 vs. Ksp-cre;Pth1rfl/fl on 0.6% Ca. (B) mRNA expression of the paracellular Ca2+ transport protein Cldn14 in Pth1rfl/fl and Ksp-cre;Pth1rfl/fl mice on the control diet and Ca2+-deficient diet. *P < 0.05 vs. Pth1rfl/fl on 0.6% Ca2+; P < 0.05, ††P < 0.01 vs. Ksp-cre;Pth1rfl/fl on 0.6% Ca2+; P < 0.05 vs. vs. Pth1rfl/fl on 0% Ca2+.
Fig. S2.
Fig. S2.
mRNA expression, urinary Ca2+ excretion, and serum PTH levels in Casr−/− mice. (A) Renal mRNA expression of paracellular Ca2+ transport molecules (Cldn14, Cldn16, and Cldn19) in wild-type and Casr−/− mice at 10 d of age. Expression was normalized to Gapdh. (B) Urinary (u) Ca2+ excretion normalized by urinary creatinine and serum PTH levels in Casr−/− mice (n = 4–5). *P < 0.05; **P < 0.01; ***P < 0.001.
Fig. S3.
Fig. S3.
Renal expression of Trpv5 and Calbindin D28k mRNA in Pth1rfl/fl and Ksp-cre;Pth1rfl/fl mice fed a Ca-deficient diet. No change in renal expression of the transcellular Ca2+ transport protein Trpv5 was noted between Pth1rfl/fl and Ksp-cre;Pth1rfl/fl mice on a control diet (0.6% Ca) or Ca2+-deficient diet (0% Ca). A slight increase in Calbindin D28k was seen in Ksp-cre;Pth1rfl/fl mice on the Ca2+-deficient diet (n = 3). *P < 0.05 vs. Pth1rfl/fl on 0.6% Ca; P < 0.05 vs. Pth1rfl/fl on 0% Ca.
Fig. 5.
Fig. 5.
In vitro analyses of translocation of paracellular Ca transport proteins upon PTH (1–34) treatment. (A) Localization of CLDN14-GFP, CLDN16-GFP, and CLDN19-GFP proteins is shown by IF in HEK293 cells stably overexpressing CLDN14 and PTH1R, CLDN16 and PTH1R, and CLDN19 and PTH1R at 0, 60, 120, and 180 min after PTH (1–34) treatment. Cells were placed on a 35-mm, no. 1.5 glass-bottomed culture dish for 2 d before imaging. Time-lapse microscopy was performed using a VivaView incubator fluorescence microscope. CLDN14-GFP is clearly visible as nodular structures on the cell–cell junction at 0 min. PTH treatment discomposed this structure over time into a weaker and more linear expression pattern along the cell membrane. No major changes were observed for CLDN16-GFP and CLDN19-GFP proteins. (B) Three-dimensional reconstruction images with serial z-stack optical sections. (Left) Three-dimensional reconstitution images of CLDN14, CLDN16, and CLDN19 before and after 180 min of PTH treatment. (Right) Quantification, with red and yellow colors indicating higher expression of claudins located on tight junctions and blue-shaded colors representing relatively lower claudin expression in the cytosol. PTH treatment significantly altered the distribution of CLDN14 from a thick nodular structure to a thin lined structure. The cytosolic CLDN14 diffuse pattern was increased by PTH treatment (light blue). The quantification is shown by box-and-whisker plots. PTH treatment significantly decreased tight-junction (TJ) CLDN14 and increased cytosolic CLDN14 (n = 16). ***P < 0.001 vs. 0 min on tight junction; †††P < 0.001 vs. 0 min in cytosol.
Fig. S4.
Fig. S4.
Immunofluorescence analysis of CLDN14 in HEK293 cells treated with the tight-junction inhibitor C10. HEK293 cells stably transfected with CLDN14-GFP and PTH1R were placed on a 35-mm, no.1.5 glass-bottomed culture dish for 2 d before imaging. Time-lapse microscopy was performed using a VivaView incubator fluorescence microscope. LUT, look-up table. C10 treatment immediately relieved the tight junction between cells and increased CLDN14 protein expression on the cell–cell junctions. ***P < 0.001 vs. 0 h; †††P < 0.001 vs. 2 h.
Fig. 6.
Fig. 6.
Deletion of Cldn14 from Ksp-cre;Pth1rfl/fl mice fully rescues the urinary Ca2+ leak. Analyses of serum and urine parameters as well as renal mRNA expression of Cldn14 in Pth1rfl/fl, Ksp-cre;Pth1rfl/fl, Cldn14−/−;Pth1rfl/fl, and Cldn14−/−Ksp-cre;Pth1rfl/fl mice are shown. (A) Renal Cldn14 mRNA expression in 6-wk-old mice shows complete absence of Cldn14 in double mutants (striped bars in B and C). Urinary Ca2+/creatinine (B) and serum calcium and PTH (C) levels of 6-wk-old mice are shown (n = 3–7). *P < 0.05, ***P < 0.001 vs. Pth1rfl/fl; P < 0.05, †††P < 0.001 vs. Ksp-cre;Pth1rfl/fl.
Fig. 7.
Fig. 7.
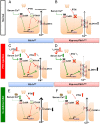
Summary of findings is illustrated in a diagram. (A and B, Normal) Under healthy physiological conditions, with normal serum calcium and PTH levels, paracellular calcium transport is balanced by a combination of PTH1R and CaSR signaling. (A) On one hand, PTH can directly suppress Cldn14 in the TAL to enhance paracellular Ca2+ reabsorption. On the other hand, PTH induces serum calcium and activation of the CaSR in the kidney, leading to an induction of Cldn14 expression and thereby blocking paracellular Ca2+ reabsorption. A tight regulation between those two actions is critical to assure a balance in paracellular Ca2+ transport. (B) Deletion of PTH1R signaling in the TAL results in a loss of the suppressive effects of PTH on Cldn14, favoring the stimulation of Cldn14 expression by calcium and resulting in hypercalciuria (decreasing Ca reabsorption). (C and D, PTH injection) (C) Injection of PTH into mice increases serum calcium and CaSR signaling to induce Cldn14 expression. An elevation in Cldn14 levels leads to increased urinary Ca2+ wasting. PTH can directly suppress Cldn14 expression in the TAL to stimulate paracellular Ca2+ reabsorption to balance its indirect effects on Cldn14 via the CaSR. This dual action of PTH thus forms a mechanism for properly maintaining renal Ca2+ homeostasis in the TAL. (D) Loss of the suppressive function of PTH on Cldn14 upon higher serum PTH levels leads to very high levels of Cldn14, causing severe urinary Ca2+ loss. (E and F, Ca2+-deficient diet) (E) CaSR responds to low serum calcium levels by lowering its usual induction of Cldn14 expression to preserve Ca2+ reabsorption. Low serum calcium levels also lead to a rise in serum PTH levels, which additionally suppress Cldn14, resulting in further conservation of calcium. (F) Loss of PTH1R signaling eliminates the suppression of Cldn14 by PTH, thereby leaving some Cldn14 expression intact.

Similar articles

Cited by

References

    1. Peacock M. Calcium metabolism in health and disease. Clin J Am Soc Nephrol. 2010;5:S23–S30. - PubMed
    1. Coe FL, Worcester EM, Evan AP. Idiopathic hypercalciuria and formation of calcium renal stones. Nat Rev Nephrol. 2016;12:519–533. - PMC - PubMed
    1. Bihl G, Meyers A. Recurrent renal stone disease-advances in pathogenesis and clinical management. Lancet. 2001;358:651–656. - PubMed
    1. Painter SE, Kleerekoper M, Camacho PM. Secondary osteoporosis: A review of the recent evidence. Endocr Pract. 2006;12:436–445. - PubMed
    1. Hudec SM, Camacho PM. Secondary causes of osteoporosis. Endocr Pract. 2013;19:120–128. - PubMed

Publication types

LinkOut - more resources