. 2017 Apr 3;7(1):552.
doi: 10.1038/s41598-017-00622-w.

Analyzing Single Molecule Localization Microscopy Data Using Cubic Splines

Affiliations

Analyzing Single Molecule Localization Microscopy Data Using Cubic Splines

Hazen P Babcock et al. Sci Rep. .

Abstract

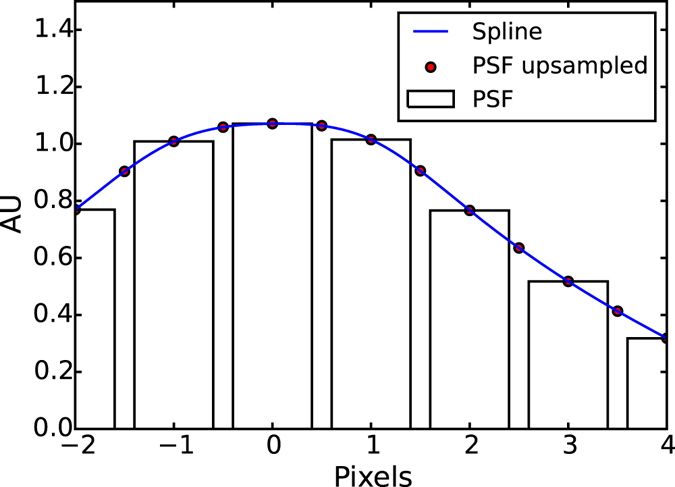
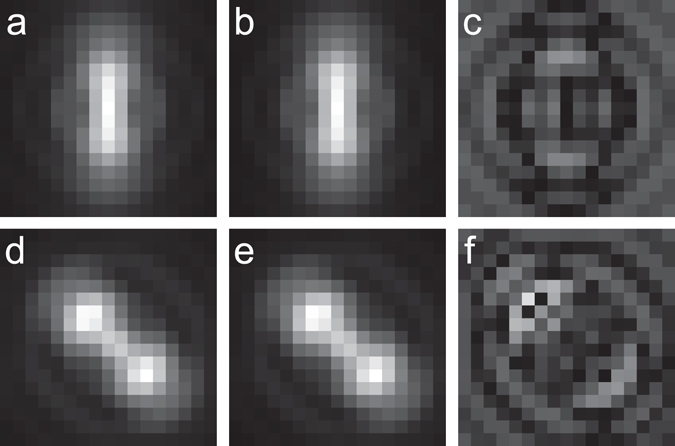
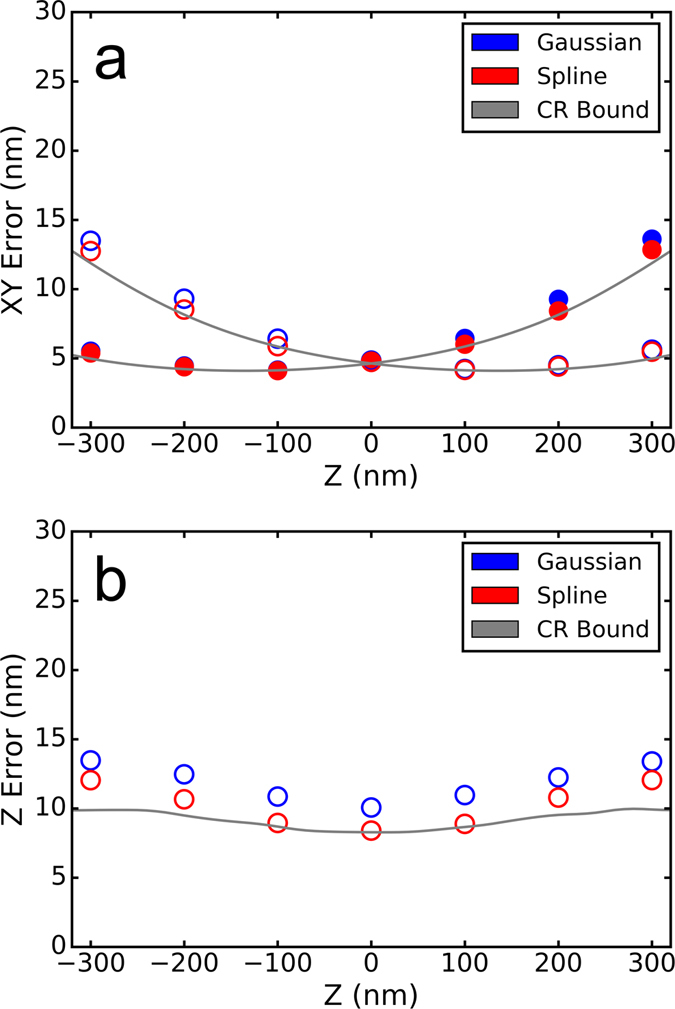
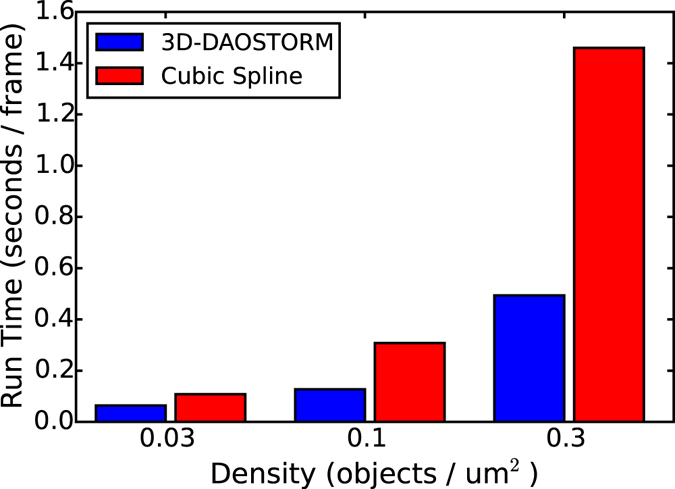
The resolution of super-resolution microscopy based on single molecule localization is in part determined by the accuracy of the localization algorithm. In most published approaches to date this localization is done by fitting an analytical function that approximates the point spread function (PSF) of the microscope. However, particularly for localization in 3D, analytical functions such as a Gaussian, which are computationally inexpensive, may not accurately capture the PSF shape leading to reduced fitting accuracy. On the other hand, analytical functions that can accurately capture the PSF shape, such as those based on pupil functions, can be computationally expensive. Here we investigate the use of cubic splines as an alternative fitting approach. We demonstrate that cubic splines can capture the shape of any PSF with high accuracy and that they can be used for fitting the PSF with only a 2-3x increase in computation time as compared to Gaussian fitting. We provide an open-source software package that measures the PSF of any microscope and uses the measured PSF to perform 3D single molecule localization microscopy analysis with reasonable accuracy and speed.


Conflict of interest statement

The authors declare that they have no competing interests.

Figures

Figure 1
Figure 1
1D Spline example. Each cubic spline interval (the blue line) is determined such that itself and its first derivative are continuous across the red points which are the interval boundaries. The red points are calculated by up-sampling the measured PSF (grey bars) by a factor of two using 3rd order spline interpolation.
Figure 2
Figure 2
Analytical PSFs and their spline representations for the astigmatic PSF and saddle-point PSF. (a) Astigmatic PSF at z = −420 nm. (b) Cubic spline representation of (a). (c) Difference between (a) and (b) multiplied by 100. (d) Saddle-point PSF at z = −420 nm. (e) Cubic spline representation of (d). (f) Difference between (d) and (e) multiplied by 100.
Figure 3
Figure 3
Astigmatic PSF fitting accuracy. (a) Average xy fitting error as a function of z for cubic spline versus elliptical Gaussian fitting. Ellipitical Gaussian fitting was performed with the 3D DAOSTORM algorithm that we reported previously. The filled points are the error in x and the hollow points are the error in y. Each data point is the average of multiple independent z positions in the 100 nm range centered on the data point. The solid gray lines are the Cramer-Rao theoretical bounds calculated following ref. . (b) Average z fitting error as a function of z and the Cramer-Rao theoretical bound. The z fitting error and the Cramer-Rao bounds are determined as described in (a).
Figure 4
Figure 4
Fitting speed comparison. A comparison of the time it takes to analyze a single frame (256 × 256 pixels) of a simulated movie with indicated emitter densities using 3D-DAOSTORM or the cubic spline approach.
Figure 5
Figure 5
PSF localization accuracy. Localization errors in x, y and z are plotted as a function of z. (a) Double helix PSF. (b) Saddle-point PSF. The solid lines are the Cramer-Rao theoretical bounds calculated following ref. .

References

    1. Huang B, Wang W, Bates M, Zhuang X. Three-Dimensional Super-Resolution Imaging by Stochastic Optical Reconstruction Microscopy. Science. 2008;319:810–813. doi: 10.1126/science.1153529. - DOI - PMC - PubMed
    1. Pavani SRP, et al. Three-dimensional, single-molecule fluorescence imaging beyond the diffraction limit by using a double-helix point spread function. Proc Natl Acad Sci USA. 2009;106:2995–2999. doi: 10.1073/pnas.0900245106. - DOI - PMC - PubMed
    1. Shechtman Y, Steffen JS, Backer AS, Moerner WE. Optimal Point Spread Function Design for 3D Imaging. Physical Review Letters. 2014;113:1–5. doi: 10.1103/PhysRevLett.113.133902. - DOI - PMC - PubMed
    1. Jia S, Vaughan JC, Zhuang X. Isotropic three-dimensional super-resolution imaging with a self-bending point spread function. Nature Photonics. 2014;8:302–306. doi: 10.1038/nphoton.2014.13. - DOI - PMC - PubMed
    1. Juette MF, et al. Three-dimensional sub-100 nm resolution fluorescence microscopy of thick samples. Nature Methods. 2008;5:527–529. doi: 10.1038/nmeth.1211. - DOI - PubMed

Publication types