

Catalyzed Synthesis of Zinc Clays by Prebiotic Central Metabolites
- PMID: 28373695
- PMCID: PMC5428702
- DOI: 10.1038/s41598-017-00558-1
Catalyzed Synthesis of Zinc Clays by Prebiotic Central Metabolites
Erratum in
-
Erratum: Catalyzed Synthesis of Zinc Clays by Prebiotic Central Metabolites.Sci Rep. 2017 Aug 2;7(1):7482. doi: 10.1038/s41598-017-04859-3. Sci Rep. 2017. PMID: 28769028 Free PMC article.
Abstract
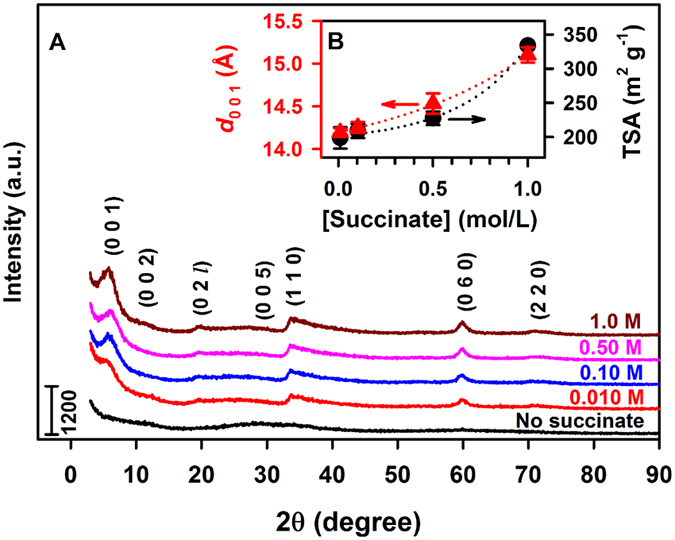
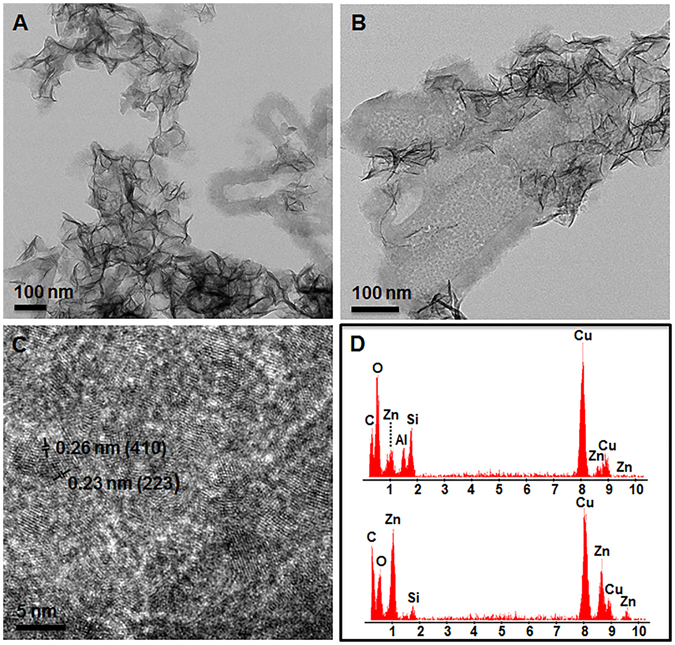
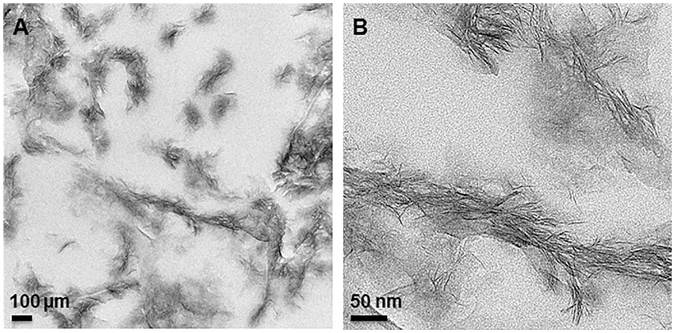
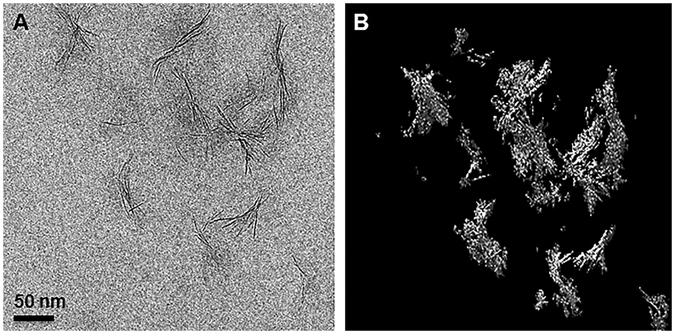
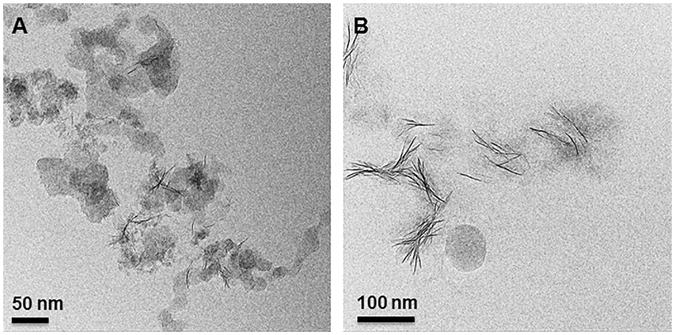
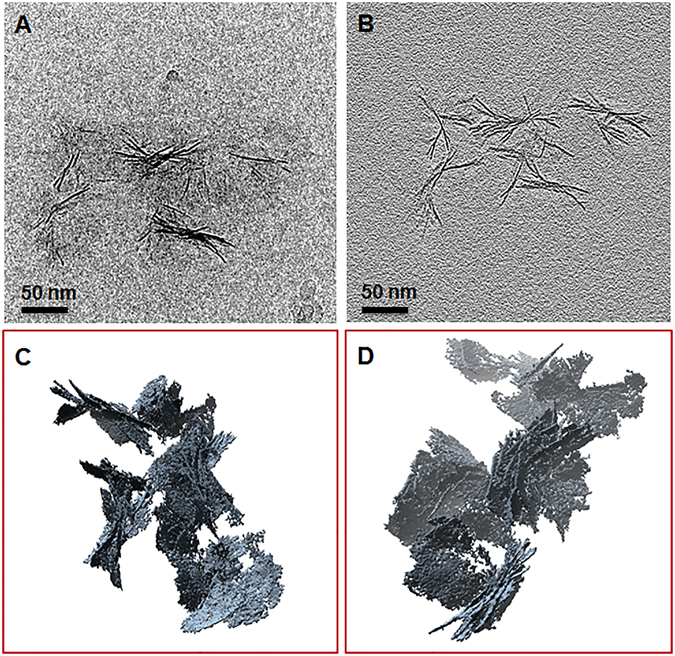
How primordial metabolic networks such as the reverse tricarboxylic acid (rTCA) cycle and clay mineral catalysts coevolved remains a mystery in the puzzle to understand the origin of life. While prebiotic reactions from the rTCA cycle were accomplished via photochemistry on semiconductor minerals, the synthesis of clays was demonstrated at low temperature and ambient pressure catalyzed by oxalate. Herein, the crystallization of clay minerals is catalyzed by succinate, an example of a photoproduced intermediate from central metabolism. The experiments connect the synthesis of sauconite, a model for clay minerals, to prebiotic photochemistry. We report the temperature, pH, and concentration dependence on succinate for the synthesis of sauconite identifying new mechanisms of clay formation in surface environments of rocky planets. The work demonstrates that seeding induces nucleation at low temperatures accelerating the crystallization process. Cryogenic and conventional transmission electron microscopies, X-ray diffraction, diffuse reflectance Fourier transformed infrared spectroscopy, and measurements of total surface area are used to build a three-dimensional representation of the clay. These results suggest the coevolution of clay minerals and early metabolites in our planet could have been facilitated by sunlight photochemistry, which played a significant role in the complex interplay between rocks and life over geological time.
Conflict of interest statement
The authors declare that they have no competing interests.
Figures


Similar articles
-
Formation of replicating saponite from a gel in the presence of oxalate: implications for the formation of clay minerals in carbonaceous chondrites and the origin of life.Astrobiology. 2012 Jun;12(6):549-61. doi: 10.1089/ast.2011.0635. Astrobiology. 2012. PMID: 22794298
-
Prebiotic metabolism: production by mineral photoelectrochemistry of alpha-ketocarboxylic acids in the reductive tricarboxylic acid cycle.Astrobiology. 2009 Nov;9(9):833-42. doi: 10.1089/ast.2009.0356. Astrobiology. 2009. PMID: 19968461
-
A possible energetic role of mineral surfaces in chemical evolution.Orig Life Evol Biosph. 1985;15(3):161-206. doi: 10.1007/BF01808364. Orig Life Evol Biosph. 1985. PMID: 3903606 Review.
-
Mineral surface chemistry control for origin of prebiotic peptides.Nat Commun. 2017 Dec 11;8(1):2033. doi: 10.1038/s41467-017-02248-y. Nat Commun. 2017. PMID: 29229963 Free PMC article.
-
Toxicological evaluation of clay minerals and derived nanocomposites: a review.Environ Res. 2015 Apr;138:233-54. doi: 10.1016/j.envres.2014.12.024. Epub 2015 Feb 28. Environ Res. 2015. PMID: 25732897 Review.
Cited by
-
Origin of the RNA World in Cold Hadean Geothermal Fields Enriched in Zinc and Potassium: Abiogenesis as a Positive Fallout from the Moon-Forming Impact?Life (Basel). 2025 Mar 4;15(3):399. doi: 10.3390/life15030399. Life (Basel). 2025. PMID: 40141744 Free PMC article.
-
Prebiotic condensation through wet-dry cycling regulated by deliquescence.Nat Commun. 2019 Oct 4;10(1):4508. doi: 10.1038/s41467-019-11834-1. Nat Commun. 2019. PMID: 31586058 Free PMC article.
-
Clays and the Origin of Life: The Experiments.Life (Basel). 2022 Feb 9;12(2):259. doi: 10.3390/life12020259. Life (Basel). 2022. PMID: 35207546 Free PMC article. Review.
-
How Did Life Emerge in Chemically Complex Messy Environments?Life (Basel). 2022 Aug 26;12(9):1319. doi: 10.3390/life12091319. Life (Basel). 2022. PMID: 36143356 Free PMC article.
-
The Origin of Prebiotic Information System in the Peptide/RNA World: A Simulation Model of the Evolution of Translation and the Genetic Code.Life (Basel). 2019 Mar 1;9(1):25. doi: 10.3390/life9010025. Life (Basel). 2019. PMID: 30832272 Free PMC article.
References
-
- Guzman, M. I. In Origins of Life: The Primal Self-Organization (eds Richard Egel, Dirk-Henner Lankenau & Armen Y. Mulkidjanian) Ch. 4, 85–105 (Springer Berlin Heidelberg, 2011).
-
- Zhou R, Guzman MI. Photocatalytic reduction of fumarate to succinate on ZnS mineral surfaces. J. Phys. Chem. C. 2016;120:7349–7357. doi: 10.1021/acs.jpcc.5b12380. - DOI
Publication types
LinkOut - more resources
Full Text Sources
Other Literature Sources
