. 2017 Apr 3;7(1):585.
doi: 10.1038/s41598-017-00722-7.

The signs of Antarctic ozone hole recovery

Affiliations

The signs of Antarctic ozone hole recovery

Jayanarayanan Kuttippurath et al. Sci Rep. .

Abstract

Absorption of solar radiation by stratospheric ozone affects atmospheric dynamics and chemistry, and sustains life on Earth by preventing harmful radiation from reaching the surface. Significant ozone losses due to increases in the abundances of ozone depleting substances (ODSs) were first observed in Antarctica in the 1980s. Losses deepened in following years but became nearly flat by around 2000, reflecting changes in global ODS emissions. Here we show robust evidence that Antarctic ozone has started to recover in both spring and summer, with a recovery signal identified in springtime ozone profile and total column measurements at 99% confidence for the first time. Continuing recovery is expected to impact the future climate of that region. Our results demonstrate that the Montreal Protocol has indeed begun to save the Antarctic ozone layer.


Conflict of interest statement

The authors declare that they have no competing interests.

Figures

Figure 1
Figure 1
Time evolution of stratospheric halogens, ozone and temperature: Top: The temporal evolution of equivalent effective stratospheric chlorine (EESC) in the stratosphere in the inverted scale (with respect to the World Meteorological Organisation A1–2010 scenario). The horizontal line indicates 4000 pptv. Second from Top: Time evolution of the September, October and November (SON, spring) averaged ozone volume mixing ratios (VMRs) over the altitude range 325–500 K (~10–20 km) from ozonesonde measurements in the Antarctic. The horizontal line indicates 0.4 ppmv. Third from Top. The time evolution of the SON averaged total column ozone (TCO) measurements at selected Antarctic stations, as listed in the figure legend. The TCO measurements are taken by the Total Column Ozone Mapping Spectrometer (TOMS, 1979–2003) and Ozone Monitoring Instrument (OMI, 2004–2013). The horizontal line indicates 220 DU, the Antarctic ozone hole criterion. Bottom: The vortex-averaged temperature estimated at the ozonesonde stations in the Antarctic vortex in spring (SON). The horizontal dotted lines represent 195 K. The red curve shows all measurements without any vortex consideration (ALL DATA) and the green curve represents the measurements sorted inside the vortex with ≥65° S EqL criterion (INSIDE VORTEX). The vertical dashed line at 2001 in all plots represents the turnaround year of EESC.
Figure 2
Figure 2
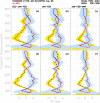
Vertical structure of Antarctic ozone recovery: (a) The ozone trends estimated from ozonesonde data in the Antarctic vortex in spring (SON) with ≥65° S EqL criterion (“standard”, black cures), Nash et al. vortex criterion (“Nash-96”, blue curves) and without considering the vortex boundaries (“no VORTEX”, red curves) for the 1979–2001 (dash) and 2001–2013 (solid) periods. The break year 2001 corresponds to the year of maximum stratospheric chlorine in the Polar Regions. (b) Trends estimated with various input scenarios, where the blue curves (“AER SHIFT 0”) represent those found without the aerosol time lag and the red curves (“T–YEAR 2000”) represent the analysis performed by changing the break-year to 2000. (c) Trends estimated with a different latitude range for the heat flux data (blue curves) and without the heat flux term entirely are also shown (red curves). In all plots (ac) the standard estimate (black curves) and its uncertainty at the 95% level (shaded areas) are shown. (d) Trend computed without the Antarctic Oscillation (AAO) term and shaded areas represent its uncertainty at the 95% level (red curves). Trend computed using the solar flux (SF) and Quasi-biennial Oscillation (QBO) terms separately (blue curves) instead of coupling SF and QBO as for the standard scenario. (e) Trend computed without the 1991–1995 data (red curves) and shaded areas represent its uncertainty at the 95% level. (f) Trend estimated without the 1979–1985 data (red curves) and shaded areas represent its uncertainty at the 95% level. (g) Trend estimated without using any regression terms, but with the linear terms (“LINT”); shaded areas represent its uncertainty at the 95% level. (h) Standard scenario with its uncertainty at the 99% level. In all plots (ah) the horizontal dotted lines represent 350 K (~12 km) and 550 K (~22 km) altitudes and vertical dotted lines represent −10%/year and 10%/year.
Figure 3
Figure 3
Vertical structure of ozone trends in Antarctic Summer: (a) Vortex averaged (≥65° S EqL) ozone trends estimated from ozonesonde measurements in Antarctica for (a) December–January–February (DJF), (b) January–February (JF) and (c) January–February–March (JFM) seasons. The shaded areas represent their significance at the 95% level (ac, upper panel) and 85% level (de, lower panel). The red curves represent the analyses without considering the influence of the Antarctic Oscillation. Note that the number of observations in summer (DJF, JF and JFM) is significantly fewer than those in spring (SON, Fig. 2). In all plots (af) the horizontal dotted lines represent 350 K (~12 km) and 550 K (~22 km) altitudes and vertical dotted lines represent −2%/year and 2%/year.

References

    1. World Meteorological Organization. Scientific Assessment of Ozone Depletion: 2011 (Report 53, Global Ozone Research and Monitoring Project, 2011).
    1. Farman JC, Gardiner BG, Shanklin JD. Large losses of total ozone in Antarctica reveal seasonal C1Ox/NOx interaction. Nature. 1985;315:207–210. doi: 10.1038/315207a0. - DOI
    1. Solomon S, Garcia RR, Rowland FS, Wuebbles DJ. On the depletion of Antarctic ozone. Nature. 1986;321:755–758. doi: 10.1038/321755a0. - DOI
    1. Hofmann DJ, Oltmans SJ, Harris JM, Solomon S, Deschler T, Johnson BJ. Observations and possible causes of new ozone depletion in Antarctica in 1991. Nature. 1992;359:283–287. doi: 10.1038/359283a0. - DOI
    1. Yang ES, et al. First stage of Antarctic ozone recovery. J. Geophys. Res. 2008;113:D20308. doi: 10.1029/2007JD009675. - DOI

LinkOut - more resources