

Preexisting domain motions underlie protonation-dependent structural transitions of the P-type Ca2+-ATPase
- PMID: 28374038
- PMCID: PMC5472844
- DOI: 10.1039/c7cp00243b
Preexisting domain motions underlie protonation-dependent structural transitions of the P-type Ca2+-ATPase
Abstract
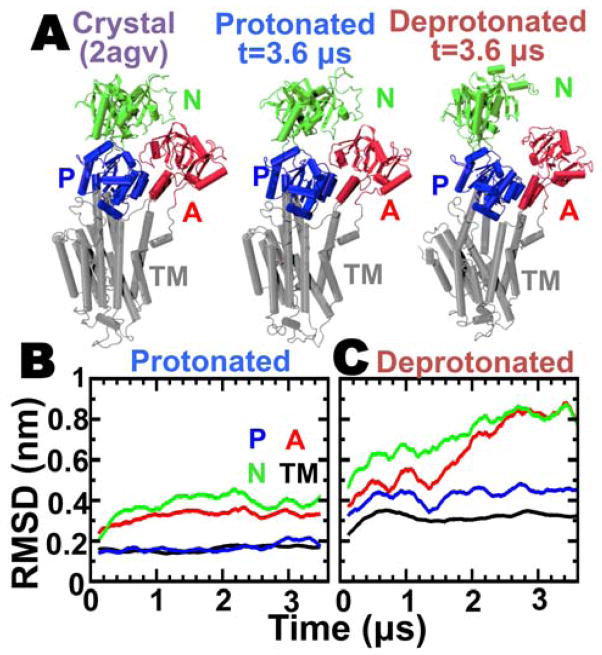
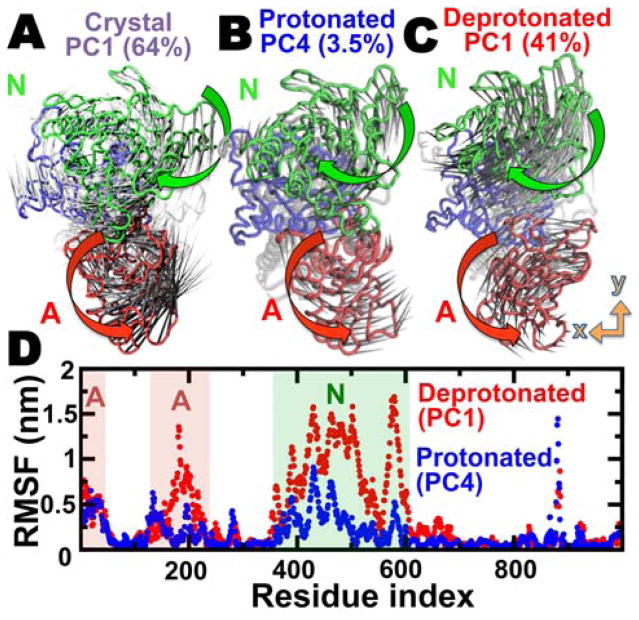
We have performed microsecond molecular dynamics (MD) simulations to determine the mechanism for protonation-dependent structural transitions of the sarco/endoplasmic reticulum Ca2+-ATPase (SERCA), one of the most prominent members of the large P-type ATPase superfamily that transports ions across biological membranes. The release of two H+ from the transport sites activates SERCA by inducing a structural transition between low (E2) and high (E1) Ca2+-affinity states (E2-to-E1 transition), but the structural mechanism by which transport site deprotonation facilitates this transition is unknown. We performed microsecond all-atom MD simulations to determine the effects of transport site protonation on the structural dynamics of the E2 state in solution. We found that the protonated E2 state has structural characteristics that are similar to those observed in crystal structures of E2. Upon deprotonation, a single Na+ ion rapidly (<10 ns) binds to the transmembrane transport sites and induces a kink in M5, disrupts the M3-M5 interface, and increases the mobility of the M3/A-M3 linker. Principal component analysis showed that counter-rotation of the cytosolic N-A domains about the membrane normal axis, which is the primary motion driving the E2-to-E1 transition, is present in both protonated and deprotonated E2 states; however, protonation-dependent structural changes in the transmembrane domain control the hierarchical organization and amplitude of this motion. We propose that preexisting rigid-body domain motions underlie structural transitions of SERCA, where the functionally important directionality is preserved while transport site protonation controls the dominance and amplitude of motion to shift the equilibrium between the E1 and E2 states. We conclude that ligand-induced modulation of preexisting domain motions is likely a common theme in structural transitions of the P-type ATPase superfamily.
Figures


Similar articles
-
Microsecond molecular dynamics simulations of Mg²⁺- and K⁺-bound E1 intermediate states of the calcium pump.PLoS One. 2014 Apr 23;9(4):e95979. doi: 10.1371/journal.pone.0095979. eCollection 2014. PLoS One. 2014. PMID: 24760008 Free PMC article.
-
Atomic-level mechanisms for phospholamban regulation of the calcium pump.Biophys J. 2015 Apr 7;108(7):1697-1708. doi: 10.1016/j.bpj.2015.03.004. Biophys J. 2015. PMID: 25863061 Free PMC article.
-
Sarcolipin and phospholamban inhibit the calcium pump by populating a similar metal ion-free intermediate state.Biochem Biophys Res Commun. 2015 Jul 17-24;463(1-2):37-41. doi: 10.1016/j.bbrc.2015.05.012. Epub 2015 May 15. Biochem Biophys Res Commun. 2015. PMID: 25983321 Free PMC article.
-
Ion pathways in the sarcoplasmic reticulum Ca2+-ATPase.J Biol Chem. 2013 Apr 12;288(15):10759-65. doi: 10.1074/jbc.R112.436550. Epub 2013 Feb 11. J Biol Chem. 2013. PMID: 23400778 Free PMC article. Review.
-
The Ca2+-ATPase pump facilitates bidirectional proton transport across the sarco/endoplasmic reticulum.Mol Biosyst. 2017 Mar 28;13(4):633-637. doi: 10.1039/c7mb00065k. Mol Biosyst. 2017. PMID: 28290590 Free PMC article. Review.
Cited by
-
Structural and energetic analysis of metastable intermediate states in the E1P-E2P transition of Ca2+-ATPase.Proc Natl Acad Sci U S A. 2021 Oct 5;118(40):e2105507118. doi: 10.1073/pnas.2105507118. Epub 2021 Sep 30. Proc Natl Acad Sci U S A. 2021. PMID: 34593638 Free PMC article.
-
Linking Biochemical and Structural States of SERCA: Achievements, Challenges, and New Opportunities.Int J Mol Sci. 2020 Jun 10;21(11):4146. doi: 10.3390/ijms21114146. Int J Mol Sci. 2020. PMID: 32532023 Free PMC article. Review.
-
Probing the effects of nonannular lipid binding on the stability of the calcium pump SERCA.Sci Rep. 2019 Mar 4;9(1):3349. doi: 10.1038/s41598-019-40004-y. Sci Rep. 2019. PMID: 30833659 Free PMC article.
-
Structural basis for relief of phospholamban-mediated inhibition of the sarcoplasmic reticulum Ca2+-ATPase at saturating Ca2+ conditions.J Biol Chem. 2018 Aug 10;293(32):12405-12414. doi: 10.1074/jbc.RA118.003752. Epub 2018 Jun 22. J Biol Chem. 2018. PMID: 29934304 Free PMC article.
-
Allosteric Modulation of SERCA Pumps in Health and Disease: Structural Dynamics, Posttranslational Modifications, and Therapeutic Potential.J Mol Biol. 2025 May 9:169200. doi: 10.1016/j.jmb.2025.169200. Online ahead of print. J Mol Biol. 2025. PMID: 40349954 Review.
References
MeSH terms
Substances
Grants and funding
LinkOut - more resources
Full Text Sources
Other Literature Sources
Medical
Miscellaneous