. 2017 Jun;28(6):1203-1215.
doi: 10.1007/s13361-017-1635-x. Epub 2017 Apr 3.

Defining Gas-Phase Fragmentation Propensities of Intact Proteins During Native Top-Down Mass Spectrometry

Affiliations

Defining Gas-Phase Fragmentation Propensities of Intact Proteins During Native Top-Down Mass Spectrometry

Nicole A Haverland et al. J Am Soc Mass Spectrom. 2017 Jun.

Abstract

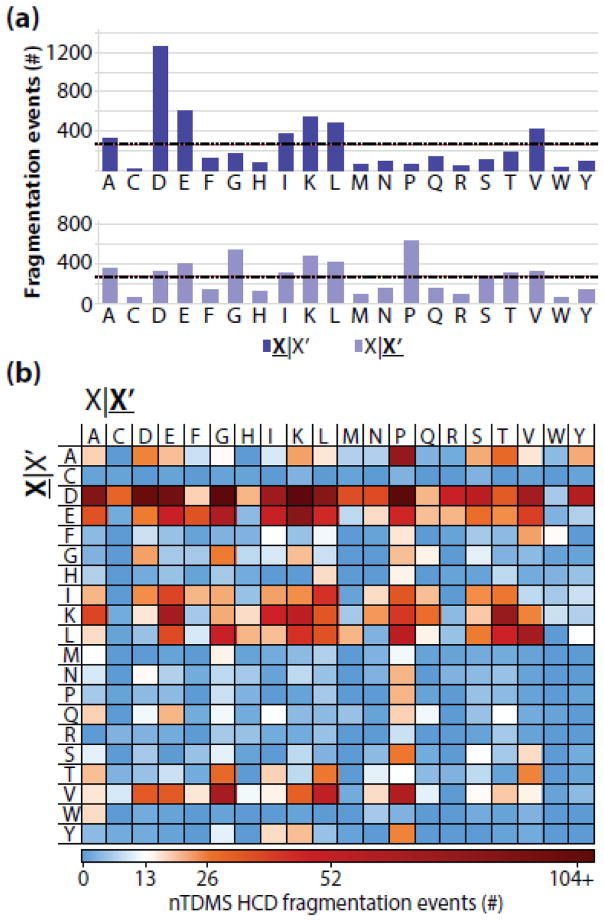
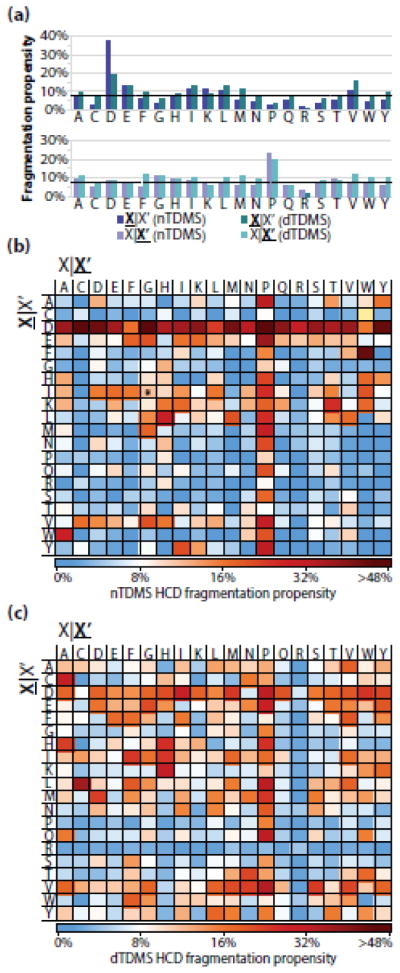
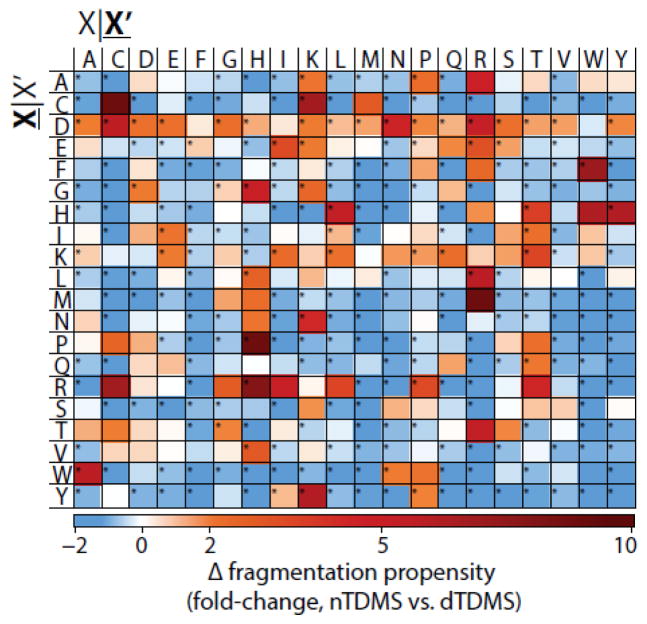
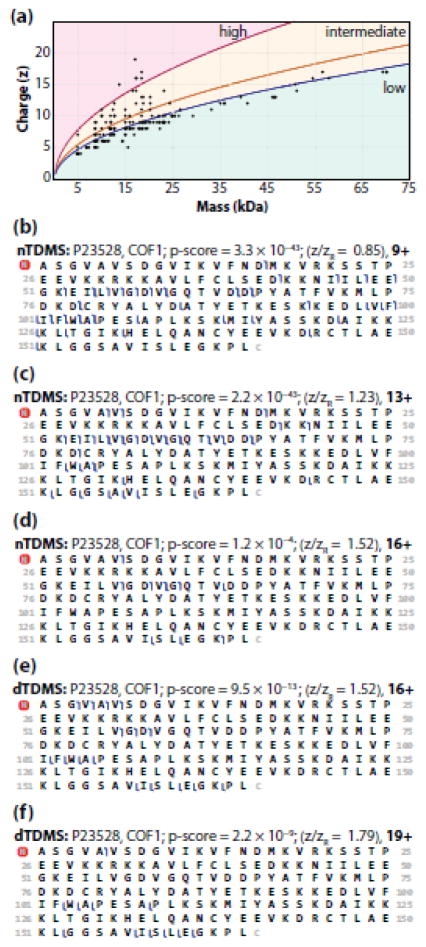
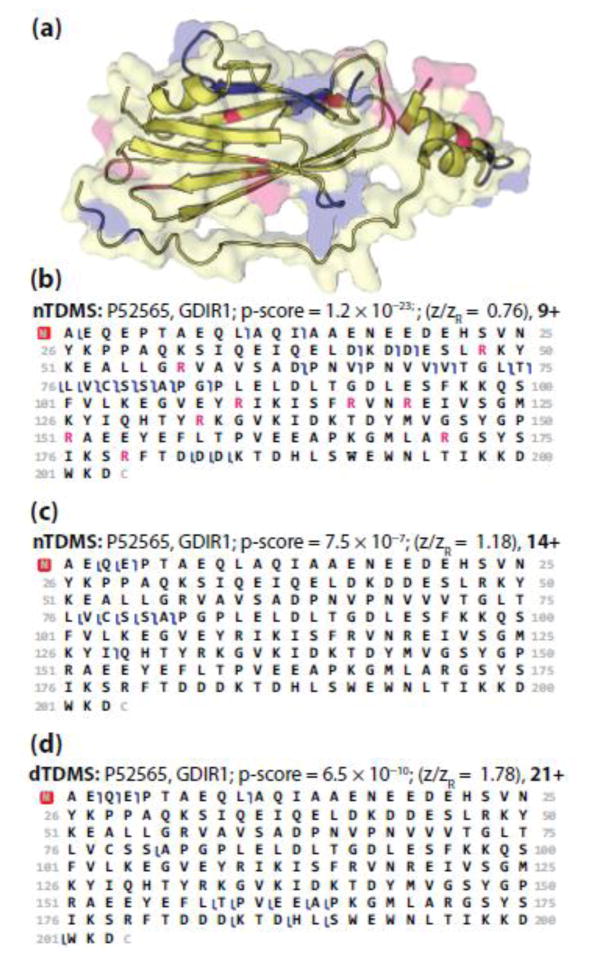
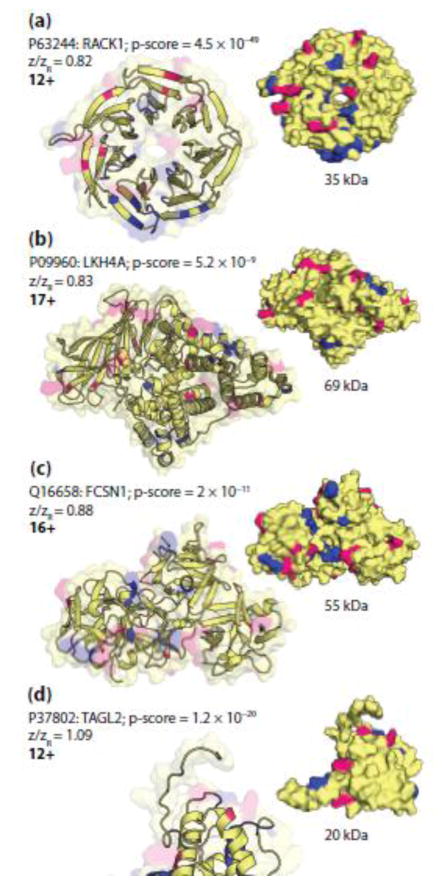
Fragmentation of intact proteins in the gas phase is influenced by amino acid composition, the mass and charge of precursor ions, higher order structure, and the dissociation technique used. The likelihood of fragmentation occurring between a pair of residues is referred to as the fragmentation propensity and is calculated by dividing the total number of assigned fragmentation events by the total number of possible fragmentation events for each residue pair. Here, we describe general fragmentation propensities when performing top-down mass spectrometry (TDMS) using denaturing or native electrospray ionization. A total of 5311 matched fragmentation sites were collected for 131 proteoforms that were analyzed over 165 experiments using native top-down mass spectrometry (nTDMS). These data were used to determine the fragmentation propensities for 399 residue pairs. In comparison to denatured top-down mass spectrometry (dTDMS), the fragmentation pathways occurring either N-terminal to proline or C-terminal to aspartic acid were even more enhanced in nTDMS compared with other residues. More generally, 257/399 (64%) of the fragmentation propensities were significantly altered (P ≤ 0.05) when using nTDMS compared with dTDMS, and of these, 123 were altered by 2-fold or greater. The most notable enhancements of fragmentation propensities for TDMS in native versus denatured mode occurred (1) C-terminal to aspartic acid, (2) between phenylalanine and tryptophan (F|W), and (3) between tryptophan and alanine (W|A). The fragmentation propensities presented here will be of high value in the development of tailored scoring systems used in nTDMS of both intact proteins and protein complexes. Graphical Abstract ᅟ.

Keywords: Fragmentation propensity; Native ESI; Native electrospray ionization; Native mass spectrometry; Residue fragmentation propensity; Tandem mass spectrometry; Top-down mass spectrometry.


Figures

Figure 1
Figure 1
(a) The distribution of assigned residue fragmentation events in nTDMS. The total number of events that were assigned for each residue N-terminal to fragmentation (top) or C-terminal to fragmentation (bottom). The expected number of assigned fragmentation events assuming a uniform fragmentation propensity across all 20 residues is shown as a dashed black line (n = 266 events). (b) Assigned fragmentation events deconstructed by residue pair. The expected number of fragmentation events assuming uniform propensities across all 400 possible pairs is shown in white (n = 13 events). For all panels, X|X’ refers to fragmentation occurring C-terminal to the amino acid residue whereas X|X’ refers to fragmentation occurring N-terminal to the amino acid residue.
Figure 2
Figure 2
(a) The HCD fragmentation propensities observed for the nTDMS dataset (purple) and dTDMS (turquoise) from Catherman, et al. [4]. The dashed black line at 8% represents the average fragmentation propensity across all residues from the nTDMS dataset. The top graph includes the fragmentation propensities for events occurring C-terminal to a given residue, whereas the bottom graph includes the fragment propensities for events occurring N-terminal to a given residue. (b) Residue fragmentation propensities for the nTDMS dataset. The asterisk on the cysteine|tryptophan pair indicates that no possible fragmentation event existed for that pair within the dataset. (c) Residue fragmentation propensities for the dTDMS dataset. For all panels, X|X’ refers to fragmentation occurring C-terminal to the amino acid residue whereas X|X’ refers to fragmentation occurring N-terminal to the amino acid residue.
Figure 3
Figure 3
nTDMS has a fewer number of highly preferred fragmentation pathways as compared to dTDMS. The fold-change in residue fragmentation propensity for nTDMS as compared to dTDMS. Blue indicates a decrease in fragmentation propensity in nTDMS as compared to dTDMS whereas red indicates an increase for nTDMS. Significant differences (p 0.05) are indicated with an asterisk. The yellow box for the cysteine|tryptophan pair indicates that no possible fragmentation event existed for the residue pair within the nTDMS dataset and, as such, a comparison cannot be made. X|X’ denotes fragmentation occurring C-terminal to the amino acid residue whereas X|X’ refers to fragmentation occurring N-terminal to the amino acid residue.
Figure 4
Figure 4
(a) A relationship between charge and precursor mass. Precursor ions were selected for fragmentation without consideration for charge state designation, which resulted in the inclusion of fragmentation data from precursors with high (pink) and intermediate (yellow) charge state designations. The yellow curve (y = 0.0778m½) represents the Rayleigh charge limit for each precursor, zR (see text and [75]). The pink curve (y = 0.1081m½) is the lower bound for the high charge state designation [56], which was determined by calculating the theoretical zHigh (zHigh = zR × 1.43) for each protein in the dataset. The blue curve (y = 0.0667m½) is the upper bound for the low charge state designation [56], which was determined by calculating the theoretical zLow (zLow = zR × 0.86) for each protein in the dataset. The graphical fragmentation maps for COF1 obtained by nTDMS of a “low” (b), “intermediate” (c), and “high” (d) charge state precursor ion as compared to dTDMS [4] of an “intermediate” (e) and “high” (f) charge state precursor ion. For panels b–f, blue flags represent matched fragment ions with mass tolerance of 15 ppm.
Figure 5
Figure 5
(a) The surface and cartoon models of GDIR1 (PDB ID: 1hh4 [88]). Pink represents arginine residues and blue highlights the residues involved in fragmentation of the 9+ precursor ion (panel b). The two disordered regions, one at the N-terminus [A2–A7] and the other near the flexible arm [V59–P65], are not included in the crystal structure, and thus not shown. The fragmentation maps of GDIR1 obtained using nTDMS for a low (b) and intermediate (c) charge state precursor ion as compared to fragmentation of a high (d) charge state precursor ion obtained using dTDMS [4]. For panels b–d, blue flags represent matched fragment ions with mass tolerance of 15 ppm. In panel b, arginine residues are colored pink to match the arginine residues highlighted in panel a.
Figure 6
Figure 6
The cartoon (left) and surface (right) models of (a) RACK1 (PDB ID: 4aow [89]), (b) LKH4A (PDB ID: 4rvb), (c) TAGL2 (PDB ID: 1wym), and (d) FCSN1 (PDB ID: 3llp [90]). Pink represents arginine residues and blue highlights the residues involved in fragmentation. Panels (a) and (b) represent examples of precursor ions with low charge state designations (<0.86) whereas panels (c) and (d) represent examples of precursor ions with intermediate charge state designations (0.86 < z/zR < 1.43).

References

    1. Catherman AD, Skinner OS, Kelleher NL. Top Down proteomics: facts and perspectives. Biochem Biophys Res Commun. 2014;445:683–693. - PMC - PubMed
    1. Toby TK, Fornelli L, Kelleher NL. Progress in Top-Down Proteomics and the Analysis of Proteoforms. Annu Rev Anal Chem. 2016;9:499–519. - PMC - PubMed
    1. Tran JC, Zamdborg L, Ahlf DR, Lee JE, Catherman AD, Durbin KR, Tipton JD, Vellaichamy A, Kellie JF, Li M, Wu C, Sweet SM, Early BP, Siuti N, LeDuc RD, Compton PD, Thomas PM, Kelleher NL. Mapping intact protein isoforms in discovery mode using top-down proteomics. Nature. 2011;480:254–258. - PMC - PubMed
    1. Catherman AD, Durbin KR, Ahlf DR, Early BP, Fellers RT, Tran JC, Thomas PM, Kelleher NL. Large-scale top-down proteomics of the human proteome: membrane proteins, mitochondria, and senescence. Mol Cell Proteomics. 2013;12:3465–3473. - PMC - PubMed
    1. Durbin KR, Fornelli L, Fellers RT, Doubleday PF, Narita M, Kelleher NL. Quantitation and Identification of Thousands of Human Proteoforms below 30 kDa. J Proteome Res. 2016;15:976–982. - PMC - PubMed