. 2017 Sep;161(1):109-123.
doi: 10.1111/ppl.12572. Epub 2017 May 23.

A model for the irradiance responses of photosynthesis

Affiliations

A model for the irradiance responses of photosynthesis

Jeremy Harbinson et al. Physiol Plant. 2017 Sep.

Abstract

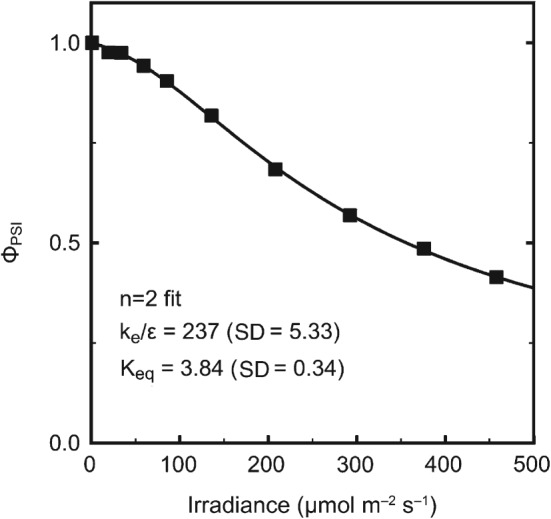
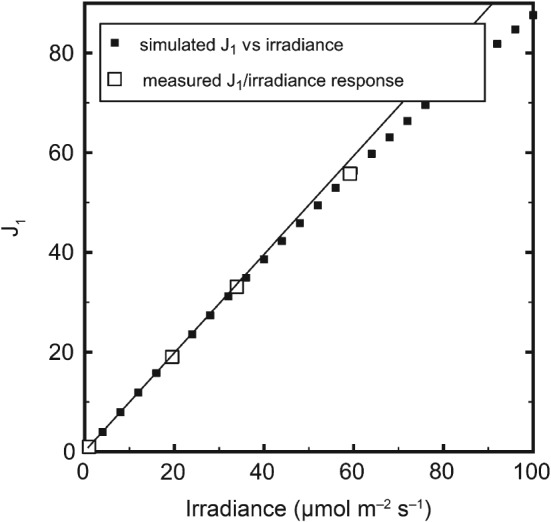
The analysis of the irradiance responses of photosynthetic processes, such as the quantum efficiencies of electron transport by photosystems I and II (PSI and PSII) or the rate of carbon dioxide fixation, is limited by the lack of mechanistically based analytical model for these processes. Starting with a model of P700 redox state, we develop a series of analytical functions which can be used to fit the irradiance responses of the quantum yields for electron transport by PSI and PSII, the irradiance responses of electron transport by PSI and PSII, and even the irradiance response of the fixation rate of carbon dioxide. These functions depend on two or three parameters so they can be fit to typical irradiance response data. We illustrate by example the use of these functions in various applications and discuss further use and development of the basic model described in detail here.


Figures

Figure 1
Figure 1
The basic physical structures that are reproduced in the models for 0, 1 and 2 donors. ‘P’ is P700 while ‘D’ is the lumped donor pool within the high‐potential chain part of the photosynthetic electron transport chain. Oxidation of P700 occurs via steps kx, while electron transfer from the PQH2 pool to the lumped donor pool occurs via steps ke, and redox equilibration between P700 and the donor pool occurs via steps ‘K’. The oxidized forms of P700 are on the right side, and the reduced forms on the left side, of the diagram.
Figure 2
Figure 2
(A) The irradiance dependency of ΦPSI (the relative quantum yield for PSI electron transport) and ke – the pseudo‐first order rate constant for reduction of P700 + by electrons derived from the oxidation of PQH2. These measurements were made on a leaf of Juanulloa aurantiaca. These data are (and other similar data from this leaf) presented to demonstrate the use of the models outlined here. (B) A fit using an n = 0 form (i.e. zero high‐potential chain donors to P700) of the ΦPSI/irradiance model to an experimentally measured ΦPSI/irradiance response obtained from a leaf of J. aurantiaca.
Figure 3
Figure 3
A fit using an n = 1 form (i.e. one high‐potential chain donor to P700) of the ΦPSI/irradiance model to an experimentally measured ΦPSI/irradiance response obtained from a leaf of Juanulloa aurantiaca. Keq is unitless, while ke/ϵ has units of mol−1 m2.
Figure 4
Figure 4
A fit using an n = 2 form (i.e. two high‐potential chain donors to P700) of the ΦPSI/irradiance model to an experimentally measured ΦPSI/irradiance response obtained from a leaf of Juanulloa aurantiaca.
Figure 5
Figure 5
A fit using an n = 3 form (i.e. three high‐potential chain donors to P700) of the ΦPSI/irradiance model to an experimentally measured ΦPSI/irradiance response obtained from a leaf of Juanulloa aurantiaca.
Figure 6
Figure 6
Fits using an n = 3 form of the ΦPSI/irradiance model to experimentally measured ΦPSI/irradiance responses obtained from leaves of Pisum sativum (A) and Prunus laurocerasus (B).
Figure 7
Figure 7
The effect of varying the ke/ϵ parameter, while keeping the Keq parameter fixed, on calculated ΦPSI/irradiance responses; these responses were calculated using an n = 2 version of the ΦPSI/irradiance model and the fit shown in Fig. 4 was used as a template, and is included in this figure as a reference.
Figure 8
Figure 8
The effect of varying the Keq parameter, while keeping the ke/ϵ parameter fixed, on calculated ΦPSI/irradiance responses; these responses were calculated using an n = 2 version of the ΦPSI/irradiance model and the fit shown in Fig. 4 was used as a template, and is included in this figure as a reference.
Figure 9
Figure 9
A fit to an experimentally determined irradiance response of JI (ΦPSI times irradiance; derived from the dataset shown in Fig. 2) using a version of the n = 2 form of the ΦPSI/irradiance model modified to simulate the irradiance response of PSI electron transport.
Figure 10
Figure 10
The effect of varying the ke/ϵ parameter, while keeping the Keq parameter fixed, on calculated JI/irradiance responses; these responses were calculated using an n = 2 version of the JI/irradiance model and the fit shown in Fig. 9 was used as a template, and is included in this figure as a reference.
Figure 11
Figure 11
The effect of varying the Keq parameter, while keeping the ke/ϵ parameter fixed, on calculated JI/irradiance responses; these responses were calculated using an n = 2 version of the JI/irradiance model and the fit shown in Fig. 9 was used as a template, and is included in this figure as a reference.
Figure 12
Figure 12
The actual JI/irradiance responses measured at low irradiances (as shown in Fig. 9 at a larger scale), and the simulated JI/low irradiance responses calculated using the fitted parameters obtained by fitting the n = 2 JI/irradiance model to the data shown in Fig. 9. The diagonal line was fit by eye through the linear phase of the response at the lowest irradiances.
Figure 13
Figure 13
A fit using an n = 2 form (i.e. derived from the version with two high‐potential chain donors to P700) of the ΦPSII/irradiance model to an experimentally measured ΦPSII/irradiance response obtained from a leaf of Juanulloa aurantiaca and using a 660 nm excitation wavelength for chlorophyll fluorescence. In this example, all datapoints (including the dark adapted Fv/Fm) have been fit by the function.
Figure 14
Figure 14
(A) A fit using an n = 2 form (i.e. derived from the version with two high‐potential chain donors to P700) of the ΦPSII/irradiance model to an experimentally measured ΦPSII/irradiance response obtained from a leaf of Juanulloa aurantiaca. In this example point corresponding to the dark adapted Fv/Fm was excluded from the fit. (B) A closer view of the fits to ΦPSII/irradiance response at low irradiances in which the dark‐adapted Fv/Fm is included (Fig. 13; dotted line) or excluded from the fit (Fig. 14B; solid line).
Figure 15
Figure 15
A fit using an n = 2 form (i.e. derived from the version with two high‐potential chain donors to P700) of the ΦPSII/irradiance model to an experimentally measured ΦPSII/irradiance response obtained from a leaf of Juanulloa aurantiaca and using a 560 nm excitation wavelength for chlorophyll fluorescence (open symbols); the values for the estimated parameters shown in the figure are for the 560 nm excitation derived data. The estimated curve for this data can be mapped accurately onto the curve obtained using 660 nm as an excitation wavelength (solid symbols; Fig. 13) by adjusting the value of ke/ϵ obtained by fitting the 560‐nm dataset.
Figure 16
Figure 16
A fit using an n = 2 form of the ΦPSI/irradiance model modified to fit carbon dioxide fixation rate/irradiance data to an experimentally measured carbon dioxide/irradiance response obtained from a leaf of Juanulloa aurantiaca. The solid line shows the fit obtained to all datapoints available (solid and open symbols) while the dotted line shows the fit obtained when using a limited subset of the data (solid symbols alone).
Figure 17
Figure 17
The calculated ΦCO2/irradiance response of the carbon dioxide fixation rate/irradiance relationship shown in Fig. 16.

Similar articles

Cited by

References

    1. Anderson JM (1992) Cytochrome b6f complex: dynamic molecular organization, function and acclimation. Photosynth Res 34: 341–357 - PubMed
    1. Badeck FW (1995) Intra‐leaf gradient of assimilation rate and optimal allocation of canopy nitrogen: a model on the implications of the use of homogeneous assimilation functions. Funct Plant Biol 22: 425–439
    1. Baker NR, Harbinson J, Kramer DM (2007) Determining the limitations and regulation of photosynthetic energy transduction in leaves. Plant Cell Environ 30: 1107–1125 - PubMed
    1. Björkman O, Demmig B (1987) Photon yield of O2 evolution and chlorophyll fluorescence characteristics at 77 K among vascular plants of diverse origins. Planta 170: 489–504 - PubMed
    1. Cape JL, Bowman MK, Kramer DM (2006) Understanding the cytochrome bc complexes by what they don't do. The Q‐cycle at 30. Trends Plant Sci 11: 46–55 - PubMed

MeSH terms

Substances

LinkOut - more resources