. 2017 Apr 4:8:14896.
doi: 10.1038/ncomms14896.

Human seizures couple across spatial scales through travelling wave dynamics

Affiliations

Human seizures couple across spatial scales through travelling wave dynamics

L-E Martinet et al. Nat Commun. .

Abstract

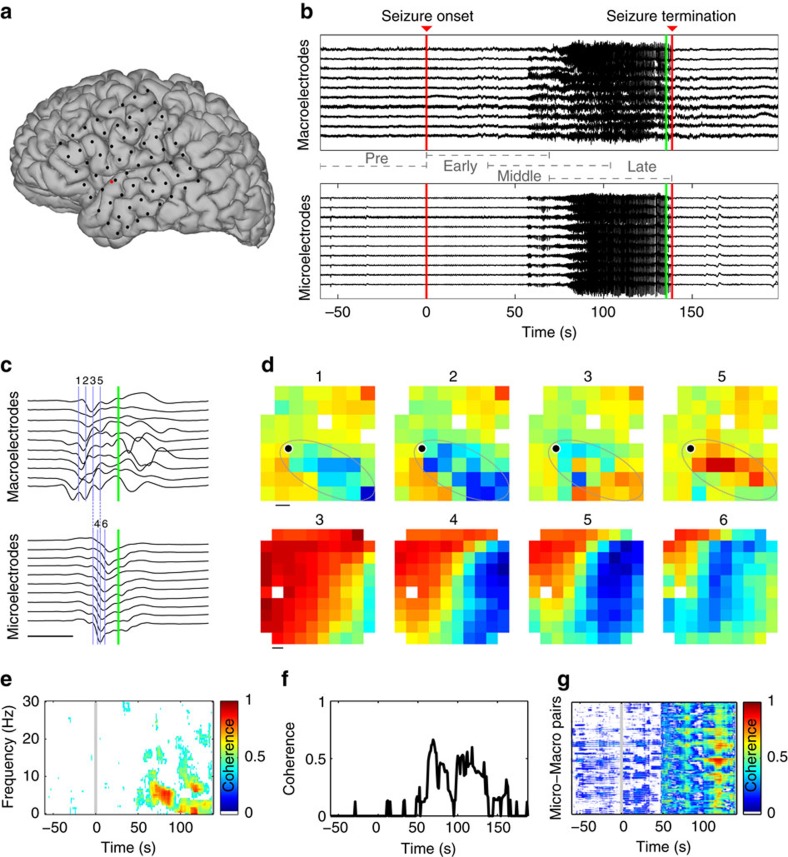
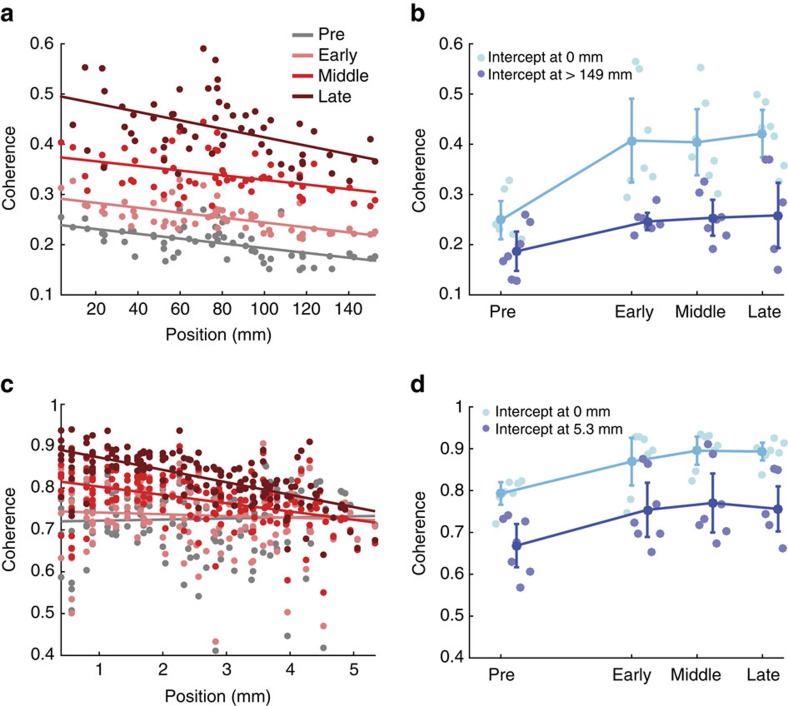
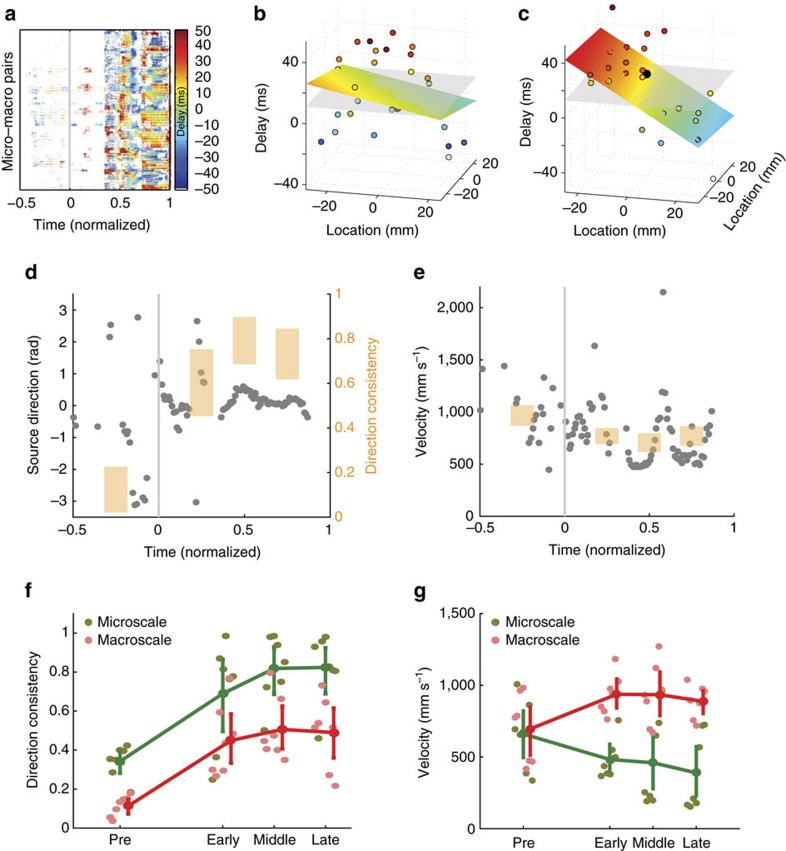
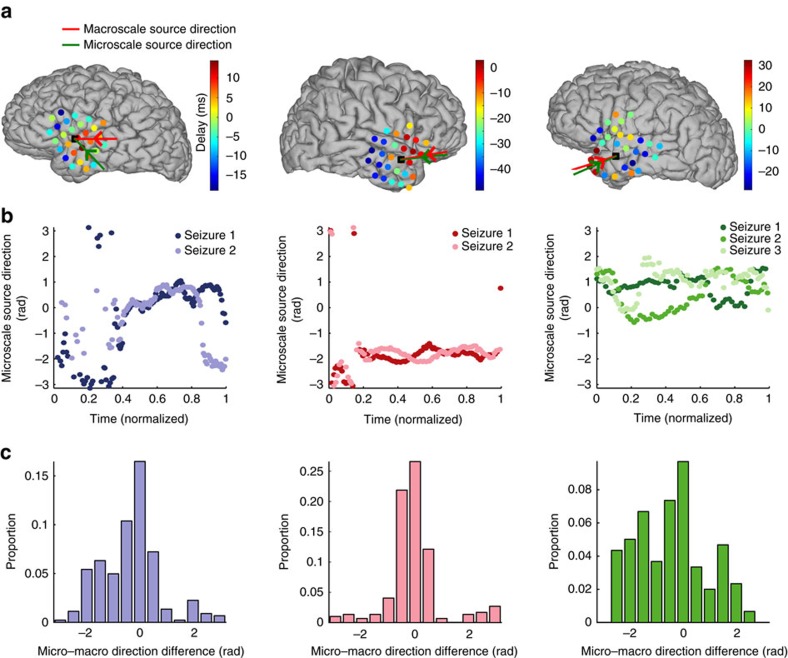
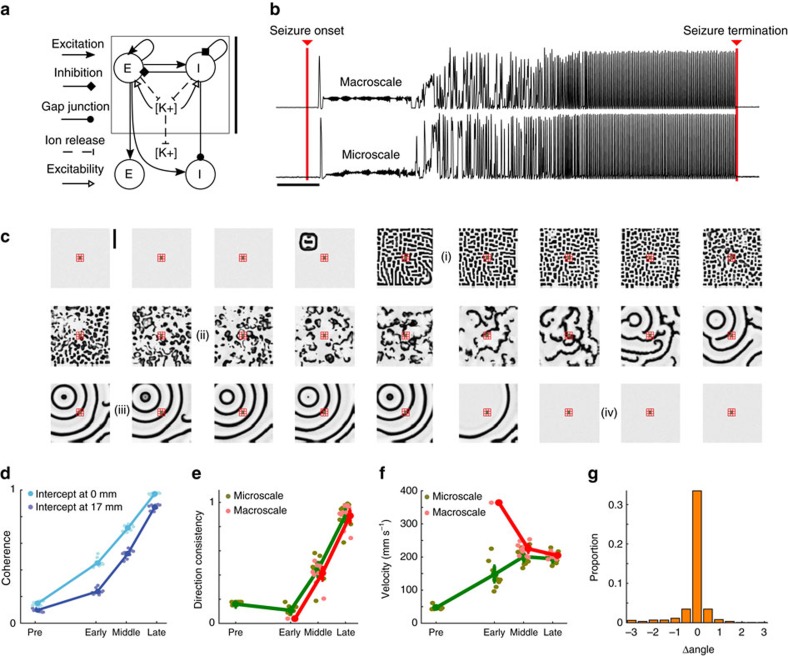
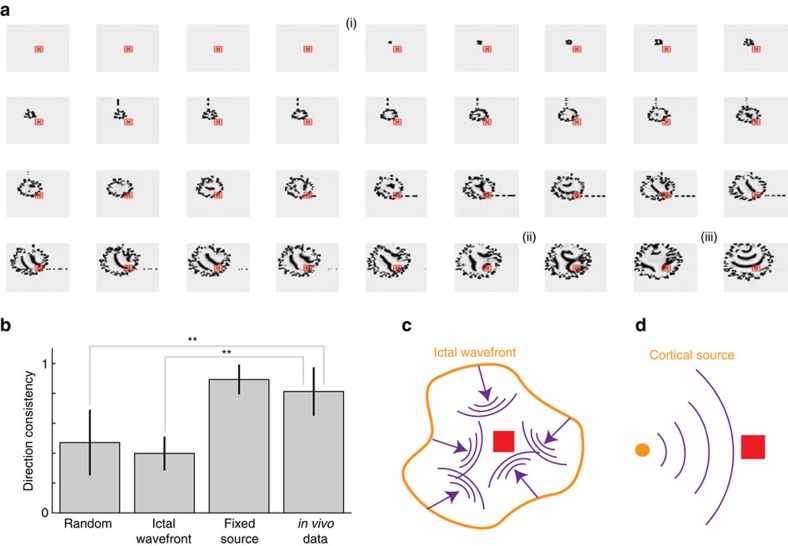
Epilepsy-the propensity toward recurrent, unprovoked seizures-is a devastating disease affecting 65 million people worldwide. Understanding and treating this disease remains a challenge, as seizures manifest through mechanisms and features that span spatial and temporal scales. Here we address this challenge through the analysis and modelling of human brain voltage activity recorded simultaneously across microscopic and macroscopic spatial scales. We show that during seizure large-scale neural populations spanning centimetres of cortex coordinate with small neural groups spanning cortical columns, and provide evidence that rapidly propagating waves of activity underlie this increased inter-scale coupling. We develop a corresponding computational model to propose specific mechanisms-namely, the effects of an increased extracellular potassium concentration diffusing in space-that support the observed spatiotemporal dynamics. Understanding the multi-scale, spatiotemporal dynamics of human seizures-and connecting these dynamics to specific biological mechanisms-promises new insights to treat this devastating disease.


Conflict of interest statement

The authors declare no competing financial interests.

Figures

Figure 1
Figure 1. Analysis of coherence within and between spatial scales reveals evolution of inter-scale coupling during seizure.
(a) Example electrode configuration at the macroscopic and microscopic spatial scales. Each black circle indicates a macroelectrode on the cortical surface. The red circle indicates the location of a 4 mm by 4 mm microelectrode array containing 96 electrodes. (b,c) Example voltage traces recorded simultaneously from macroelectrodes (upper) and microelectrodes (lower) during (b) seizure and during (c) a single spike-and-wave event. The green vertical bars indicate the same time point in both subfigures. The blue vertical bars and labels in c correspond to the voltage maps in d. Four intervals (pre-seizure, early seizure, middle seizure and late seizure) are indicated in b. Scale bar in c indicates 100 ms (c). (d) Example voltage maps from the macroelectrodes (upper) and microelectrodes (lower) during the spike-and-wave event in (c). Warm (cool) colours indicate high (low) voltages. Maps labelled 1, 2, 3 and 5 are spaced by 16 ms, while maps labelled 3, 4, 5 and 6 are spaced by 8 ms (see vertical blue bars in c). The approximate area of macroscopic propagation is indicated by a grey ellipse in the top row. Upper scale bar indicates 1 cm, lower scale bar indicates 0.4 mm. (e) Example coherogram between a microelectrode and macroelectrode pair. Warm (cool) colours indicate high (low) coherence. Only significant coherence values are shown (P<0.005, not corrected for multiple comparisons, see Methods). (f,g) Average coherence from 1 to 13 Hz between (f) the microelectrode and macroelectrode pair in (e), and (g) all microelectrode-to-macroelectrode pairs versus time. In g, warm (cool) colours indicate high (low) coherence.
Figure 2
Figure 2. Coherence increases during seizure between spatial scales are not spatially uniform.
(a) Example average inter-scale coherence (1–13 Hz) between the microelectrodes and macroelectrodes versus distance for a single patient and seizure. Each dot represents the coherence and distance of a macroelectrode during four intervals; grey, pre-seizure; pink, early seizure; red, middle seizure; maroon, late seizure (Fig. 1b). The lines indicate linear regression estimates for each interval. (b) Summary of the left-intercepts (light blue) and right-intercepts (dark blue) of the linear regression of inter-scale coherence versus distance for each patient and seizure. Each circle indicates the result for an individual seizure (n=7) in four intervals: pre-seizure, early seizure, middle seizure and late seizure. Circles with vertical lines denote the population mean; error bars indicate two s.e. of the mean. (c,d) Same as a,b for the coherence between microelectrodes.
Figure 3
Figure 3. Travelling waves of activity propagate within each spatial scale during seizure.
(a) Example of the delays between all pairs of microelectrodes and macroelectrodes versus normalized time. Positive (negative) delays are indicated with warm (cool) colours. Intervals that lack significant coherence or fit are white (see Methods). Seizure onset begins at time 0 and ends at time 1. (b,c) Examples of robust multiple linear regression of the delay values (circles, vertical axis) versus position on the macroelectrode array. The fit plane is indicated in colour, and the null model in grey. Example of a poorly fit (b) and well fit (c) spatial distribution of delays. (d,e) The estimated (d) source direction and (e) velocity deduced from the multiple linear regression fit versus time for an example seizure from one patient. Each dot indicates the estimate at a moment in time; a time without a dot indicates that a significant value (see Methods) was not found. The four shaded bars are centered at the mean direction consistency (d, right vertical axis), or mean velocity (f) estimated in four time intervals of equal size: before the seizure (at negative normalized time) and during three intervals of seizure. The height of each bar indicates the 95% confidence interval. (f,g) Population results (n=7) for the (f) direction consistency and (g) velocity. The direction consistency increases significantly during seizure. The velocity increases significantly during seizure at the macroscale; see Methods.
Figure 4
Figure 4. Waves propagate in similar directions across a patient's seizures and between spatial scales.
(a) Average delay at each macroelectrode (circles) and source direction at the macroscale (red arrow) and microscale (green arrow) for each patient during a single seizure. Delays range from 32 ms to −48 ms. The location of the MEA is indicated by a black square. (b) The source directions at the microscale versus (normalized) time are similar for each seizure (colour) of the three patients, but not between patients. (c) The distribution of circular direction differences between the source directions at the microscale and macroscale during seizure concentrate near 0.
Figure 5
Figure 5. A mean-field model of cortical activity and diffusion of extracellular potassium reproduces the spatial-temporal dynamics of human seizure.
(a) Cartoon illustration of the model. Excitatory (E) and inhibitory (I) neural populations interact through synaptic interactions and gap junctions between spatial neighbours. Activity of either cell population increases the local extracellular potassium concentration, which diffuses in space. Vertical scale bar on the right of the panel indicates 3 mm. (b) Example traces of simulated activity at a macroelectrode (upper row) and microelectrode (lower row). The red bars labelled ‘Seizure onset' and ‘Seizure termination' indicate the time when the excitability of the cortical source was increased and decreased, respectively (see Methods). Scale bar indicates 10 s. (c) Example spatial maps of simulated activity. Each subfigure shows a snapshot of the excitatory population activity (white 0 Hz, black 25 Hz) on the 30 cm by 30 cm surface; the time between subfigures is 5 s and time progresses from left to right, top to bottom. The cortical source (visible near the upper left corner in the fourth subfigure) ignites the activity. A static mosaic pattern (i) then appears, followed by spatially local propagation (ii) and concluding in travelling waves driven by the seizure source (iii). When the source is inactivated (iv), propagation ceases. The simulated microelectrodes (green) and macroelectrodes (red) are indicated near the center of each map. Vertical scale bar in top left panel indicates 10 cm. (dg) Simulated dynamics at each scale produce results consistent with the in vivo data. (d) A linear fit of the coherence versus distance reveals an increase in the left and right intercepts during seizure. (e) The direction consistency increases during seizure and (f) the velocity approaches values between 100 and 300 mm s−1 during seizure. (g) The difference in source direction between spatial scales concentrates at 0 radians. In all figures, mean and s.e. of the mean computed as in Figs 2 and 3, with n=10.
Figure 6
Figure 6. Simulations of an expanding ictal wavefront produce direction consistency measures inconsistent with the in vivo data.
(a) Example spatial maps of simulated activity for a simple expanding ictal wavefront scenario. The arrangement and colour scale are the same as in Fig. 5a. An ictal wavefront emerges (i) and slowly recruits cortical territory. As the ictal wavefront expands, travelling waves propagate into the recruited territory from different directions; compare (ii) and (iii). (b) The direction consistency during the last half of seizure in three simulation scenarios and for the in vivo data. Compared to the in vivo data, the direction consistency is significantly lower during the second half of seizure for the random source locations and expanding ictal wavefront simulations; **P<0.005, two-sided t-test. (c,d) Schematic representations for two related scenarios of cortical wave activity during seizure. In c, the expanding ictal wavefront (orange) evolves in space to produce travelling waves (purple) that propagate to the microelectrode array (red) from different directions. In d, a cortical source (orange) produces waves (purple) that impact the microelectrode array (red) from the same direction.

References

    1. Sejnowski T. J., Churchland P. S. & Movshon J. A. Putting big data to good use in neuroscience. Nat. Neurosci. 17, 1440–1441 (2014). - PMC - PubMed
    1. Steinlein O. K., Kaneko S & Hirose S. in Jasper's Basic Mechanisms of the Epilepsies (National Center for Biotechnology Information (US), 2012). - PubMed
    1. Staley K. Molecular mechanisms of epilepsy. Nat. Neurosci. 18, 367–372 (2015). - PMC - PubMed
    1. Schomer, D. L. & Lopes da Silva, F. H. (eds) Niedermeyer's Electroencephalography: Basic Principles, Clinical Applications, and Related Fields. (Lippincott Williams & Wilkins, 2010).
    1. Gibbs F. A., Gibbs E. L. & Lennox W. G. Epilepsy: a paroxysmal cerebral dysrhythmia. Epilepsy Behav. EB 3, 395–401 (2002). - PubMed

Publication types

LinkOut - more resources