

doi: 10.1038/srep45808.
XTEND: Extending the depth of field in cryo soft X-ray tomography
Affiliations
- PMID: 28374769
- PMCID: PMC5379191
- DOI: 10.1038/srep45808
Item in Clipboard
XTEND: Extending the depth of field in cryo soft X-ray tomography
Sci Rep.
.
Abstract
We have developed a new data collection method and processing framework in full field cryo soft X-ray tomography to computationally extend the depth of field (DOF) of a Fresnel zone plate lens. Structural features of 3D-reconstructed eukaryotic cells that are affected by DOF artifacts in standard reconstruction are now recovered. This approach, based on focal series projections, is easily applicable with closed expressions to select specific data acquisition parameters.
Conflict of interest statement
The authors declare no competing financial interests.
Figures
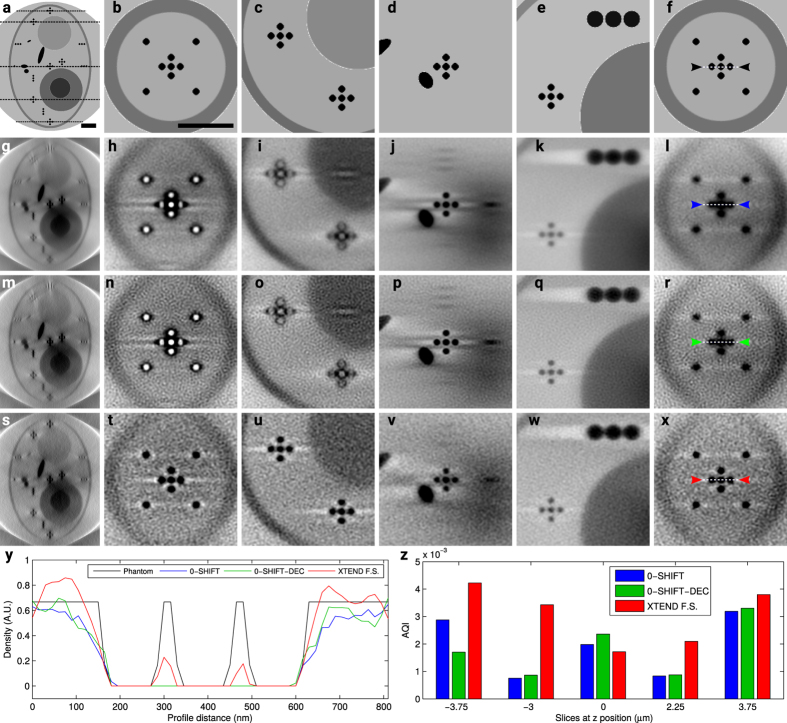
Comparison of the different collection methods on a simulated 9 μm thick pseudo candida albicans cell tomography imaged by a 40 nm FZP in a totally incoherent situation (48.8 nm resolution, 2.63 μm DOF): phantom (first row), 0-shift (second), 0-shift-dec (third) and XTEND (fourth) reconstructions; (a,g,m,s) x–z planes where x–y slices at z-positions −3.75 μm (b,h,n,t), −3 μm (c,i,o,u), 0 μm (d,j,p,v), 2.25 μm (e,k,q,w) and 3.75 μm (f,l,r,x) are marked. Scale bars = 1 μm. (y) Density profiles along the paths pointed between color markers (0-shift, 0-shift-dec and XTEND in blue, green and red, respectively) in slices (l,r,x) compared to reference profile (f) (black markers). (z) AQI calculated for slice triplets (h,n,t), (i,o,u), (j,p,v), (k,q,w) and (l,r,x).
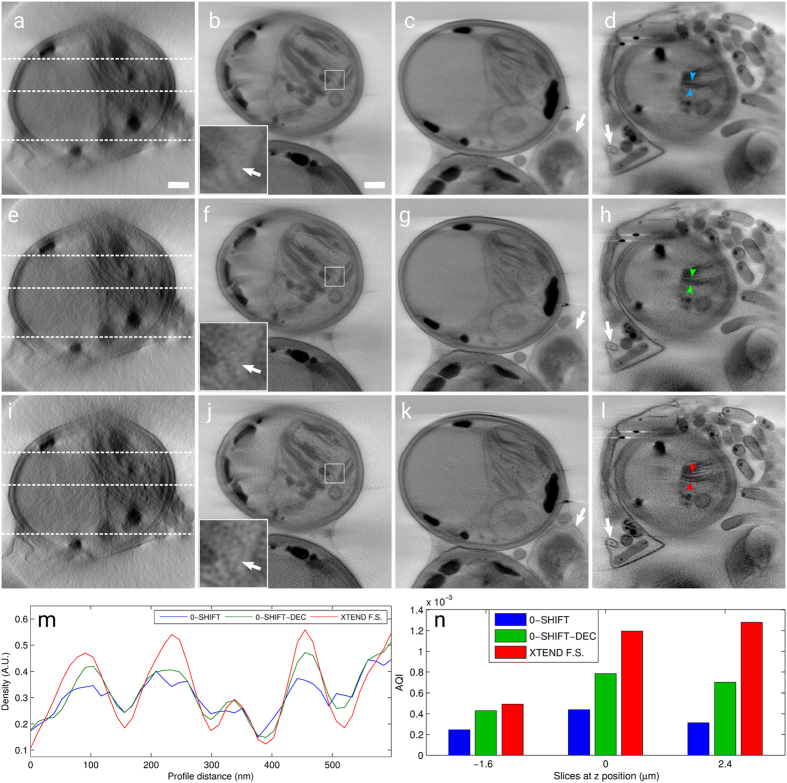
Comparison of the different collection methods on a Scenedemus cell experimental tomography imaged by a 40 nm FZP at Mistral microscope (61.9 nm resolution, 3.3 μm DOF): 0-shift (first row), 0-shift-dec (second) and XTEND (third) reconstructions; (a,e,i) x–z planes where x–y slices at positions −1.6 μm (b,f,j), 0 μm (c,g,k) and 2.4 μm (d,h,l) are marked. Scale bars = 1 μm. (m) Density profiles along the paths pointed between color markers (0-shift, 0-shift-dec and XTEND in blue, green and red, respectively) in slices (d,h,l). (n) AQI calculated for slice triplets (b,f,j), (c,g,k) and (d,h,l).
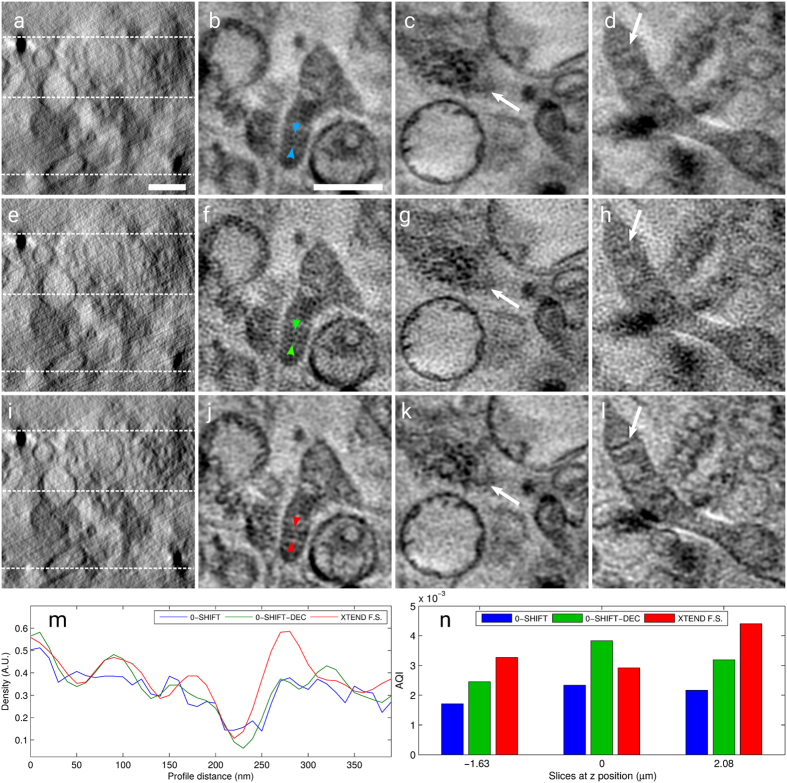
Comparison of the different collection methods on a HT-29 cell experimental tomography imaged by a 25 nm FZP at Mistral microscope (51.8 nm resolution, 1.6 μm DOF): 0-shift (first row), 0-shift-dec (second) and XTEND (third) reconstructions; (a,e,i) x–z planes where x–y slices at positions −1.63 μm (b,f,j), 0 μm (c,g,k) and 2.08 μm (d,h,l) are marked. Scale bars = 1 μm. (m) Density profiles along the paths pointed between color markers (0-shift, 0-shift-dec and XTEND in blue, green and red, respectively) in slices (d,h,l). (n) AQI calculated for slice triplets (b,f,j), (c,g,k) and (d,h,l).
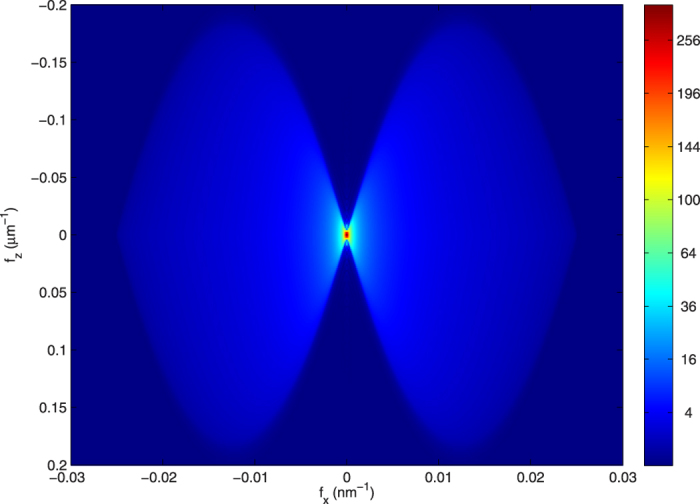
Simulation was calculated for an ideal lens under totally incoherent illumination, with same characteristics as a zone plate with 40 nm of outermost zone width, 937 zones and 520 eV illumination energy. Both lobes of the figure mark the specimen Fourier coefficients over fz that contribute to the projection, which is calculated by integration over fz.

Solid blue line denotes the 3D-OTF profile over the fz axis at  of the optical system (see Fig. 4). The profile of the sample to be considered totally in-focus is defined by the 3D-OTF profile of a lens with twice the DOF of the optical system (dashed blue line). The resulting ideal sinc envelope profile for M ≫ 1 focal series projections is depicted by a dashed black line. Envelope profiles using correction factor α = 0.85 for M = 2,3,4 and M ≫ 1 are plotted in solid green, red, cyan and black lines, respectively. The use of only two focal series projections introduces an inversion of contrast at high frequencies. When M = 3,4, however, the resulting envelopes differ slightly from that of the ideal M ≫ 1.
of the optical system (see Fig. 4). The profile of the sample to be considered totally in-focus is defined by the 3D-OTF profile of a lens with twice the DOF of the optical system (dashed blue line). The resulting ideal sinc envelope profile for M ≫ 1 focal series projections is depicted by a dashed black line. Envelope profiles using correction factor α = 0.85 for M = 2,3,4 and M ≫ 1 are plotted in solid green, red, cyan and black lines, respectively. The use of only two focal series projections introduces an inversion of contrast at high frequencies. When M = 3,4, however, the resulting envelopes differ slightly from that of the ideal M ≫ 1.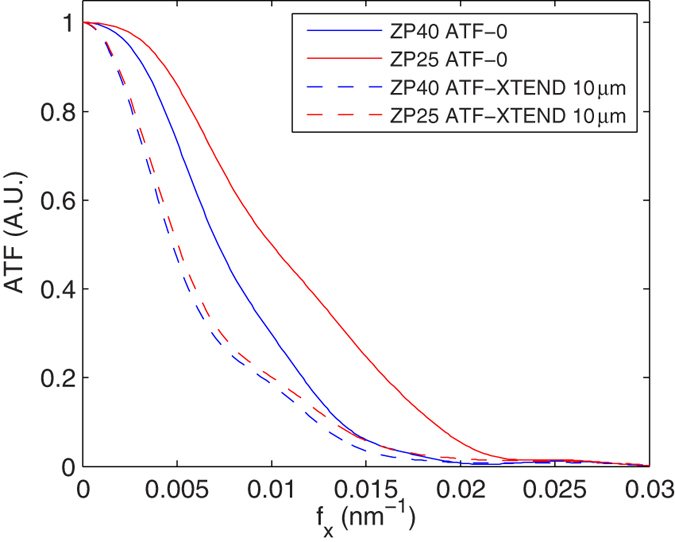
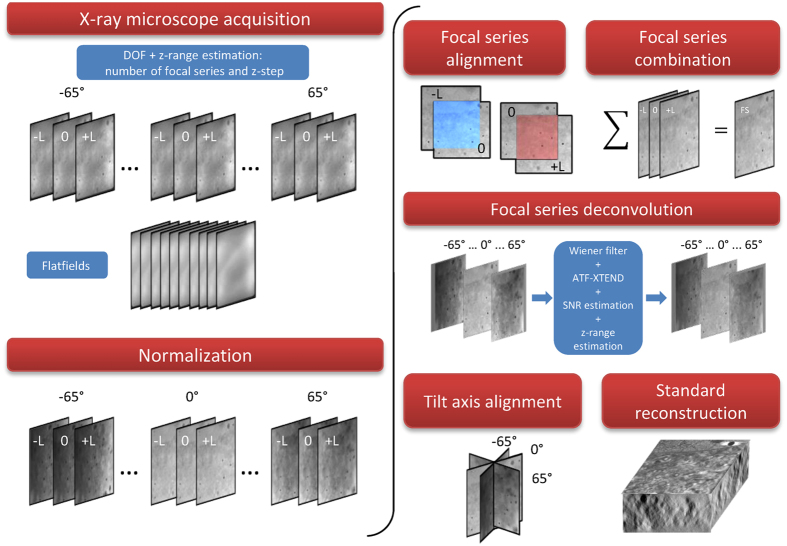
For 3 focal series projections, images are acquired at z-positions −L, 0 and +L. Image projections are normalized using flatfield images. Focal series projections −L and +L are aligned to reference 0-shift at each tilt angle and combined by averaging. Averaged projections stack is deconvolved by synthetic ATF-XTEND considering z-range and the SNR from projections and flatfields. Once deconvolved, the XTEND projections are then aligned to the common tilt axis and reconstructed using standard algorithms.
References
-
- Chao W. et al.. Real space soft x-ray imaging at 10 nm spatial resolution. Opt. Express 20, 9777–83 (2012). - PubMed
-
- Kirz J., Jacobsen C. & Howells M. Soft X-ray microscopes and their biological applications. Q. Rev. Biophys. 28, 33–130 (1995). - PubMed
-
- Selin M. et al.. 3D simulation of the image formation in soft x-ray microscopes. Opt. Express 22, 30756 (2014). - PubMed
-
- Oton J. et al.. Image formation in cellular X-ray microscopy. J. Struct. Biol. 178, 29–37 (2012). - PubMed
-
- Klukowska J. & Herman G. T. Reconstruction from Microscopic Projections with Defocus-Gradient and Attenuation Effects. In Herman G. T. & Frank J. (eds) Comput. Methods Three-Dimensional Microsc. Reconstr.chap. 7, 157–186 (Springer: New York, 2014).
Publication types
MeSH terms
LinkOut - more resources
Full Text Sources
Other Literature Sources
