. 2017 Apr 4:7:45750.
doi: 10.1038/srep45750.

Quantification of bioluminescence from the surface to the deep sea demonstrates its predominance as an ecological trait

Affiliations

Quantification of bioluminescence from the surface to the deep sea demonstrates its predominance as an ecological trait

Séverine Martini et al. Sci Rep. .

Abstract

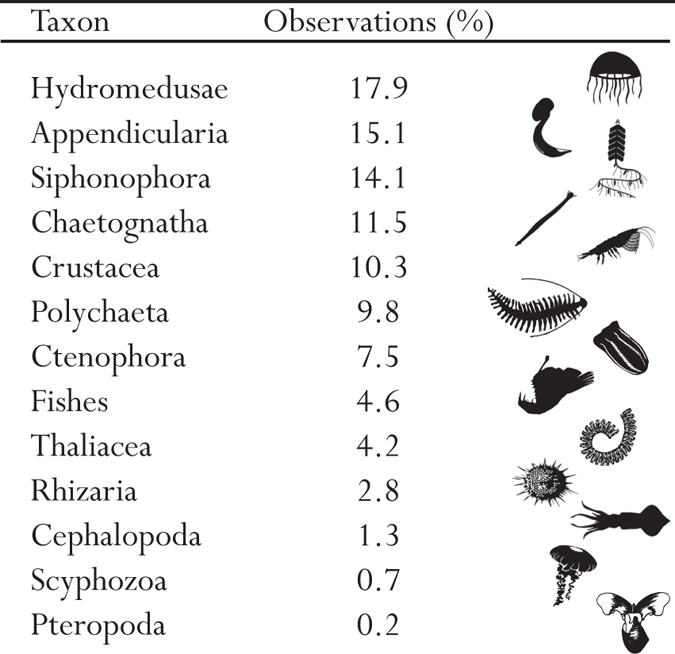
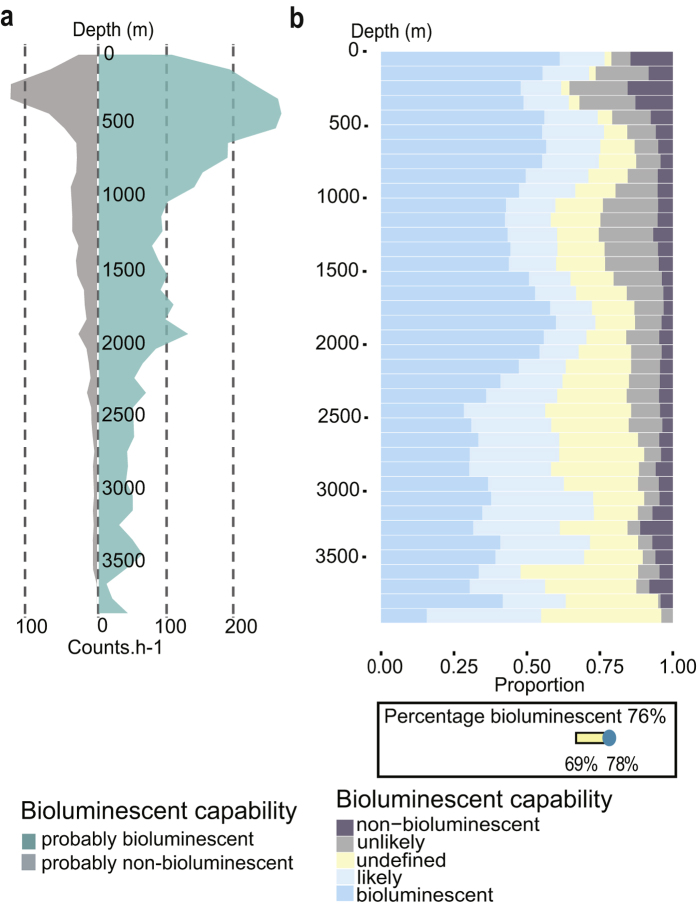
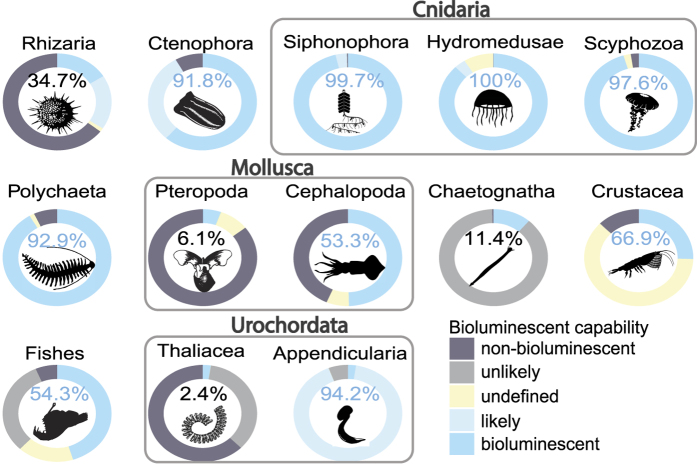
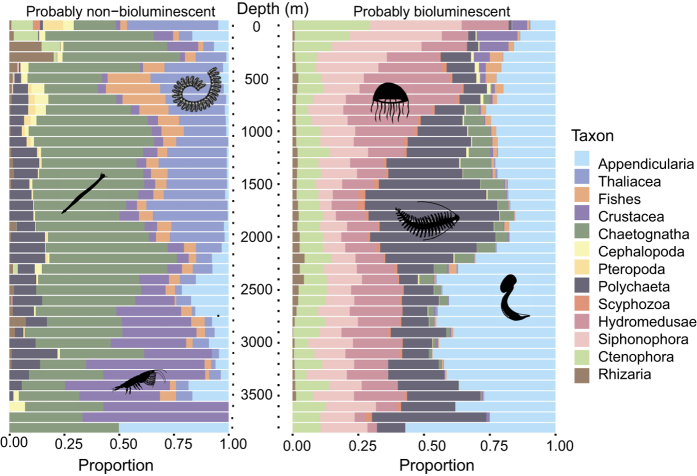
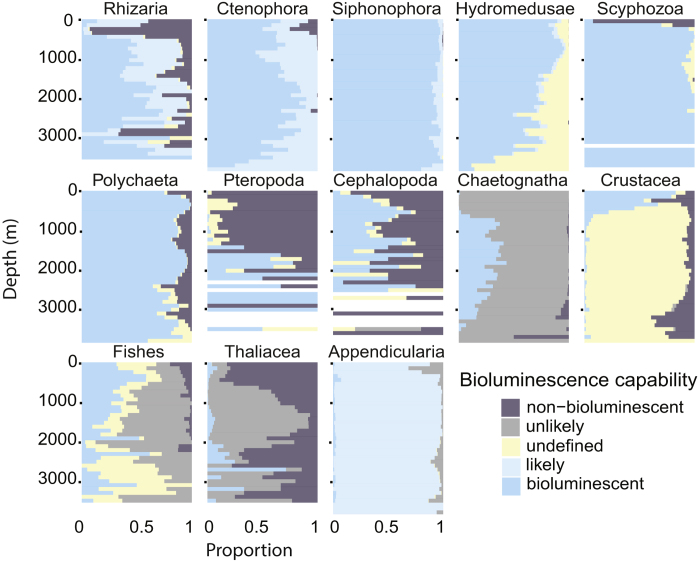
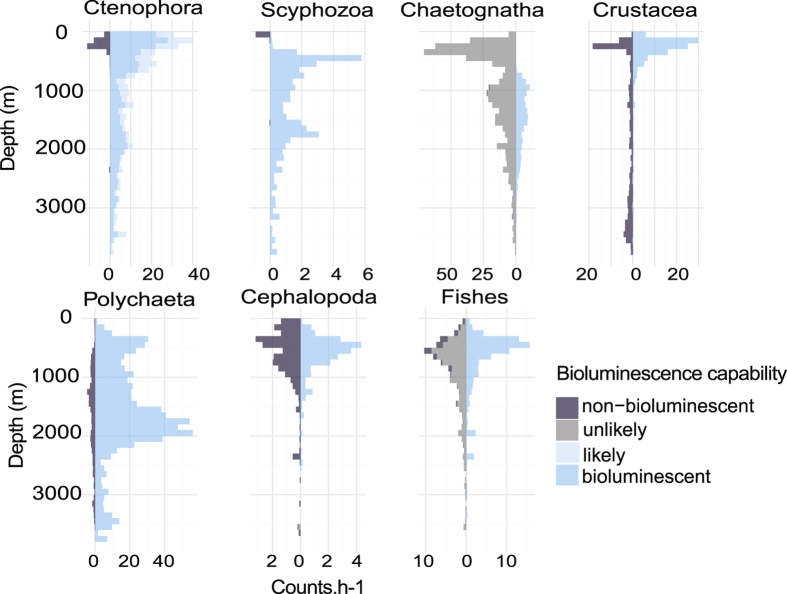
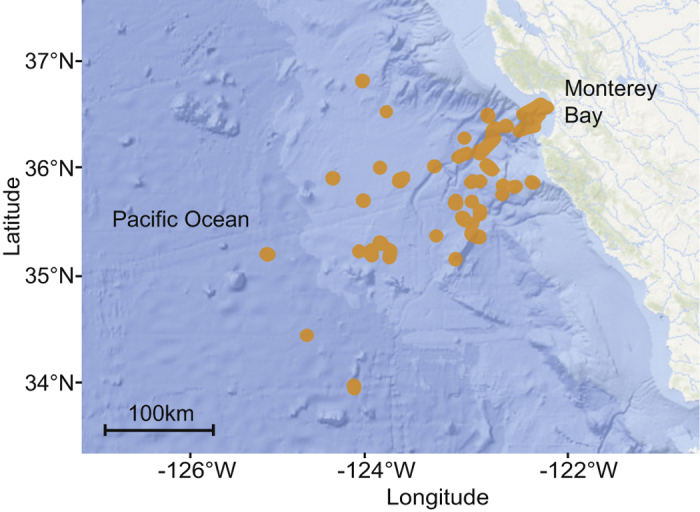
The capability of animals to emit light, called bioluminescence, is considered to be a major factor in ecological interactions. Because it occurs across diverse taxa, measurements of bioluminescence can be powerful to detect and quantify organisms in the ocean. In this study, 17 years of video observations were recorded by remotely operated vehicles during surveys off the California Coast, from the surface down to 3,900 m depth. More than 350,000 observations are classified for their bioluminescence capability based on literature descriptions. The organisms represented 553 phylogenetic concepts (species, genera or families, at the most precise taxonomic level defined from the images), distributed within 13 broader taxonomic categories. The importance of bioluminescent marine taxa is highlighted in the water column, as we showed that 76% of the observed individuals have bioluminescence capability. More than 97% of Cnidarians were bioluminescent, and 9 of the 13 taxonomic categories were found to be bioluminescent dominant. The percentage of bioluminescent animals is remarkably uniform over depth. Moreover, the proportion of bioluminescent and non-bioluminescent animals within taxonomic groups changes with depth for Ctenophora, Scyphozoa, Chaetognatha, and Crustacea. Given these results, bioluminescence has to be considered an important ecological trait from the surface to the deep-sea.


Conflict of interest statement

The authors declare no competing financial interests.

Figures

Figure 1
Figure 1. Percentage of observations for each taxon.
In this Figure, the monophyletic taxa are Cnidaria (Hydromedusae, Siphonophora, and Scyphozoa) with 32.7% of the data, Mollusca (Pteropoda and Cephalopoda) with 1.5% of the data and, Urochordata (Thaliacea and Appendicularia) with 23.9% of the data. Scyphozoa silhouette from http://phylopic.org, by Mali’o Kodis, photograph by Ching (http://www.flickr.com/photos/36302473@N03/) (license https://creativecommons.org/licenses/by/3.0/). All other are in the public domain, accessible at http://phylopic.org.
Figure 2
Figure 2. Distribution of bioluminescence capability over depth.
(a) Number of observations (counts per hour) through the water column for probably non-bioluminescent (non-bioluminescent and unlikely) and probably bioluminescent (bioluminescent and likely) organisms. (b) Proportion of bioluminescence capability distributed over depth. In the lower box, the overall percentage of bioluminescent organisms is represented as 76%. The variability of this percentage of bioluminescent capability, depending on the how undefined animals might be assigned, is added on the yellow bar (from 69 to 78%, see text for more details).
Figure 3
Figure 3. Bioluminescence capability over the main observed taxa.
The percentages only represent the probably bioluminescent organisms relative to the sum of probably bioluminescent and probably non-bioluminescent ones. The undefined organisms were not taken into account in these percentages. The color of the typography represents the dominance of the capability. Grey bounding boxes show larger taxonomic groups: Cnidaria (Hydromedusae, Siphonophora and Scyphozoa), Mollusca (Pteropoda and Cephalopoda) and Urochordata (Thaliacea and Appendicularia). Scyphozoa silhouette from http://phylopic.org, by Mali’o Kodis, photograph by Ching (http://www.flickr.com/photos/36302473@N03/) (license https://creativecommons.org/licenses/by/3.0/). All other are in the public domain, accessible at http://phylopic.org.
Figure 4
Figure 4. Probably non-bioluminescent and probably bioluminescent taxonomic categories over depth.
On the left, taxonomic make-up of the probably non-bioluminescent (including unlikely) observations. On the right, taxonomic components of the probably bioluminescent observations (including likely). The total number of observations differs between the two panels and across depths (see Fig. 2a), but the proportion between 0 and 1 of each group is represented over depth (0 to 3,900 m) using bins of 100 m. Silhouettes are in the public domain, accessible at http://phylopic.org.
Figure 5
Figure 5. Proportion of the bioluminescence capability over taxonomic categories and depth.
The proportion between 0 and 1 of each group is represented using bins of 100 m from 0 to 3,900 m.
Figure 6
Figure 6. Number of counts per hour over taxonomic categories and depth.
The number of counts of animals is normalized per hour for each group and is represented over depth (0 to 3,900 m) using bins of 100 m.
Figure 7
Figure 7. Sampling stations.
Map of the eastern Pacific Ocean and California coast showing the sampling stations (orange dots) from March 1999 to June 2016 in the greater Monterey Bay region. The map is based on NOAA bathymetry (https://maps.ngdc.noaa.gov/viewers/bathymetry/), and sampling stations have been represented using R software.

References

    1. Widder E. A. Bioluminescence and the pelagic visual environment. Marine and Freshwater Behaviour and Physiology 35, 1–26 (2002).
    1. Haddock S. H. D., Moline M. A. & Case J. F. Bioluminescence in the sea. Annual Review of Marine Science 2 (2010). - PubMed
    1. Martini S., Nerini D. & Tamburini C. Relation between deep bioluminescence and oceanographic variables: A statistical analysis using time–frequency decompositions. Progress in Oceanography 127, 117–128 (2014).
    1. Tamburini C. et al. Deep-sea bioluminescence blooms after dense water formation at the ocean surface. PLoS One 8, e67523 (2013). - PMC - PubMed
    1. Piontkovski S. A., Tokarev Y. N., Bitukov E. P., Williams R. & Kiefer D. Ý. The bioluminescent field of the Atlantic Ocean. Marine Ecology Progress Series 156, 33–41 (1997).

Publication types

LinkOut - more resources