. 2017 Apr 4:7:45465.
doi: 10.1038/srep45465.

Mechanistic Investigations of the Mitochondrial Complex I Inhibitor Rotenone in the Context of Pharmacological and Safety Evaluation

Affiliations

Mechanistic Investigations of the Mitochondrial Complex I Inhibitor Rotenone in the Context of Pharmacological and Safety Evaluation

Sabrina Heinz et al. Sci Rep. .

Abstract

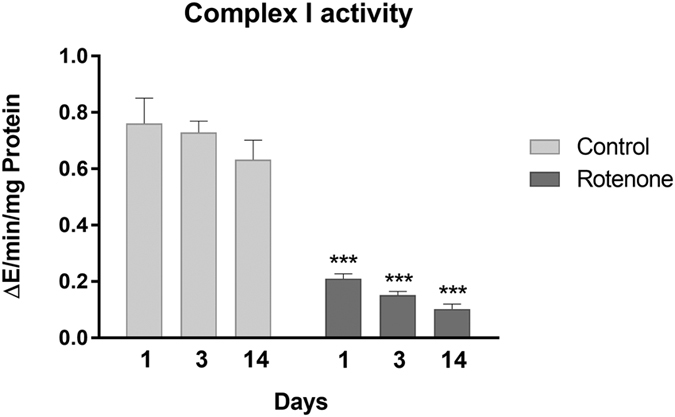
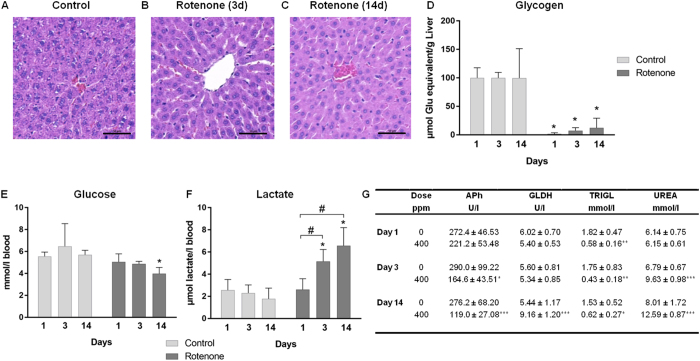
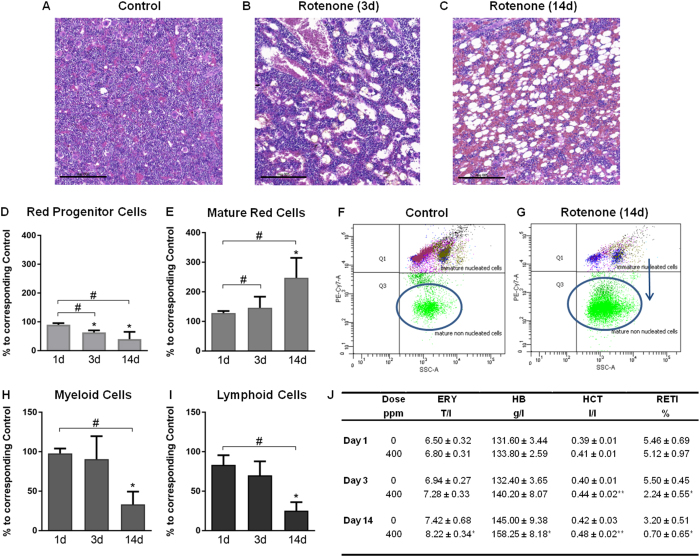
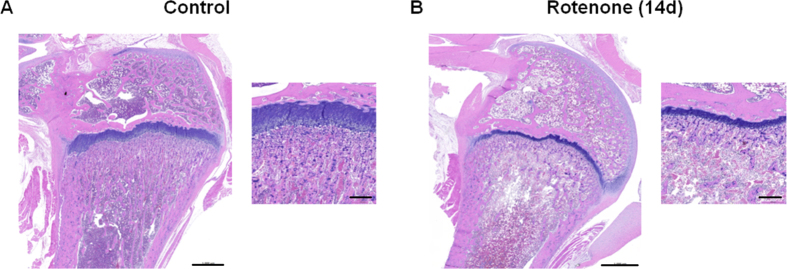
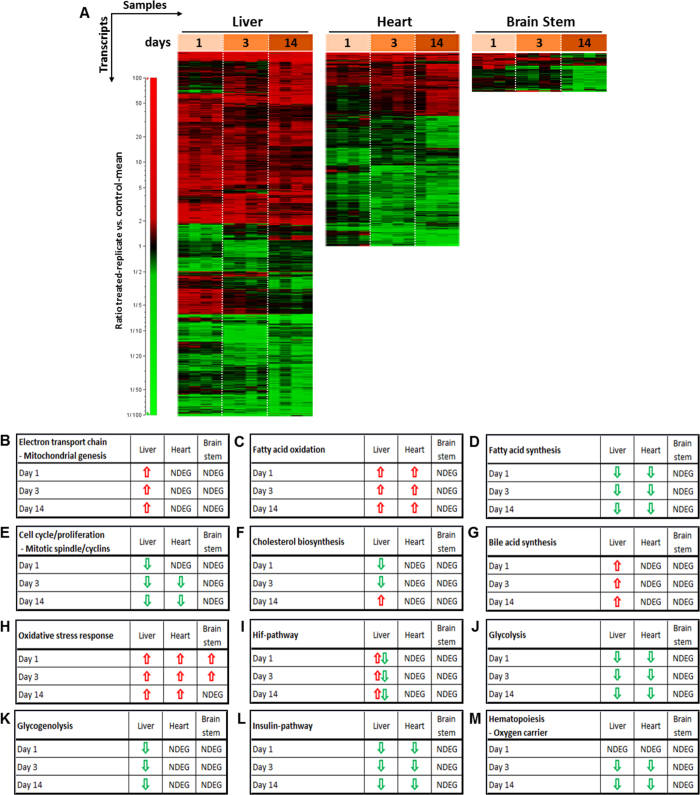
Inhibitors of the mitochondrial respiratory chain complex I are suggested to exert anti-tumor activity on those tumors relying on oxidative metabolism and are therefore of interest to oncology research. Nevertheless, the safety profile of these inhibitors should be thoroughly assessed. Rotenone, a proven complex I inhibitor, has shown anti-carcinogenic activity in several studies. In this context rotenone was used in this study as a tool compound with the aim to identify suitable biomarker candidates and provide enhanced mechanistic insights into the molecular and cellular effects of complex I inhibitors. Rats were treated with 400 ppm rotenone daily for 1, 3 or 14 consecutive days followed by necropsy. Classical clinical endpoints, including hematology, clinical chemistry and histopathology with supporting investigations (FACS-analysis, enzymatic activity assays) were examined as well as gene expression analysis. Through these investigations, we identified liver, bone marrow and bone as target organs amongst approx. 40 organs evaluated at least histopathologically. Our results suggest blood analysis, bone marrow parameters, assessment of lactate in serum and glycogen in liver, and especially gene expression analysis in liver as useful parameters for an experimental model to help to characterize the profile of complex I inhibitors with respect to a tolerable risk-benefit balance.


Conflict of interest statement

The authors declare no competing financial interests.

Figures

Figure 1
Figure 1. Complex I inhibition.
Complex I activity in isolated mitochondria from the livers of control and rotenone treated animals (400 ppm) is shown as mean with SD (n = 5) after the three treatment durations. Statistical significance (Two-Way ANOVA with Sidak multiple comparison test) is indicated by ***P < 0.001 compared to time-matched control groups.
Figure 2
Figure 2. Changes in the liver after rotenone treatment.
(AC) Histopathological changes in the liver of rats treated with 400 ppm rotenone for 3 (B) and 14 days (C) compared to control (A). Shown are representative hematoxylin and eosin stained liver sections with a scale bar of 50 μm. (D) The enzymatically determined decrease of glycogen content in livers is shown as mean with SD (n = 5) at the three different time-points. (E) Decreased blood glucose, (F) time dependent increased blood lactate concentrations and (G) other significant blood parameters (alkaline phosphatase (APh), glutamate dehydrogenase (GLDH), triglyceride (TRIGL), urea (UREA)) are also presented as mean with SD (n = 5) at the three different time-points. Statistical analysis was performed with Two-Way ANOVA with Sidak multiple comparison test. Statistical significance is indicated by *P < 0.05, **P < 0.01, and ***P < 0.001 compared with time-matched control groups or by #P < 0.05 for the factor “time” of one treatment group.
Figure 3
Figure 3. Rotenone effects on hematopoietic tissue.
(AC) Histopathological changes in the bone marrow of rats treated with 400 ppm rotenone for 3 (B) and 14 days (C) compared to control (A), indicating decreased bone marrow cellularity and an increase in adipocytes after 3 days of treatment (B), with increased severity after 14 days (C). Shown are representative hematoxylin and eosin stained bone marrow sections with a scale bar of 200 μm. (DG) FACS results of femoral bone marrow, including (D) red progenitor cells, (E) mature red blood cells, (H) myeloid cells and (I) lymphoid cells are shown as percent change (mean with SD, n = 5) at the three different time-points relative to the corresponding time-matched control. (F,G) Representative FACS plots of immature nucleated cells and mature non nucleated cells (blue circle) of a control animal (F) and a rotenone treated animal after 14 days (G). The blue arrow indicates a shift towards more mature erythroid forms. (J) Significantly affected blood cell parameters are presented as mean with SD (n = 5) at the three different time-points. Statistical analysis was performed with Two-Way ANOVA with Sidak multiple comparison test.
Figure 4
Figure 4. The effect of rotenone on bone.
(A+B) Histopathological changes in the bone of rats administered with 400 ppm rotenone for 14 days (B) compared to control (A). Shown are representative hematoxylin and eosin stained bone sections of the femur with a higher magnification of the growth plates (scale bar of 1000 μm and 200 μm, respectively).
Figure 5
Figure 5. Gene expression analysis.
(A) Heatmaps represent expression profiles of transcripts significantly affected by rotenone treatment in the liver, heart (left ventricle apex) and brain stem over time. Each column represents a dataset from one organ sample (n = 4), and each row represents a transcript. Changes in gene expression are demonstrated by the color bar to the left of the diagram. Red represents increased and green represents decreased expression levels, indicated as ratios relative to the mean of the time-matched control group. (BM) Tables show different affected pathways. Arrows represent the direction of deregulation of genes associated with the respective pathway. NDEG (not found as deregulated by our selected cutoffs) indicates that genes belonging to this pathway were not significantly deregulated in the specific organ and time point indicated.

References

    1. OJEU. Official Journal of European Union. Commission Decision of 8 December 2008 concerning the non-inclusion of certain active substances in Annex I to Council Directive 91/414/EEC and the withdrawal of authorisations for plant protection products containing these substances. L 335/91.13.12.2008. (2008c).
    1. Palmer G., Horgan D. J., Tisdale H., Singer T. P. & Beinert H. Studies on the respiratory chain-linked reduced nicotinamide adenine dinucleotide dehydrogenase. XIV. Location of the sites of inhibition of rotenone, barbiturates, and piericidin by means of electron paramagnetic resonance spectroscopy. J Biol Chem 243, 844–847 (1968). - PubMed
    1. Li N. et al. Mitochondrial complex I inhibitor rotenone induces apoptosis through enhancing mitochondrial reactive oxygen species production. J Biol Chem 278, 8516–8525, doi: 10.1074/jbc.M210432200 (2003). - DOI - PubMed
    1. Fato R. et al. Differential effects of mitochondrial Complex I inhibitors on production of reactive oxygen species. Biochim Biophys Acta 1787, 384–392, doi: 10.1016/j.bbabio.2008.11.003 (2009). - DOI - PMC - PubMed
    1. Brinkley B. R., Barham S. S., Barranco S. C. & Fuller G. M. Rotenone inhibition of spindle microtubule assembly in mammalian cells. Exp Cell Res 85, 41–46 (1974). - PubMed

MeSH terms