. 2017 May 1;127(5):1813-1825.
doi: 10.1172/JCI91816. Epub 2017 Apr 4.

Type 2 innate lymphoid cells treat and prevent acute gastrointestinal graft-versus-host disease

Type 2 innate lymphoid cells treat and prevent acute gastrointestinal graft-versus-host disease

Danny W Bruce et al. J Clin Invest. .

Abstract

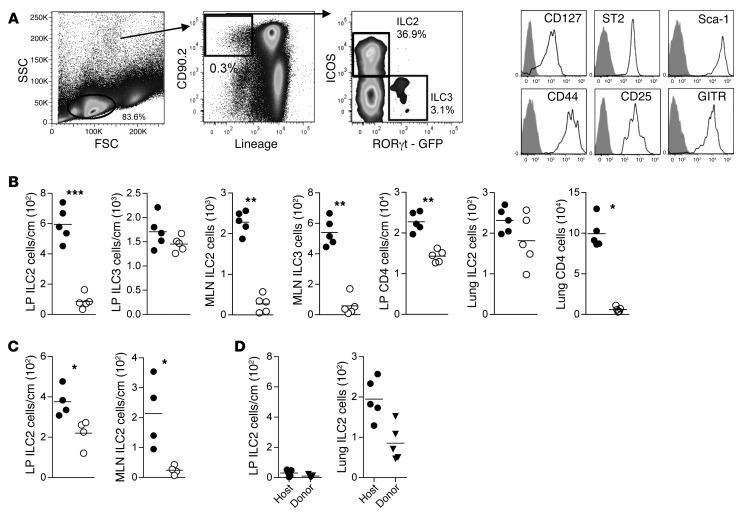
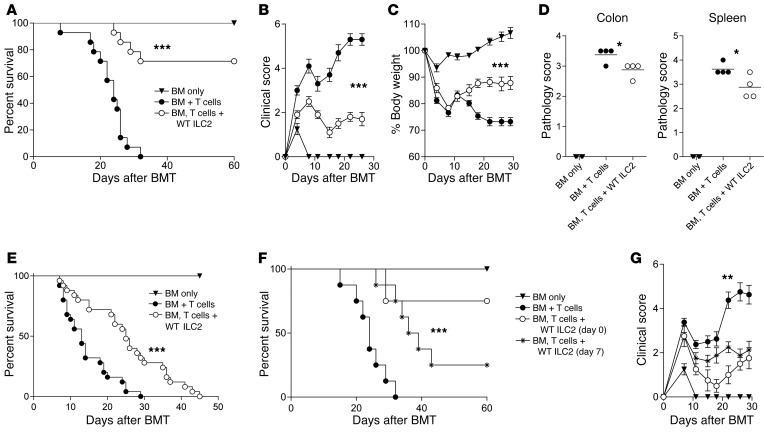
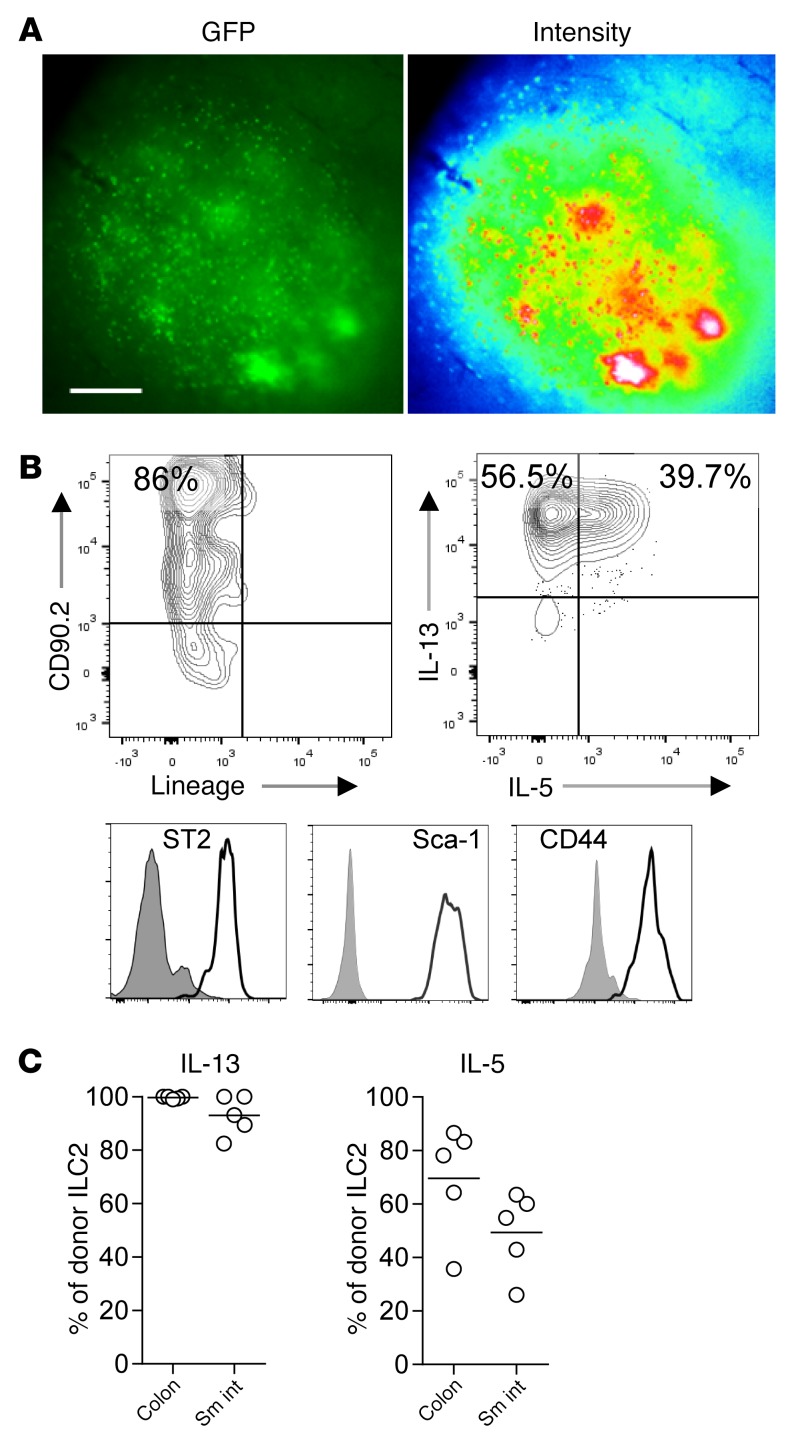
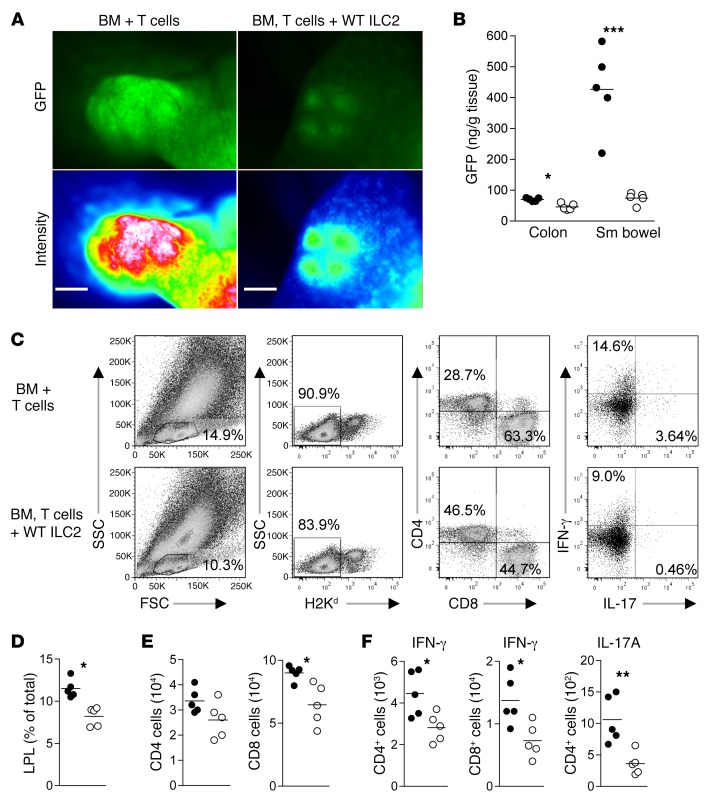
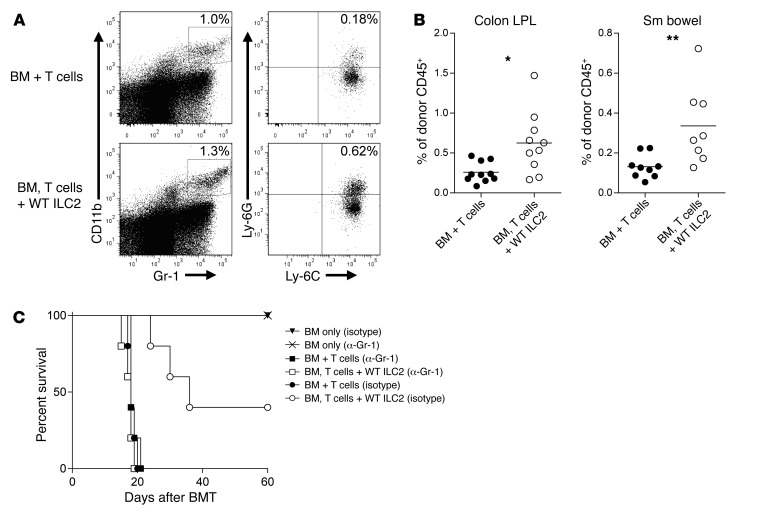
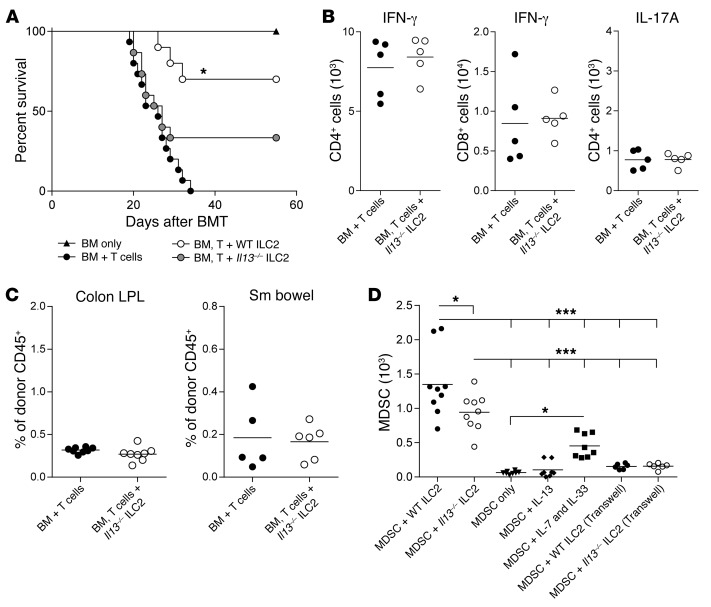
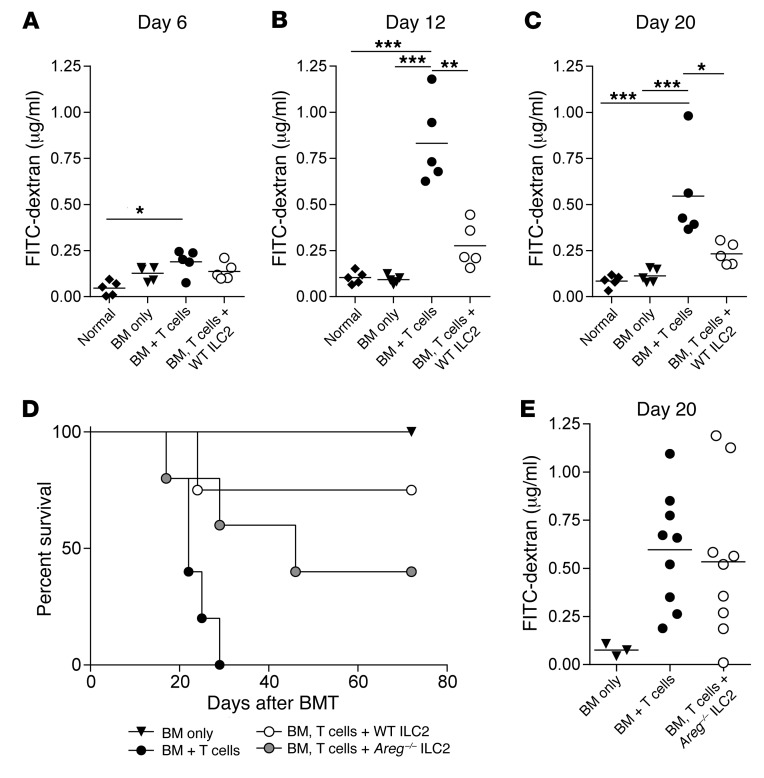
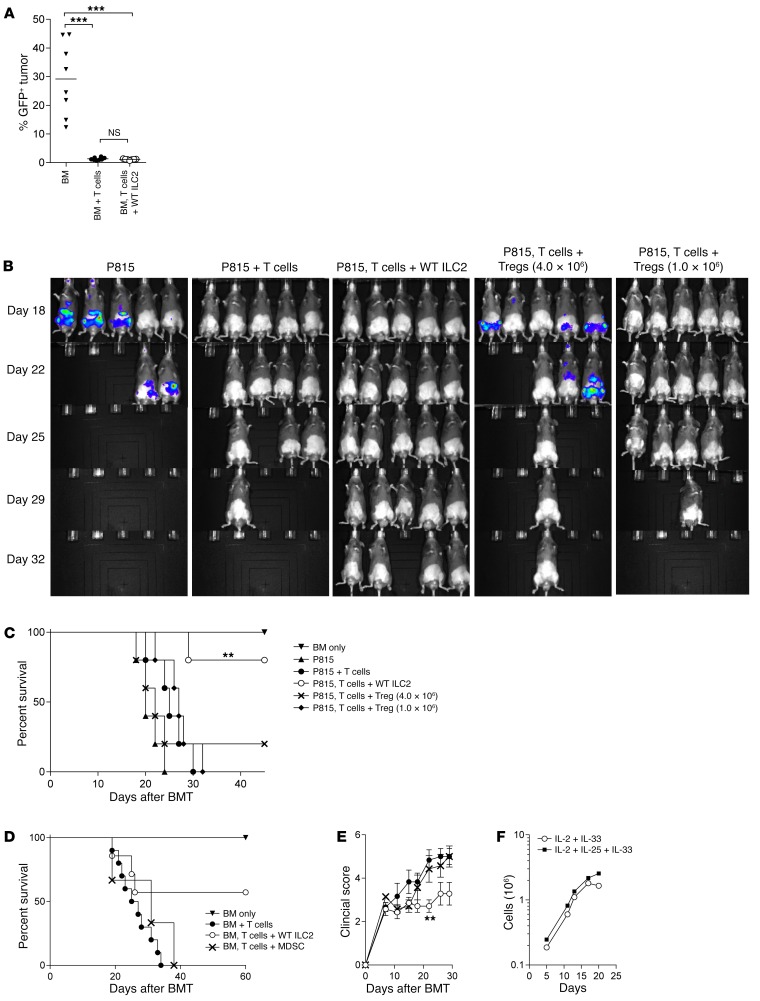
Acute graft-versus-host disease (aGVHD) is the most common complication for patients undergoing allogeneic stem cell transplantation. Despite extremely aggressive therapy targeting donor T cells, patients with grade III or greater aGVHD of the lower GI tract, who do not respond to therapy with corticosteroids, have a dismal prognosis. Thus, efforts to improve understanding of the function of local immune and non-immune cells in regulating the inflammatory process in the GI tract during aGVHD are needed. Here, we demonstrate, using murine models of allogeneic BMT, that type 2 innate lymphoid cells (ILC2s) in the lower GI tract are sensitive to conditioning therapy and show very limited ability to repopulate from donor bone marrow. Infusion of donor ILC2s was effective in reducing the lethality of aGVHD and in treating lower GI tract disease. ILC2 infusion was associated with reduced donor proinflammatory Th1 and Th17 cells, accumulation of donor myeloid-derived suppressor cells (MDSCs) mediated by ILC2 production of IL-13, improved GI tract barrier function, and a preserved graft-versus-leukemia (GVL) response. Collectively, these findings suggest that infusion of donor ILC2s to restore gastrointestinal tract homeostasis may improve treatment of severe lower GI tract aGVHD.


Conflict of interest statement

Conflict of interest: The authors have declared that no conflict of interest exists.

Figures

Figure 1
Figure 1. ILC2s are sensitive to radiation and chemotherapy conditioning.
(A) Flow cytometry gating scheme used to define ILC2 and ILC3 subsets in MLN. (B) Quantitation by flow cytometry of innate lymphoid and CD4+ T cells in the LP, MLN, or lung in mice without irradiation (filled circles) or 24 hours after receiving radiation (950 cGy) (open circles). Results represent 3 independent experiments; n = 5 for each group. (C) Quantitation of ILC2s in the LP and MLN in mice receiving no therapy (filled circles) or 24 hours after receiving 200 mg/kg of cyclophosphamide (open circles). Results represent 2 independent experiments; n = 4 for each. (D) Quantitation of host and donor-derived ILC2s in the LP and lung 28 days after BMT; mean ± SEM. Results represent 2 independent experiments; n = 5. Statistical analysis by Student’s t test with Welch’s correction, ***P < 0.001, **P < 0.01, *P < 0.05.
Figure 2
Figure 2. Co-transplantation of donor ILC2s reduces aGVHD incidence.
Lethally irradiated B6D2 mice received TCD BM (BM only), BM plus total splenic T cells (BM + T cells), or BM plus T cells with activated ILC2s (BM, T cells + WT ILC2). (A) Kaplan-Meier plot of survival following allo-SCT; 1 representative of 3 experiments shown (n = 8 each experiment). Log-rank (Mantel-Cox) test, ***P < 0.001. (B) Clinical score and (C) percentage of body weight change after transplantation. Two-way ANOVA, with Bonferroni correction for repeated measures of multiple comparisons, ***P < 0.001. (D) Pathology scores of histological evaluations of GVHD target organs, 20 days after BMT (n = 4 mice per group). Student’s t test with Welch’s correction, *P < 0.05. (E) Kaplan-Meier plot for irradiated BALB/c mice that received TCD BM (BM only), BM plus splenic T cells (BM + T cells), or BM plus T cells with ILC2s (BM, T cells + WT ILC2). Results represent 2 independent experiments; n = 14. Log-rank (Mantel-Cox) test, ***P < 0.001. (F) Kaplan-Meier plot for B6D2 recipients that received BM alone (BM only), BM and splenic T cells (BM + T cells), and WT ILC2s either at the time of transplant (BM, T cells + WT ILC2 [day 0]) or 7 days after transplant (BM, T cells + WT ILC2 [day 7]); data represent 2 experiments; n = 12 total in each group. Log-rank (Mantel-Cox) test, ***P < 0.001. (G) Clinical score of recipients from Figure 2F. Two-way ANOVA, with Bonferroni correction for repeated measures of multiple comparisons, **P < 0.01.
Figure 3
Figure 3. ILC2 evaluation in tissues after transplant.
(A) Fluorescence microscopy of B6-GFP ILC2s in PPs 12 days after BMT; GFP imaging (left) and signal intensity (right). Magnification, ×40; exposure, 200 ms. Data represent 3 experiments; n = 6 each. (B) Flow cytometry plots of B6-GFP ILC2 phenotype in the LP of BMT recipients 12 days after transplant, gated first as GFP+. (C) Percentage of B6-GFP ILC2s expressing IL-13 and IL-5; average ± SEM. Results represent 3 independent experiments; n = 5 each. Sm int, small intestine.
Figure 4
Figure 4. Co-transplantation of WT ILC2s reduces proinflammatory donor T cells numbers in the GI tract.
Donor T cells were evaluated in the GI tract 12 days after transplant using GFP+ splenic T cells alone (BM + T cells) or GFP+ T cells and WT ILC2s (BM, T cells + WT ILC2). (A) Fluorescence microscopy of B6-GFP donor T cells in PPs; GFP imaging (top row) and signal intensity (bottom row). Magnification, ×40; exposure, 200 ms. (B) ELISA quantification of GFP in tissue homogenates from BM + GFP+ T cells (filled circles) and BM, GFP+ T cells + WT ILC2 (open circles) normalized to grams of tissue. Results represent 3 experiments (n = 5 each). Student’s t test with Welch’s correction, *P < 0.05, ***P < 0.001. Donor T cells from BMT were evaluated by flow cytometry 12 days after BMT. (C) Density plots and gating scheme for the evaluation of donor T cells and intracellular cytokine expression from colon. (D) Percentage of donor T cells in the LP BM + T cells (filled circles) and BM, T cells + WT ILC2 (open circles). (E) The total number of CD4+ and CD8+ donor T cells in the LP. (F) Total number of IFN-γ–producing donor CD4+ and CD8+ T cells and the number of donor CD4+ T cells producing IL-17A in the LP. Data represent 2 independent experiments (n = 5). Student’s t test with Welch’s correction, *P < 0.05, **P < 0.01.
Figure 5
Figure 5. Co-transplantation of WT ILC2s increases MDSC numbers in the GI tract.
(A) Representative density plots of CD11b+Gr-1+Ly-6C+Ly-6G+ MDSCs (gated on donor CD45+cells) 12 days after BMT. (B) Frequencies of MDSCs as a percentage of CD45+ granulocytes in the colon and small (Sm) bowel of BMT recipients 12 days after transplant. Results represent 2 independent experiments; bar graphs are average ± SEM. Student’s t test with Welch’s correction, *P < 0.05, **P < 0.01. (C) Kaplan-Meier plot showing results of Gr-1 depletion. Lethally irradiated B6D2 mice (950 cGy) received 3.0 × 10⁶ TCD BM (BM only), BM plus 4.0 × 10⁶ total splenic T cells (BM + T cells), or BM plus T cells with 4.0 × 10⁶ IL-33–activated ILC2s (BM, T cells + WT ILC2). One group additionally received 200 μg anti–Gr-1 (α-Gr-1), with another group receiving isotype control antibody twice weekly beginning 7 days after transplant. Results of 1 representative of 2 independent experiments are shown; n = 6 per group.
Figure 6
Figure 6. Reduced efficacy of ILC2s in the absence of IL-13.
B6D2 recipients of B6 TCD BM (BM only), BM plus splenic T cells (BM + T cells), or BM plus T cells with cultured Il13–/– ILC2s (BM, T cell + Il13–/– ILC2) were evaluated by (A) Kaplan-Meier plot for survival following allo-SCT. Results of 1 representative of 2 combined experiments are shown (n = 8 per group in each experiment). WT ILC2 group shown represents one experiments from Figure 2A. Immune infiltrates were evaluated in GVHD target organs by flow cytometry 12 days after allo-SCT with or without Il13–/– ILC2s. (B) Total number of IFN-γ–producing donor CD4+ and CD8+ T cells and the number of donor CD4+ T cells producing IL-17A in the colon LP. Data represent 2 independent experiments; mean ± SEM (n = 5 each). (C) Frequencies of CD11b+GR-1+Ly-6C+Ly-6G+ MDSCs (gated on donor CD45+cells) in the colon and small bowel of BMT recipients of Il13–/– ILC2s 12 days after transplant. Results represent 2 independent experiments; mean ± SEM. (D) BM-MDSCs were cocultured for 72 hours with WT or Il13–/– ILC2s (1:1), or MDSCs alone or with either IL-13 (80 ng/ml) or IL-7 and IL-33 (10 ng/ml each). BM-MDSC were cocultured with WT or Il13–/– ILC2s (1:1) in Transwell assays, alone or in the presence of IL-13 only. Results represent 2 independent experiments; mean ± SEM. One-way ANOVA with Bonferroni’s correction for multiple comparisons, *P < 0.05, ***P < 0.001.
Figure 7
Figure 7. ILC2 treatment improves intestinal barrier function and does not abrogate the GVL response.
Quantification of FITC-dextran in the serum of BMT recipients (A) 6 days, (B) 12 days, and (C) 20 days after transplant. One representative of 2 independent experiments shown; mean ± SEM (n = 5 per group). Statistical analysis by 1-way ANOVA with Bonferroni’s correction for multiple comparisons, *P < 0.05, **P < 0.01, ***P < 0.001. (D) Kaplan-Meier plot of B6D2 recipients of B6 TCD BM (BM only), BM plus splenic T cells (BM + T cells), or BM plus T cells with cultured Areg–/– ILC2s (BM, T cell + Areg–/– ILC2) were evaluated for survival following allo-SCT. One representative of 2 experiments shown (n = 5 per group in each experiment). WT ILC2 group shown represents one experiments from Figure 2A. (E) Quantification of FITC-dextran in the serum of BMT recipients 20 days after transplant. One combined representative of 2 independent experiments is shown; mean ± SEM (n = 5 per group).
Figure 8
Figure 8. Comparison of ILC2s and other cellular therapies for GVHD.
(A) Percentage of GFP+ BC-CML tumor in host spleen 21 days after BMT in the B6-into-B6D2 model. Results represent 2 independent experiments (n = 8 each). Analysis by Student’s t test with Welch’s correction, ***P < 0.001. (B) IVIS imaging of luc-P815 tumor in B6D2 BMT recipients 15 days after transplant comparing recipients of BM and luc-P815 cells (BM only); BM with splenic T cells and luc-P815 cells (BM + T cells); BM, splenic T cells, Tregs, and luc-P815 cells (BM, T cells + Treg); and BM, splenic T cells, WT ILC2s, and luc-P815 cells (BM, T cells + WT ILC2). Results represent 2 independent experiments; n = 5 in each group. (C) Kaplan-Meier plot comparing the survival of the allo-SCT recipients described in B. Log-rank (Mantel-Cox) test, **P < 0.01. (D) Kaplan-Meier plot comparing the survival of recipients of allo-SCT (B6 into B6D2 model) that received BM alone (BM only); BM and splenic T cells (BM + T cells); and those that received BM and splenic T cells at the time of transplant with either WT ILC2s (BM, T cells + WT ILC2) or BM-MDSCs (BM, T cells + MDSC) 7 days after BMT. Results represent 2 combined experiments (n = 10 or more per group). Log-rank (Mantel-Cox) test. (E) Clinical scores of recipients from the survival study in D. **P < 0.01 by 2-way ANOVA, with Bonferroni correction for repeated measures of multiple comparisons. (F) Expansion of human ILC2s (hILC2) from SR-1–stimulated CD34+ cord blood cells in the indicated cytokines. hILC2s were enumerated as CRTH2+CD161Lin cells (Supplemental Figure 6F) from days 3 to 21; n = 3.

Similar articles

Cited by

References

    1. Kersey JH. The role of allogeneic-cell transplantation in leukemia. N Engl J Med. 2010;363(22):2158–2159. doi: 10.1056/NEJMe1010818. - DOI - PubMed
    1. Horwitz ME. Reduced intensity versus myeloablative allogeneic stem cell transplantation for the treatment of acute myeloid leukemia, myelodysplastic syndrome and acute lymphoid leukemia. Curr Opin Oncol. 2011;23(2):197–202. doi: 10.1097/CCO.0b013e328342b82a. - DOI - PubMed
    1. Faber EA, Vose JM. The role of hematopoietic stem cell transplant in follicular lymphoma. J Natl Compr Canc Netw. 2010;8(3):337–344. - PubMed
    1. Dignan FL, et al. Diagnosis and management of acute graft-versus-host disease. Br J Haematol. 2012;158(1):30–45. doi: 10.1111/j.1365-2141.2012.09129.x. - DOI - PubMed
    1. Schroeder MA, DiPersio JF. Mouse models of graft-versus-host disease: advances and limitations. Dis Model Mech. 2011;4(3):318–333. doi: 10.1242/dmm.006668. - DOI - PMC - PubMed