. 2017 May 1;127(5):1757-1771.
doi: 10.1172/JCI87388. Epub 2017 Apr 4.

ω-3 polyunsaturated fatty acids ameliorate type 1 diabetes and autoimmunity

ω-3 polyunsaturated fatty acids ameliorate type 1 diabetes and autoimmunity

Xinyun Bi et al. J Clin Invest. .

Abstract

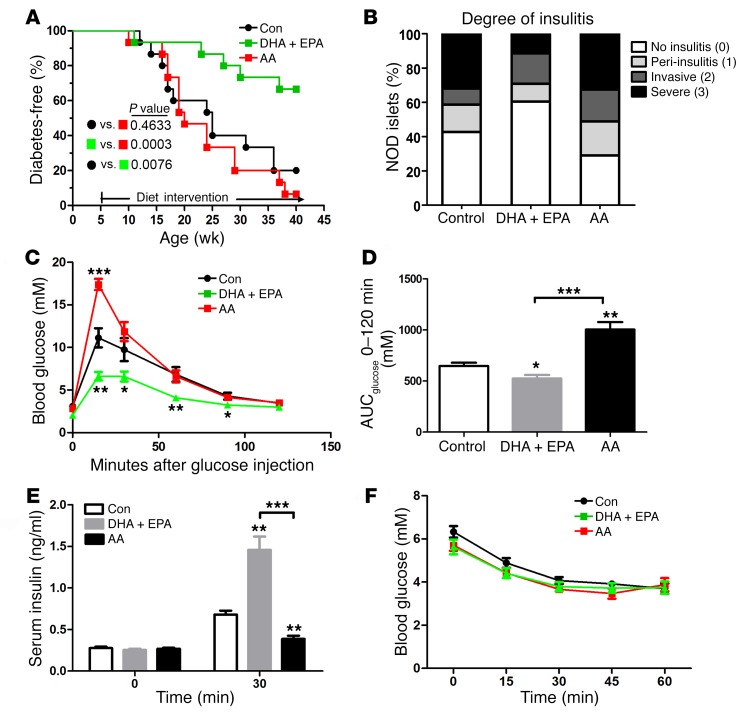
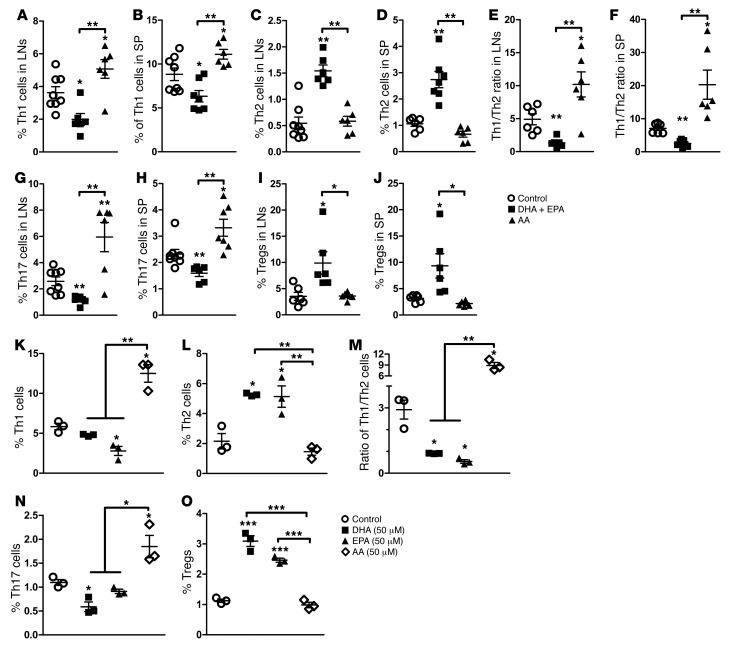
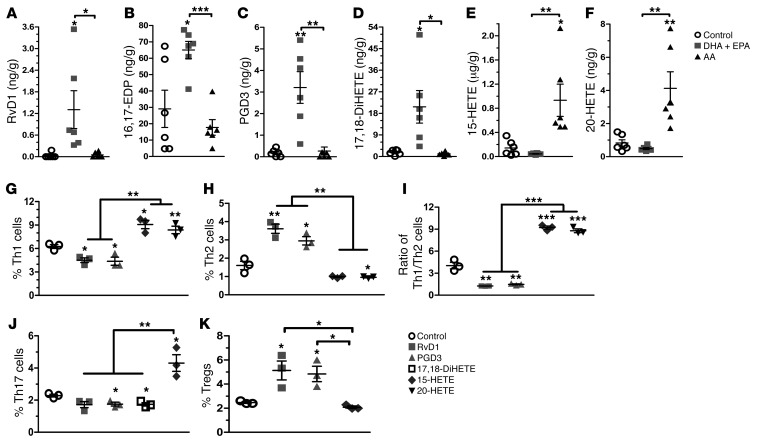
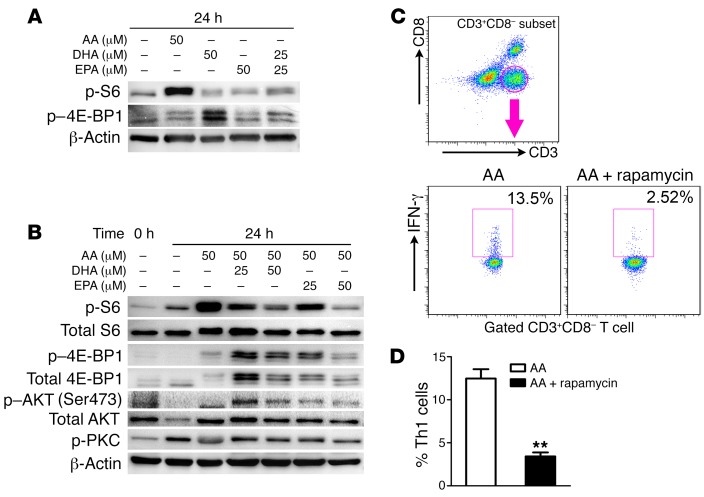
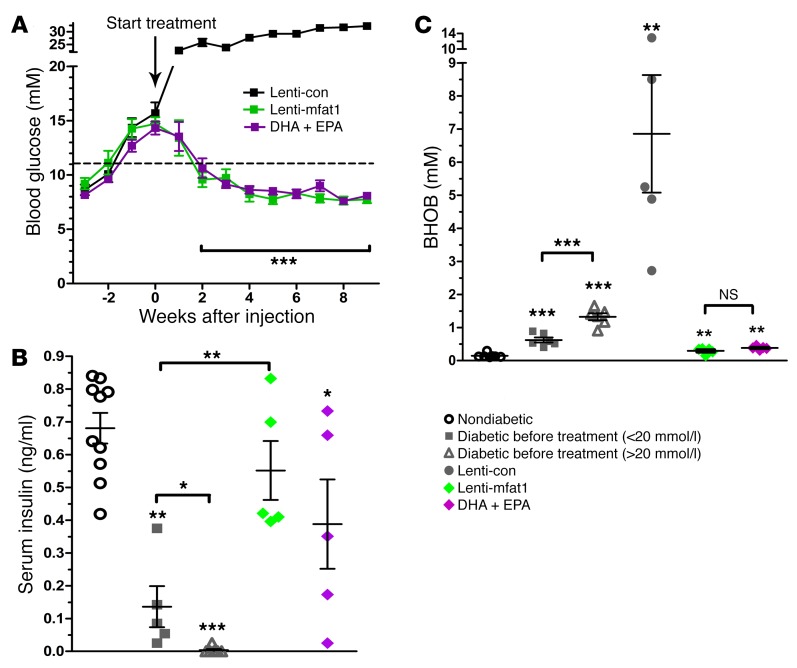
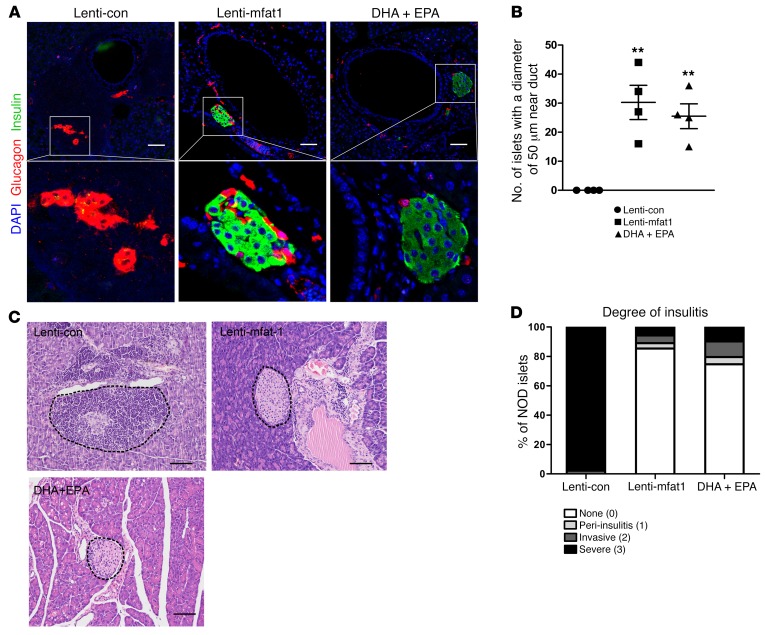
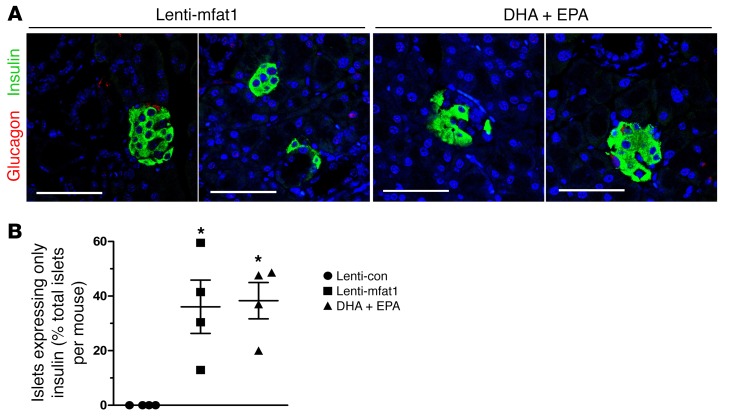
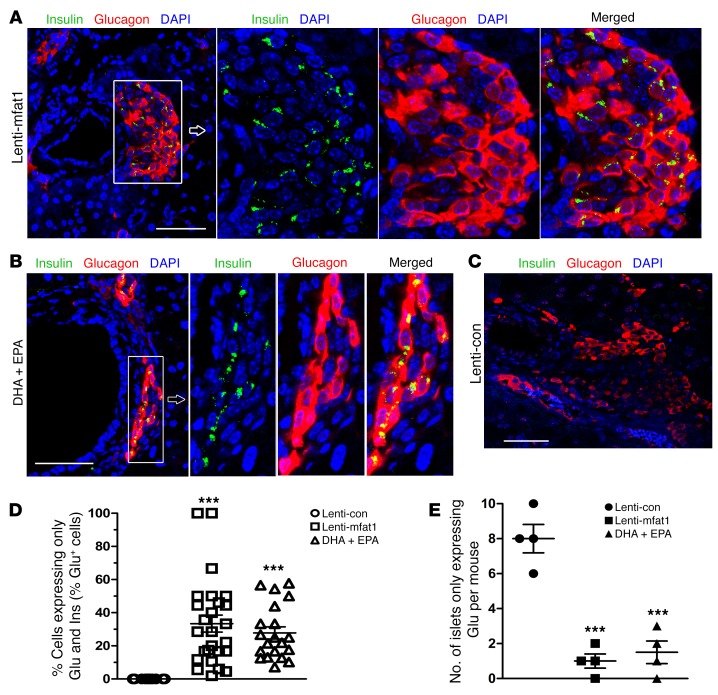
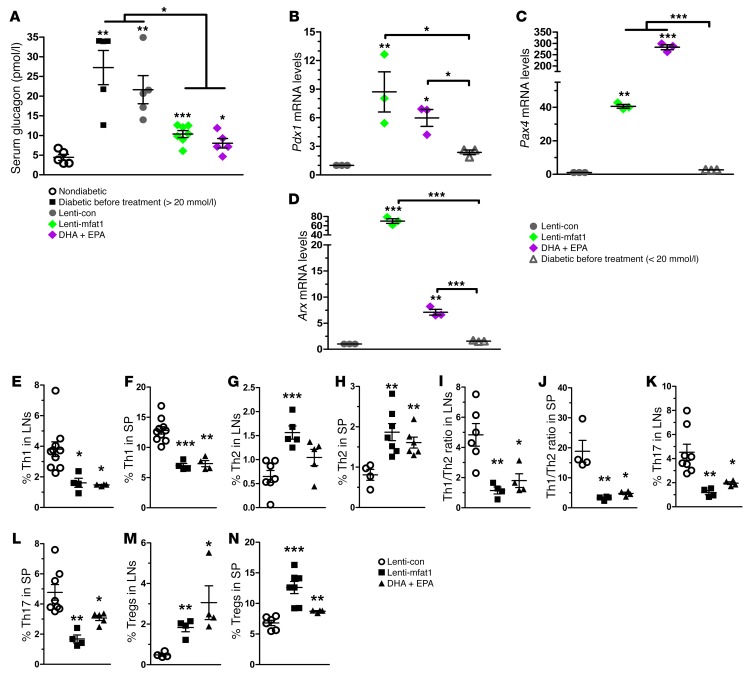
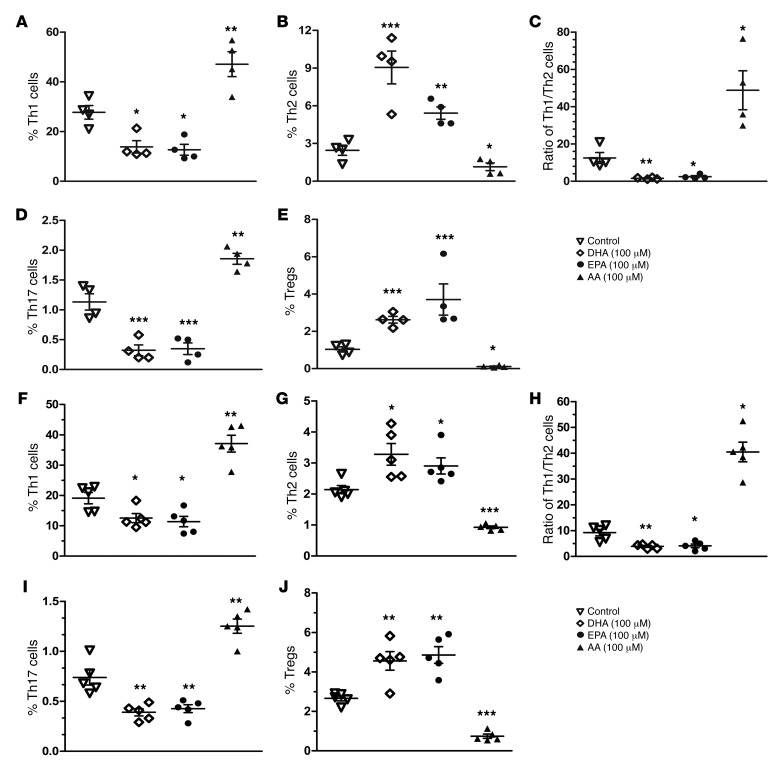
Despite the benefit of insulin, blockade of autoimmune attack and regeneration of pancreatic islets are ultimate goals for the complete cure of type 1 diabetes (T1D). Long-term consumption of ω-3 polyunsaturated fatty acids (PUFAs) is known to suppress inflammatory processes, making these fatty acids candidates for the prevention and amelioration of autoimmune diseases. Here, we explored the preventative and therapeutic effects of ω-3 PUFAs on T1D. In NOD mice, dietary intervention with ω-3 PUFAs sharply reduced the incidence of T1D, modulated the differentiation of Th cells and Tregs, and decreased the levels of IFN-γ, IL-17, IL-6, and TNF-α. ω-3 PUFAs exerted similar effects on the differentiation of CD4+ T cells isolated from human peripheral blood mononuclear cells. The regulation of CD4+ T cell differentiation was mediated at least in part through ω-3 PUFA eicosanoid derivatives and by mTOR complex 1 (mTORC1) inhibition. Importantly, therapeutic intervention in NOD mice through nutritional supplementation or lentivirus-mediated expression of an ω-3 fatty acid desaturase, mfat-1, normalized blood glucose and insulin levels for at least 182 days, blocked the development of autoimmunity, prevented lymphocyte infiltration into regenerated islets, and sharply elevated the expression of the β cell markers pancreatic and duodenal homeobox 1 (Pdx1) and paired box 4 (Pax4). The findings suggest that ω-3 PUFAs could potentially serve as a therapeutic modality for T1D.


Conflict of interest statement

Conflict of interest: The authors have declared that no conflict of interest exists.

Figures

Figure 1
Figure 1. ω-3 PUFAs ameliorate the development of T1D and normalize glucose metabolism in NOD mice.
(A) Blood glucose concentrations in 3 groups of NOD mice on varied diets were monitored weekly until 40 weeks of age. Sustained hyperglycemia for 2 consecutive weeks (>11.11 mmol/l) marked the onset of disease, which was used to create a life table to determine the incidence of diabetes (n = 15/group). Statistical calculation was done using a Mantel-Cox log-rank test. (B) Sections (4-μm-thick) of pancreas from 20-week-old NOD mice were formaldehyde fixed, paraffin embedded, and stained with H&E (n =7/group). Islets were sorted into the following 4 categories on the basis of the relative degree of immune infiltration: no insulitis (0), peri-insulitis (1), invasive insulitis (2), or severe insulitis (3). Representative pancreatic sections are shown in Supplemental Figure 1. The differences in severe insulitis between DHA plus EPA group and the control group (P < 0.0001) and between the DHA plus EPA group and the AA group (P = 0.0008) were significant. The finding of no insulitis in the DHA plus EPA group was increased compared with the control (P = 0.02) and AA (P < 0.0001) groups. Statistical calculation was done using Pearson’s χ2 test. (C) Glucose tolerance tests (GTTs) in NOD mice fed a control, AA, or DHA plus EPA diet (n = 15/group) at 20 weeks of age. (D) AUC for GTTs performed in 3 groups of NOD mice fed different diets. (E) Serum insulin concentrations during the GTT at the indicated time points (n = 10/group). (F) Insulin tolerance tests (n = 10/group). (CE) *P < 0.05, **P < 0.01, and ***P < 0.0001 versus the control group (Student’s t test). Data are representative of 2 independent experiments. All values represent the mean ± SEM.
Figure 2
Figure 2. Modulation of Th cells by ω-3 and ω-6 PUFAs in vivo and in vitro.
(AJ) Percentage of IFN-γ+, IL-4+, IL-7+, and CD25+FoxP3+ Th cells in spleens and LNs of nondiabetic NOD mice fed a control, DHA plus EPA, or AA diet. NOD mice were sacrificed at 20 weeks of age, following dietary intervention, and their spleens and LNs were harvested. Each point represents an individual mouse, and the data are representative of 3 independent experiments (n =6–8/group). Representative flow cytometric images are shown in Supplemental Figure 3. (KO) Quantification of the percentage of intracellular staining of IFN-γ+, IL-4+, IL-7+, and CD25+FoxP3+ Th cells from 10-week-old nondiabetic NOD mice. Cells were cultured for 24 hours under PMA and ionomycin stimulation in the presence of DHA, EPA, and AA (50 μM), added at the time of activation. Data are representative of 3 independent experiments (n = 3/group). Representative flow cytometric images are shown in Supplemental Figure 5. *P < 0.05, **P < 0.01, and ***P < 0.0001 versus the control group (Student’s t test). Values represent the mean ± SEM.
Figure 3
Figure 3. Diverse metabolic production of ω-3 PUFAs regulates Th cell differentiation.
(AF) Presence of different eicosanoids from ω-3 or ω-6 PUFAs in pancreas samples from NOD mice fed a control, DHA plus EPA, or AA diet (n = 6/group). (GK) Quantification of the percentage of intracellular staining of IFN-γ+, IL-4+, IL-7+, and CD25+ FoxP3+ Th cells from 10-week-old nondiabetic NOD mice. Cells were cultured for 24 hours under PMA and ionomycin stimulation in the presence of distinctive PUFA metabolites (0.1 μg/ml), added at the time of activation (n = 3/group). Representative flow cytometric images are shown in Supplemental Figure 7. *P < 0.05, **P < 0.01, and ***P < 0.0001 versus the control group (Student’s t test). Data are representative of 3 independent experiments. All values represent the mean ± SEM.
Figure 4
Figure 4. ω-3 PUFAs regulate Th cell differentiation through the inhibition of mTORC1.
(A and B) Immunoblot analysis of mTOR activation in lysates of naive CD4+ T cells from nondiabetic NOD mice. Cell lysates were stimulated for 24 hours with anti-CD3 and anti-CD28 Abs plus various doses of AA, DHA, and EPA (top lanes) in serum-containing medium. (C) Representative flow cytometric images, with the numbers in quadrants indicating the percentage of IFN-γ+ Th cells in splenocytes from 10-week-old nondiabetic NOD mice. Splenocytes were cultured under PMA and ionomycin stimulation in the presence of AA (50 μM) plus rapamycin (10 nM) or AA alone. (D) Quantification of Th1 cell percentages (n = 3/group). **P < 0.01 versus the AA group (Student’s t test). Data are representative of 3 independent experiments, and flow cytometric samples were gated on CD4+ T cells (CD3+CD8). All values represent the mean ± SEM.
Figure 5
Figure 5. ω-3 PUFAs exert a therapeutic effect on hyperglycemia in diabetic NOD mice.
(A) Nonfasting blood glucose levels in diabetic NOD mice (nonfasting blood glucose levels for 2 consecutive weeks = 11.1–20 mmol/l) after i.v. tail-vein injection of lenti-con (black, n = 7) or lenti-mfat-1 (green, n = 7), or DHA plus EPA dietary intervention (purple, n = 7). ***P < 0.0001 versus the lenti-con group (Student t test). (B and C) Concentrations of nonfasting serum insulin and BHOB, the ketone metabolite, in nondiabetic and diabetic NOD mice (nonfasting blood glucose levels <20 mmol/l for 2 consecutive weeks) before treatment; diabetic NOD mice (nonfasting blood glucose level for 2 consecutive weeks = 11.1–20 mmol/l) after lentivirus injection; or in mice that received DHA plus EPA diet intervention for 9 weeks. *P < 0.05, **P < 0.01, and ***P < 0.0001 versus the nondiabetic group (n = 5–10/group) (Student’s t test). Each point represents an individual mouse, and data are representative of 2 independent experiments. All values represent the mean ± SEM.
Figure 6
Figure 6. ω-3 PUFAs have a therapeutic effect on immune infiltration in diabetic NOD mice.
Confocal images (A) and quantification (B) of islets with a diameter of 50 μm that appeared adjacent to pancreatic ducts in diabetic NOD mice after lentivirus treatment and DHA plus EPA dietary intervention for 9 weeks (n = 4/group). Scale bars: 50 μm. Original magnification: ×400. **P < 0.01 versus the lenti-con group (Student’s t test). Values represent the mean ± SEM. (C) H&E-stained sections of islets from pancreatic tissue obtained from diabetic NOD mice after lentivirus treatment and DHA plus EPA dietary intervention for 9 weeks. Scale bars: 50 μm. Images are representative of 3 biological replicates. (D) Quantification of the incidence of insulitis in diabetic NOD mice after lentivirus injection or DHA plus EPA dietary intervention for 9 weeks (n = 4/group). Islets were sorted into 4 categories on the basis of the relative degree of immune infiltration: no insulitis (0), peri-insulitis (1), invasive insulitis (2), and severe insulitis (3). The differences in the incidence of no insulitis or severe insulitis between the lenti-con and lenti-mfat-1 groups (P < 0.0001) and between the DHA plus EPA and lenti-con groups (P < 0.0001) were significant. Statistical significance was determined by Pearson’s χ2 test.
Figure 7
Figure 7. Islet and β cell regeneration in diabetic NOD mice treated with ω-3 PUFAs.
Pancreases were harvested from 9-week-old mice that had received lentivirus treatment and DHA plus EPA dietary intervention. Confocal images (A) and quantification (B) of islets expressing only insulin, without α cells. These islets were discovered next to the ductal epithelium in NOD mice treated with lenti-mfat-1 and fed a DHA plus EPA diet (n = 4/group). β cells (insulin, green), α cells (glucagon, red), and nuclei (DAPI, blue) are shown. Scale bars: 50 μm. *P < 0.05 versus the lenti-con group (ANOVA). Images are representative of 3 biological replicates. All values represent the mean ± SEM.
Figure 8
Figure 8. Islet and β cell regeneration and colocalization of α cells and β cells in diabetic NOD mice treated with ω-3 PUFAs.
Mice were sacrificed and pancreases harvested at 9 weeks following lentivirus treatment and DHA plus EPA dietary intervention. (AC) Confocal images of colocalization (yellow areas) of α cells and β cells detected in islets and cells near the pancreatic duct in lenti-mfat-1–treated and DHA plus EPA dietary intervention groups of diabetic NOD mice. β cells (insulin, green), α cells (glucagon, red), and nuclei (DAPI, blue) are shown. Scale bars: 50 μm. Original magnification: ×400. Images are representative of 3 biological replicates. (D) Quantification of islets detected by glucagon and insulin (Ins and Glu) colocalization (n = 20–26 islets/group). (E) Quantification of islets expressing only glucagon (Glu) and no insulin (n = 4/group) and that appeared adjacent to pancreatic ducts. ***P < 0.0001 versus the lenti-con group (ANOVA). All values represent the mean ± SEM.
Figure 9
Figure 9. β Cell regeneration and modulation of Th cell subsets after lentivirus and dietary therapy with ω-3 PUFAs in diabetic NOD mice.
Mice were sacrificed at 9 weeks of age following lentivirus treatment and DHA plus EPA dietary intervention, and pancreases were harvested. (A) Concentrations of nonfasting serum glucagon levels in nondiabetic mice; diabetic NOD mice (nonfasting blood glucose level for 2 consecutive weeks <20 mmol/l) before treatment; and diabetic NOD mice (nonfasting blood glucose level for 2 consecutive weeks >11.1 mmol/l) after ω-3 PUFA therapy (n = 5–7/group). *P < 0.05, **P < 0.01, and ***P < 0.0001 versus the nondiabetic group (Student’s t test). Data are representative of 2 independent experiments. (BD) mRNA expression of Pdx1, Pax4, and Arx measured by RT-PCR in pancreases from NOD mice that received ω-3 PUFA therapy. *P < 0.05, **P < 0.01, and ***P < 0.0001 compared with the lenti-con group (n = 3 per group) (Student’s t test). Data are representative of 3 independent experiments. (EN) Quantification (n = 4–10 per group) of the percentage of intracellular staining of IFN-γ+, IL-4+, IL-7+, and CD25+FoxP3+ Th cells in LNs and spleens of diabetic NOD mice that received ω-3 PUFA therapy. Representative flow cytometric images are shown in Supplemental Figure 8. Data are representative of 3 independent experiments. *P < 0.05, **P < 0.01, and ***P < 0.0001 compared with the lenti-con group (Student’s t test). All values represent the mean ± SEM.
Figure 10
Figure 10. ω-3 and ω-6 PUFAs readjust CD4+ T cell differentiation in PBMCs from T1D patients and nondiabetic donors in vitro.
Quantification of the percentage of intracellular staining of IFN-γ+, IL-4+, IL-7+, and CD25+FoxP3+ Th cells in PBMCs from 4 T1D patients (AE) and 5 nondiabetic donors (FJ). Cells were cultured for 24 hours under PMA and ionomycin stimulation in the presence of DHA, EPA, and AA (100 μM) added at the time of activation. Representative flow cytometric images are shown in Supplemental Figures 9 and 10. *P < 0.05, **P < 0.01, and ***P < 0.0001 compared with the control group (Student’s t test). Each point represents an individual patient or donor, and the data are representative of 3 independent experiments. All values represent the mean ± SEM.

Similar articles

Cited by

References

    1. Wållberg M, Cooke A. Immune mechanisms in type 1 diabetes. Trends Immunol. 2013;34(12):583–591. doi: 10.1016/j.it.2013.08.005. - DOI - PubMed
    1. Atkinson MA, et al. How does type 1 diabetes develop?: the notion of homicide or β-cell suicide revisited. Diabetes. 2011;60(5):1370–1379. doi: 10.2337/db10-1797. - DOI - PMC - PubMed
    1. Panero F, et al. Fasting plasma C-peptide and micro- and macrovascular complications in a large clinic-based cohort of type 1 diabetic patients. Diabetes Care. 2009;32(2):301–305. doi: 10.2337/dc08-1241. - DOI - PMC - PubMed
    1. Sima AA, et al. C-peptide prevents and improves chronic Type I diabetic polyneuropathy in the BB/Wor rat. Diabetologia. 2001;44(7):889–897. doi: 10.1007/s001250100570. - DOI - PubMed
    1. Johansson BL, Sjöberg S, Wahren J. The influence of human C-peptide on renal function and glucose utilization in type 1 (insulin-dependent) diabetic patients. Diabetologia. 1992;35(2):121–128. doi: 10.1007/BF00402543. - DOI - PubMed

MeSH terms