

The temporal dynamics of chromosome instability in ovarian cancer cell lines and primary patient samples
- PMID: 28376088
- PMCID: PMC5395197
- DOI: 10.1371/journal.pgen.1006707
The temporal dynamics of chromosome instability in ovarian cancer cell lines and primary patient samples
Abstract
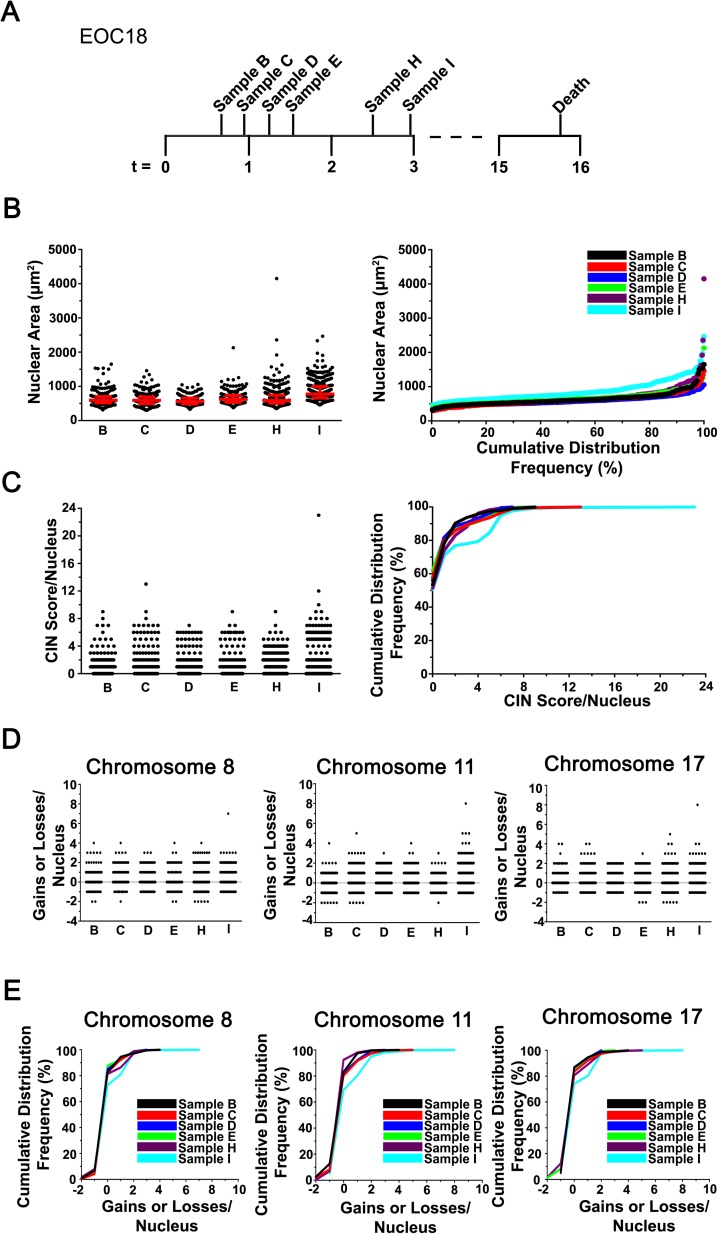
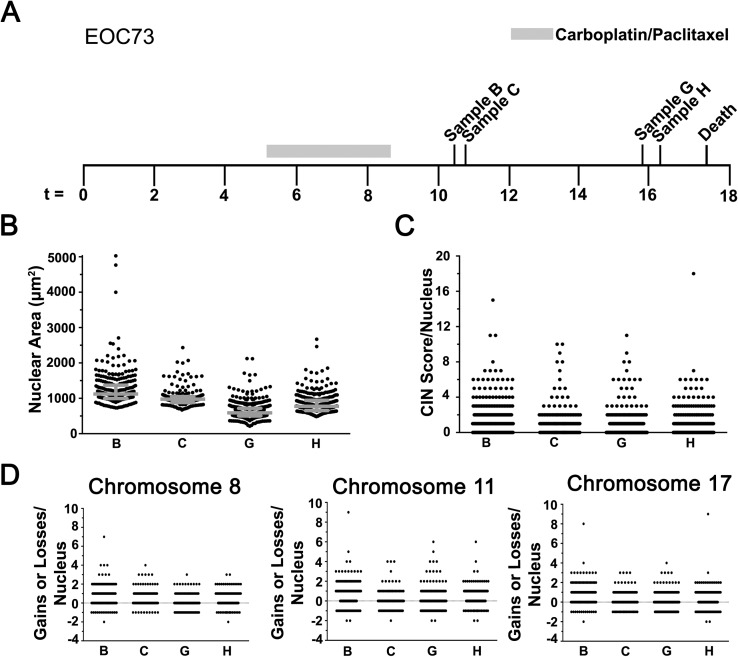
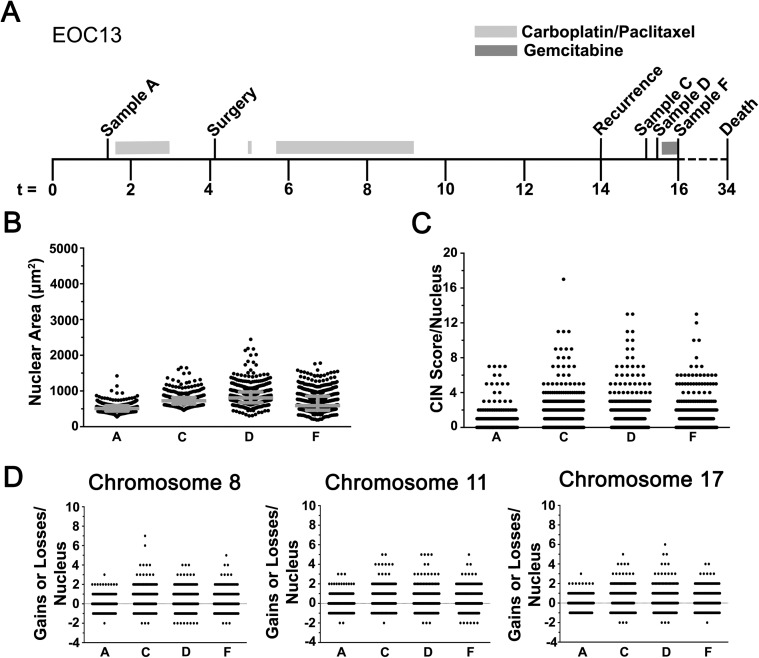
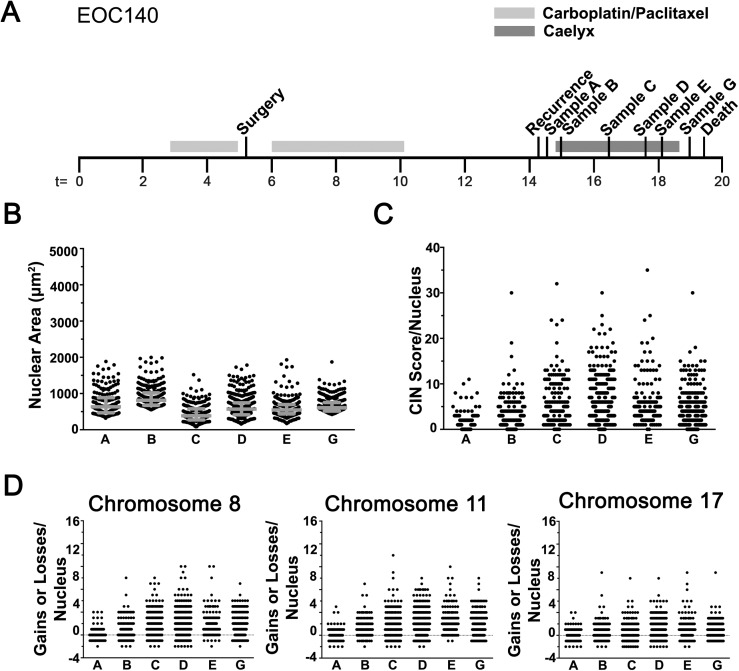
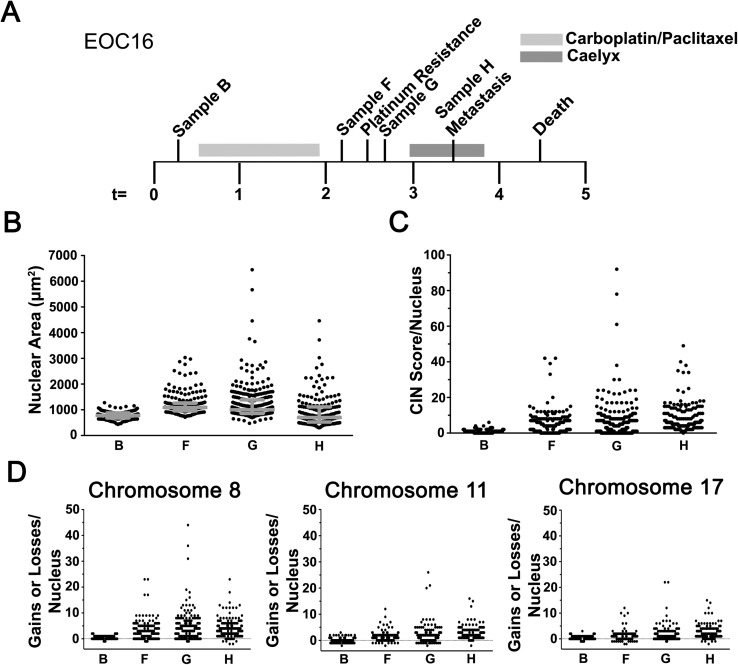
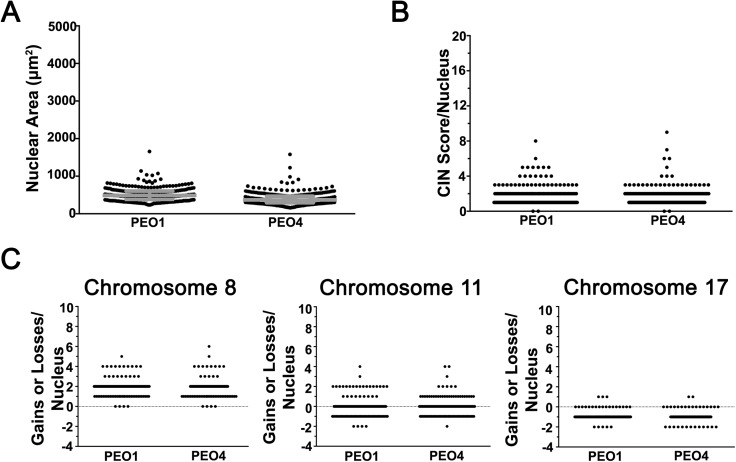
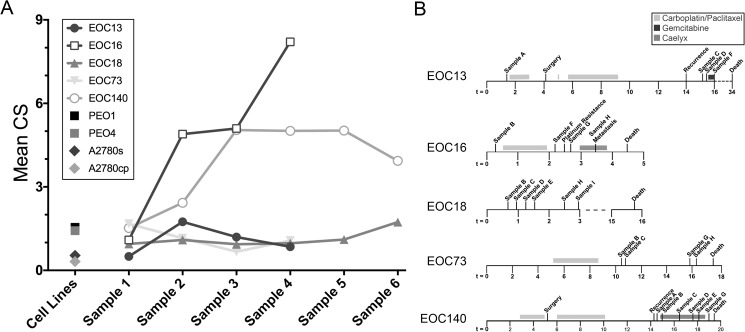
Epithelial ovarian cancer (EOC) is the most prevalent form of ovarian cancer and has the highest mortality rate. Novel insight into EOC is required to minimize the morbidity and mortality rates caused by recurrent, drug resistant disease. Although numerous studies have evaluated genome instability in EOC, none have addressed the putative role chromosome instability (CIN) has in disease progression and drug resistance. CIN is defined as an increase in the rate at which whole chromosomes or large parts thereof are gained or lost, and can only be evaluated using approaches capable of characterizing genetic or chromosomal heterogeneity within populations of cells. Although CIN is associated with numerous cancer types, its prevalence and dynamics in EOC is unknown. In this study, we assessed CIN within serial samples collected from the ascites of five EOC patients, and in two well-established ovarian cancer cell models of drug resistance (PEO1/4 and A2780s/cp). We quantified and compared CIN (as measured by nuclear areas and CIN Score (CS) values) within and between serial samples to glean insight into the association and dynamics of CIN within EOC, with a particular focus on resistant and recurrent disease. Using quantitative, single cell analyses we determined that CIN is associated with every sample evaluated and further show that many EOC samples exhibit a large degree of nuclear size and CS value heterogeneity. We also show that CIN is dynamic and generally increases within resistant disease. Finally, we show that both drug resistance models (PEO1/4 and A2780s/cp) exhibit heterogeneity, albeit to a much lesser extent. Surprisingly, the two cell line models exhibit remarkably similar levels of CIN, as the nuclear areas and CS values are largely overlapping between the corresponding paired lines. Accordingly, these data suggest CIN may represent a novel biomarker capable of monitoring changes in EOC progression associated with drug resistance.
Conflict of interest statement
The authors have declared that no competing interests exist.
Figures

Similar articles
-
Chromosome instability is prevalent and dynamic in high-grade serous ovarian cancer patient samples.Gynecol Oncol. 2021 Jun;161(3):769-778. doi: 10.1016/j.ygyno.2021.02.038. Epub 2021 Mar 10. Gynecol Oncol. 2021. PMID: 33714608
-
FOXM1 expression is significantly associated with chemotherapy resistance and adverse prognosis in non-serous epithelial ovarian cancer patients.J Exp Clin Cancer Res. 2017 May 8;36(1):63. doi: 10.1186/s13046-017-0536-y. J Exp Clin Cancer Res. 2017. PMID: 28482906 Free PMC article.
-
Blocking Mitotic Exit of Ovarian Cancer Cells by Pharmaceutical Inhibition of the Anaphase-Promoting Complex Reduces Chromosomal Instability.Neoplasia. 2019 Apr;21(4):363-375. doi: 10.1016/j.neo.2019.01.007. Epub 2019 Mar 7. Neoplasia. 2019. PMID: 30851646 Free PMC article.
-
Chromosomal instability and aneuploidy as causes of cancer drug resistance.Trends Cancer. 2022 Jan;8(1):43-53. doi: 10.1016/j.trecan.2021.09.002. Epub 2021 Sep 28. Trends Cancer. 2022. PMID: 34593353 Review.
-
Genetic and epigenetic heterogeneity of epithelial ovarian cancer and the clinical implications for molecular targeted therapy.J Cell Mol Med. 2016 Apr;20(4):581-93. doi: 10.1111/jcmm.12771. Epub 2016 Jan 22. J Cell Mol Med. 2016. PMID: 26800494 Free PMC article. Review.
Cited by
-
A living biobank of ovarian cancer ex vivo models reveals profound mitotic heterogeneity.Nat Commun. 2020 Feb 13;11(1):822. doi: 10.1038/s41467-020-14551-2. Nat Commun. 2020. PMID: 32054838 Free PMC article.
-
Exploiting a living biobank to delineate mechanisms underlying disease-specific chromosome instability.Chromosome Res. 2023 Aug 17;31(3):21. doi: 10.1007/s10577-023-09731-x. Chromosome Res. 2023. PMID: 37592171 Free PMC article. Review.
-
Time-Dependent Effects of POT1 Knockdown on Proliferation, Tumorigenicity, and HDACi Response of SK-OV3 Ovarian Cancer Cells.Biomed Res Int. 2018 Feb 6;2018:7184253. doi: 10.1155/2018/7184253. eCollection 2018. Biomed Res Int. 2018. PMID: 29546066 Free PMC article.
-
Evolving Therapeutic Strategies to Exploit Chromosome Instability in Cancer.Cancers (Basel). 2017 Nov 1;9(11):151. doi: 10.3390/cancers9110151. Cancers (Basel). 2017. PMID: 29104272 Free PMC article. Review.
-
The Role of Chromosomal Instability in Cancer and Therapeutic Responses.Cancers (Basel). 2017 Dec 28;10(1):4. doi: 10.3390/cancers10010004. Cancers (Basel). 2017. PMID: 29283387 Free PMC article. Review.
References
-
- Ferlay J SI, Ervik M, Dikshit R, Eser S, Mathers C, Rebelo M, Parkin DM, Forman D, Bray, F. GLOBOCAN 2012 v1.1, Cancer Incidence and Mortality Worldwide: IARC CancerBase No. 11 Lyon, France2014 [04/12/2015]. Available from: http://globocan.iarc.fr/. - PubMed
-
- Kobel M, Bak J, Bertelsen BI, Carpen O, Grove A, Hansen ES, et al. Ovarian carcinoma histotype determination is highly reproducible, and is improved through the use of immunohistochemistry. Histopathology. 2014;64(7):1004–13. doi: 10.1111/his.12349 - DOI - PubMed
-
- Sherman-Baust CA, Becker KG, Wood Iii WH, Zhang Y, Morin PJ. Gene expression and pathway analysis of ovarian cancer cells selected for resistance to cisplatin, paclitaxel, or doxorubicin. Journal of ovarian research. 2011;4(1):21 PubMed Central PMCID: PMC3259089. doi: 10.1186/1757-2215-4-21 - DOI - PMC - PubMed
-
- Hiss D. Optimizing molecular-targeted therapies in ovarian cancer: the renewed surge of interest in ovarian cancer biomarkers and cell signaling pathways. Journal of oncology. 2012;2012:737981 PubMed Central PMCID: PMC3306947. doi: 10.1155/2012/737981 - DOI - PMC - PubMed
-
- Coleman RL, Monk BJ, Sood AK, Herzog TJ. Latest research and treatment of advanced-stage epithelial ovarian cancer. Nature reviews Clinical oncology. 2013;10(4):211–24. PubMed Central PMCID: PMC3786558. doi: 10.1038/nrclinonc.2013.5 - DOI - PMC - PubMed
Publication types
MeSH terms
Substances
Grants and funding
LinkOut - more resources
Full Text Sources
Other Literature Sources
Medical
Miscellaneous
