. 2017 Apr 4;12(4):e0174980.
doi: 10.1371/journal.pone.0174980. eCollection 2017.

Influenza A H5N1 and H7N9 in China: A spatial risk analysis

Affiliations

Influenza A H5N1 and H7N9 in China: A spatial risk analysis

Chau Minh Bui et al. PLoS One. .

Erratum in

Abstract

Background: Zoonotic avian influenza poses a major risk to China, and other parts of the world. H5N1 has remained endemic in China and globally for nearly two decades, and in 2013, a novel zoonotic influenza A subtype H7N9 emerged in China. This study aimed to improve upon our current understanding of the spreading mechanisms of H7N9 and H5N1 by generating spatial risk profiles for each of the two virus subtypes across mainland China.

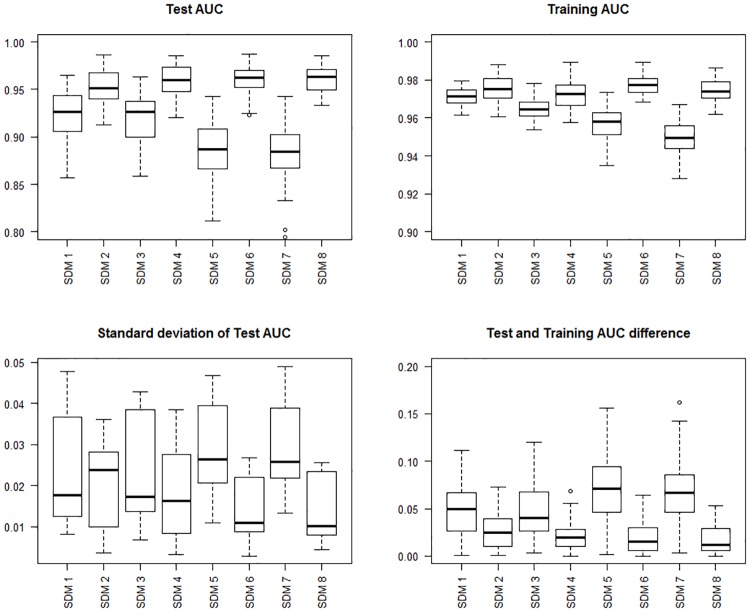
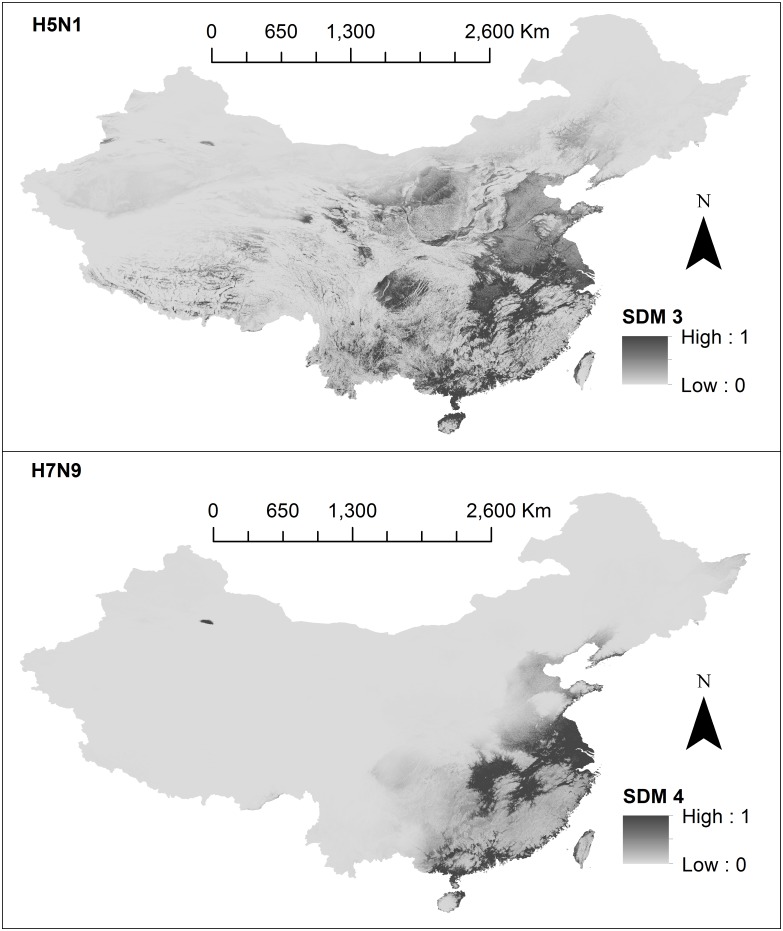
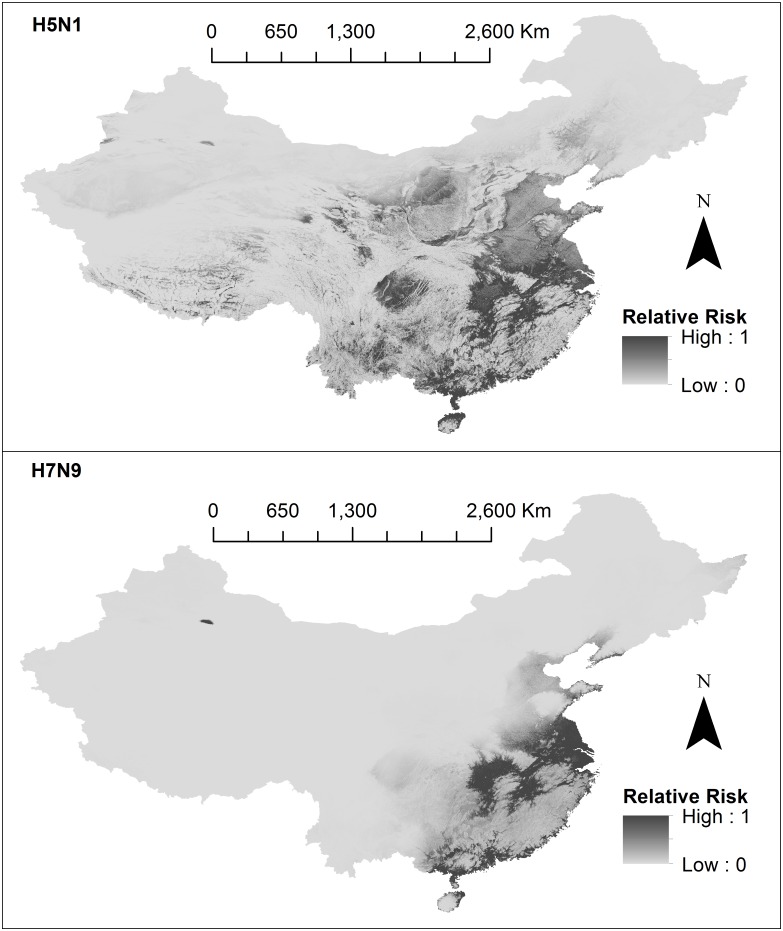
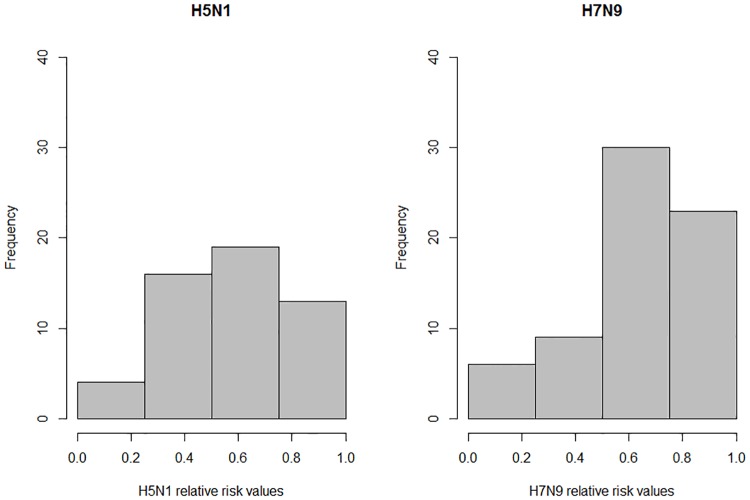
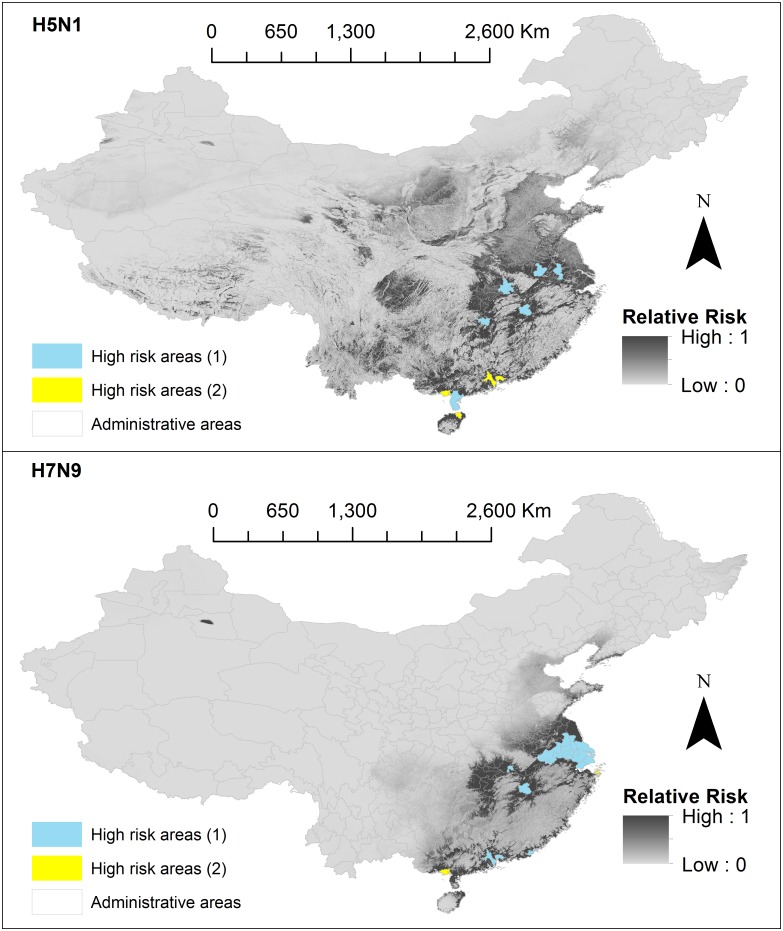
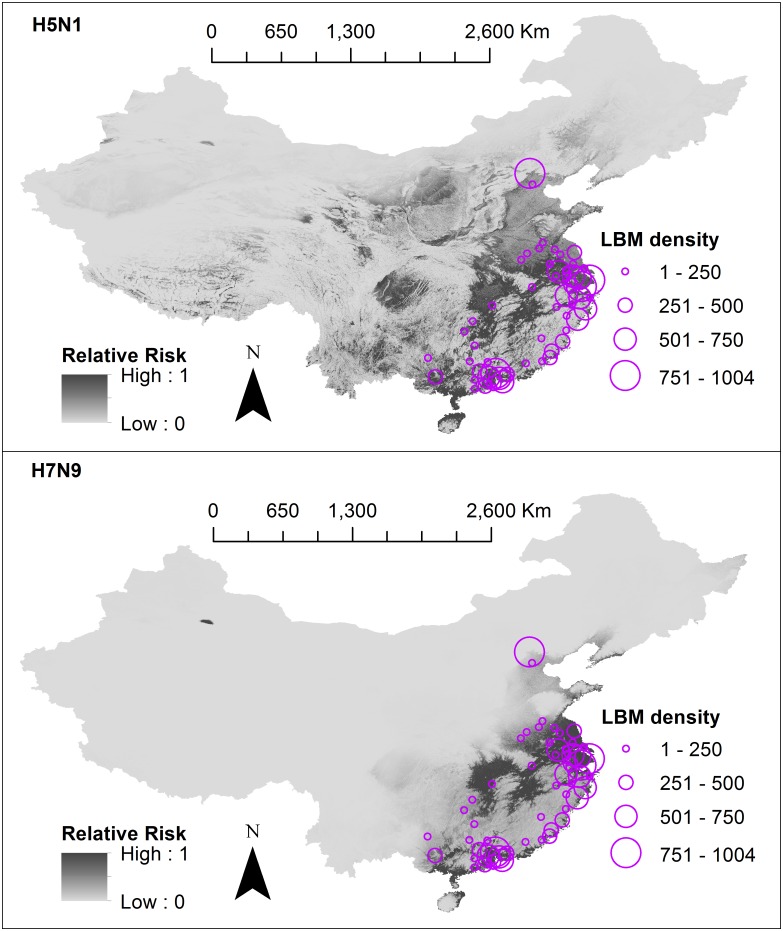
Methods and findings: In this study, we (i) developed a refined data set of H5N1 and H7N9 locations with consideration of animal/animal environment case data, as well as spatial accuracy and precision; (ii) used this data set along with environmental variables to build species distribution models (SDMs) for each virus subtype in high resolution spatial units of 1km2 cells using Maxent; (iii) developed a risk modelling framework which integrated the results from the SDMs with human and chicken population variables, which was done to quantify the risk of zoonotic transmission; and (iv) identified areas at high risk of H5N1 and H7N9 transmission. We produced high performing SDMs (6 of 8 models with AUC > 0.9) for both H5N1 and H7N9. In all our SDMs, H7N9 consistently showed higher AUC results compared to H5N1, suggesting H7N9 suitability could be better explained by environmental variables. For both subtypes, high risk areas were primarily located in south-eastern China, with H5N1 distributions found to be more diffuse and extending more inland compared to H7N9.

Conclusions: We provide projections of our risk models to public health policy makers so that specific high risk areas can be targeted for control measures. We recommend comparing H5N1 and H7N9 prevalence rates and survivability in the natural environment to better understand the role of animal and environmental transmission in human infections.


Conflict of interest statement

Competing Interests: The authors have declared that no competing interests exist.

Figures

Fig 1
Fig 1. Species Distribution Model (SDMs) evaluation results.
Top left panel shows boxplots of the area under the curve (AUC) for test data. The top right panel shows boxplots of AUC for training data. The bottom left panel shows boxplots of standard deviation of test data. The bottom right panel shows boxplots of test and training AUC differences.
Fig 2
Fig 2. Species Distribution Models (SDMs) built using Maxent.
The first panel shows H5N1 (SDM 3) and the second panel shows H7N9 (SDM 4). Suitability values for each cell (approximately 1km2) are represented on a continuous scale of low (light grey) to high (dark grey). SDMs were built using Maxent software version 3.3.3k (available from https://www.cs.princeton.edu/~schapire/maxent/). SDMs were developed using environmental variables, created using data from: the WorldClim database (www.wordlclim.org), the Shuttle Radar Topography Mission (SRTM) 90m Digital Elevation Database v4.1 (www.cgiar-csi.org). Data sources used to obtain the case locations to build SDMs include: the Food and Agricultural Organization (FAO) (http://empres-i.fao.org/eipws3g/), the Chinese Ministry of Agriculture Avian Influenza Surveillance Reports (www.syj.moa.gov.cn), the World Organization of Animal Health (OIE) reports (www.oie.int). Base maps were obtained from the GADM database of Global Administrative Areas (http://www.gadm.org/). Maps were built using ArcMap 10.2.
Fig 3
Fig 3. Risk models.
The first panel shows H5N1 and the second panel shows H7N9. Final relative risk values for each cell (approximately 1km2) are represented on a continuous scale of low (light grey) to high (dark grey). Data sources used to develop risk models include: species distribution models (SDMs) 3 and 4 which were produced in this study, domestic chicken population data obtained from Livestock Geo-Wiki (http://www.livestock.geo-wiki.org/), human population data from the LandScan (2014) High Resolution global Population Data Set (http://web.ornl.gov/sci/landscan/). Base maps were obtained from the GADM database of Global Administrative Areas (http://www.gadm.org/). Maps were built using ArcMap 10.2.
Fig 4
Fig 4. Risk model validation.
Charts show the number of exact case locations which fell into a low risk area (0.0 > Rk ≥ 0.25), low-medium risk area (0.25 > Rk ≥ 0.50), medium-high risk area (0.5 > Rk ≥ 0.75) and high risk area (0.75 > Rk ≥ 1.0). The left chart shows categorisation of H5N1 exact case locations corresponding to the H5N1 risk model. The right chart shows categorisation of H7N9 exact case locations corresponding to the H7N9 risk model.
Fig 5
Fig 5. High risk areas.
The first panel shows H5N1 and the second panel shows H7N9. Final relative risk values for each cell (approximately 1km2) are represented on a continuous scale of low (light grey) to high (dark grey). High risk areas (1) represent secondary administrative areas (prefectures, municipalities, cities) areas with a mean-aggregated relative risk value (> 0.5), and high risk areas (2) are those areas which have not yet reported a case. Data sources used to develop risk models include: species distribution models (SDMs) 3 and 4 which were produced in this study, domestic chicken population data obtained from Livestock Geo-Wiki (http://www.livestock.geo-wiki.org/), human population data from the LandScan (2014) High Resolution global Population Data Set (http://web.ornl.gov/sci/landscan/). Base maps of Chinese administrative regions were obtained from the GADM database of Global Administrative Areas (http://www.gadm.org/). Maps were built using ArcMap 10.2.
Fig 6
Fig 6. Risk models overlayed with live bird market density.
The first panel shows H5N1 and the second panel shows H7N9. Final relative risk values for each cell (approximately 1km2) are represented on a continuous scale of low (light grey) to high (dark grey). Different sized circles represent the live bird market density per secondary administrative areas (prefectures, municipalities, cities), however data were only available for 43 (of 344) of these areas. Data sources used to develop risk models include: species distribution models (SDMs) 3 and 4 which were produced in this study, domestic chicken population data obtained from Livestock Geo-Wiki (http://www.livestock.geo-wiki.org/), human population data from the LandScan (2014) High Resolution global Population Data Set (http://web.ornl.gov/sci/landscan/). Live bird market data were requested from authors of previously published SDMs [27,30]. Base maps of Chinese administrative regions were obtained from the GADM database of Global Administrative Areas (http://www.gadm.org/). Maps were built using ArcMap 10.2.

Similar articles

Cited by

References

    1. World Health Organization (WHO) (2016) Cumulative number of confirmed human cases of avian influenza A(H5N1) reported to WHO (19 July 2016).
    1. Food and Agricultural Organisation of the United Nations (FAO) (2016) H7N9 situation update—20 July 2016.
    1. Bui C, Bethmont A, Chughtai AA, Gardner L, Sarkar S, Hassan S, et al. (2016) A Systematic Review of the Comparative Epidemiology of Avian and Human Influenza A H5N1 and H7N9—Lessons and Unanswered Questions. Transbound Emerg Dis 63: 602–620. 10.1111/tbed.12327 - DOI - PubMed
    1. Bethmont A, Bui CM, Gardner L, Sarkar S, Chughtai AA, Macintyre CR (2016) Quantified degree of poultry exposure differs for human cases of avian influenza H5N1 and H7N9. Epidemiol Infect 144: 2633–2640. 10.1017/S0950268816001035 - DOI - PMC - PubMed
    1. Pantin-Jackwood MJ, Miller PJ, Spackman E, Swayne DE, Susta L, Costa-Hurtado M, et al. (2014) Role of Poultry in the Spread of Novel H7N9 Influenza Virus in China. J Virol 88: 5381–5390. 10.1128/JVI.03689-13 - DOI - PMC - PubMed

MeSH terms