. 2017 Jun 1;109(6):djw297.
doi: 10.1093/jnci/djw297.

Next-Generation CDK2/9 Inhibitors and Anaphase Catastrophe in Lung Cancer

Affiliations

Next-Generation CDK2/9 Inhibitors and Anaphase Catastrophe in Lung Cancer

Masanori Kawakami et al. J Natl Cancer Inst. .

Abstract

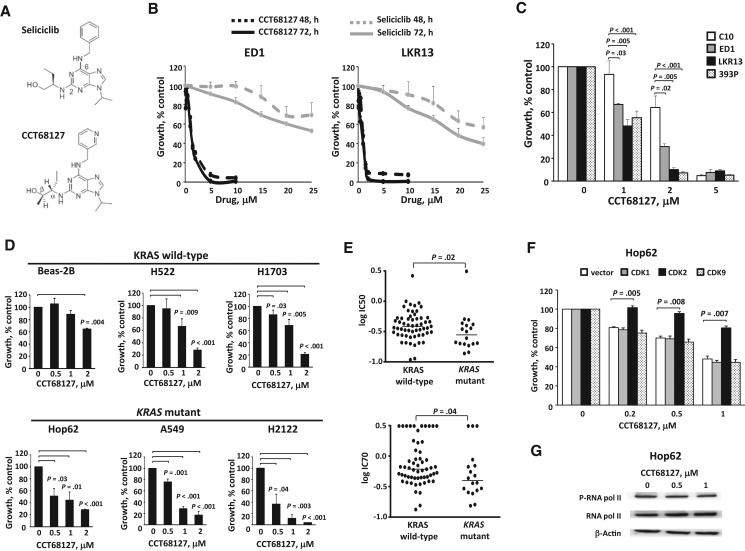
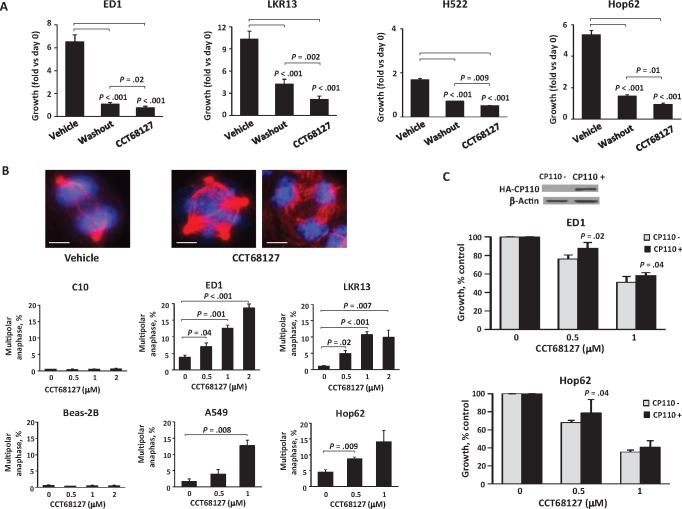
Background: The first generation CDK2/7/9 inhibitor seliciclib (CYC202) causes multipolar anaphase and apoptosis in lung cancer cells with supernumerary centrosomes (known as anaphase catastrophe). We investigated a new and potent CDK2/9 inhibitor, CCT68127 (Cyclacel).

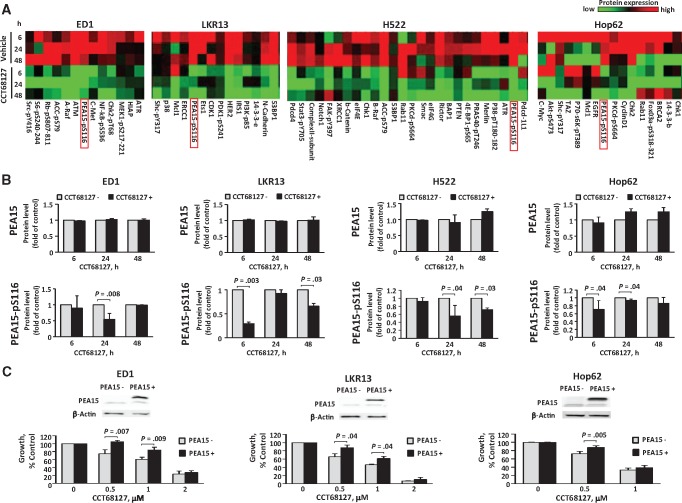
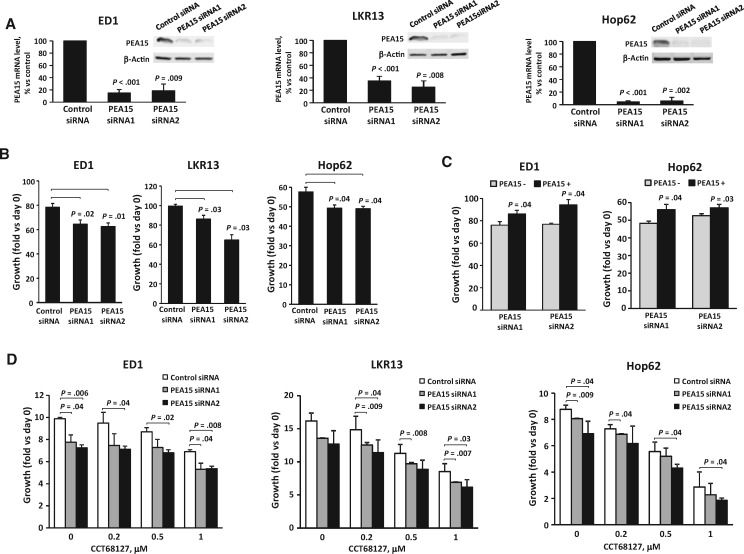
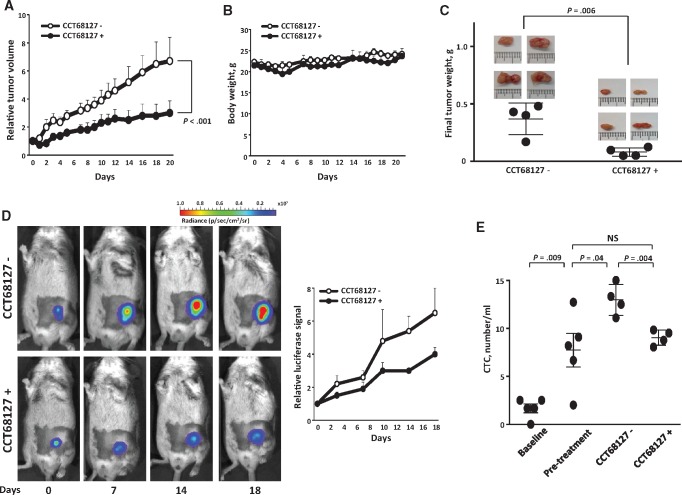
Methods: CCT68127 was studied in lung cancer cells (three murine and five human) and control murine pulmonary epithelial and human immortalized bronchial epithelial cells. Robotic CCT68127 cell-based proliferation screens were used. Cells undergoing multipolar anaphase and inhibited centrosome clustering were scored. Reverse phase protein arrays (RPPAs) assessed CCT68127 effects on signaling pathways. The function of PEA15, a growth regulator highlighted by RPPAs, was analyzed. Syngeneic murine lung cancer xenografts (n = 4/group) determined CCT68127 effects on tumorigenicity and circulating tumor cell levels. All statistical tests were two-sided.

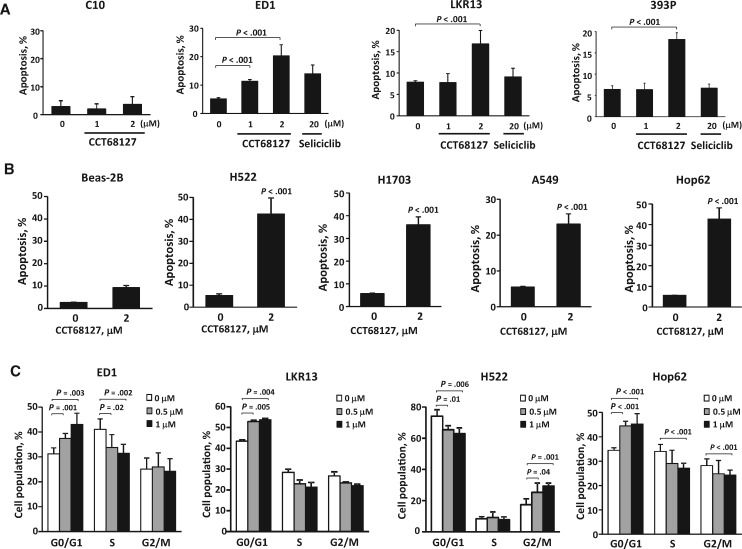
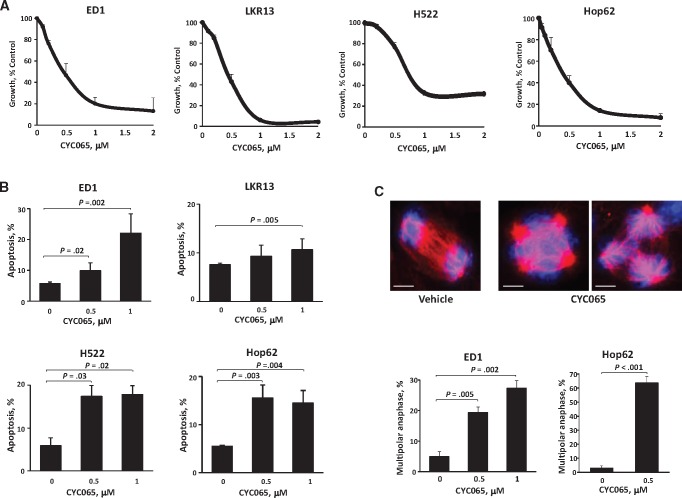
Results: CCT68127 inhibited growth up to 88.5% (SD = 6.4%, P < .003) at 1 μM, induced apoptosis up to 42.6% (SD = 5.5%, P < .001) at 2 μM, and caused G1 or G2/M arrest in lung cancer cells with minimal effects on control cells (growth inhibition at 1 μM: 10.6%, SD = 3.6%, P = .32; apoptosis at 2 μM: 8.2%, SD = 1.0%, P = .22). A robotic screen found that lung cancer cells with KRAS mutation were particularly sensitive to CCT68127 ( P = .02 for IC 50 ). CCT68127 inhibited supernumerary centrosome clustering and caused anaphase catastrophe by 14.1% (SD = 3.6%, P < .009 at 1 μM). CCT68127 reduced PEA15 phosphorylation by 70% (SD = 3.0%, P = .003). The gain of PEA15 expression antagonized and its loss enhanced CCT68127-mediated growth inhibition. CCT68127 reduced lung cancer growth in vivo ( P < .001) and circulating tumor cells ( P = .004). Findings were confirmed with another CDK2/9 inhibitor, CYC065.

Conclusions: Next-generation CDK2/9 inhibition elicits marked antineoplastic effects in lung cancer via anaphase catastrophe and reduced PEA15 phosphorylation.


Figures

Figure 1.
Figure 1.
Antiproliferative effects of CCT68127 against murine and human lung cancer cells. A) Structures of seliciclib and CCT68127. B) Dose-response treatments of seliciclib vs CCT68127 in murine (ED1 and LKR13) lung cancer cells. C) CCT68127 effects on growth of murine immortalized pulmonary epithelial cells (C10) and lung cancer cells (ED1, LKR13, and 393P). D) Effects of CCT68127 on growth of human immortalized bronchial epithelial (Beas-2B) and lung cancer (H522, H1703, Hop62, A549, and H2122) cells. E) Comparison of growth inhibition of CCT68127 in KRAS wild-type vs mutant lung cancer cells using a high-throughput screen of 75 human lung cancer cells. Each symbol displays an individual cell line. Bars represent median values. F) Consequences of engineered gain of individual CDK species expression on proliferation of CCT68127-treated Hop62 human lung cancer cells. G) Immunoblot analyses of phosphorylation of RNA polymerase II in Hop62 human lung cancer cells following CCT68127 treatment. Error bars are standard deviation. The P values were computed using t test with multiple comparison adjustment by Tukey's method (C and F) and Dunnett's method (D), and Mann-Whitney U test (E). All statistical tests were two-sided.
Figure 2.
Figure 2.
Apoptosis and cell cycle analysis in lung cancer cells after CCT68127 treatment. A) Percentages of apoptotic cells after CCT68127 treatment of murine immortalized pulmonary epithelial (C10) and lung cancer (ED1, LKR13, and 393P) cells. Apoptosis induction after seliciclib treatment is shown for murine lung cancer cells. B) Percentages of apoptotic cells after CCT68127 treatment of human immortalized bronchial epithelial (Beas-2B) and lung cancer (H522, H1703, A549, and Hop62) cells. C) Cell cycle analysis after CCT68127 treatment in murine (ED1 and LKR13) and human (H522 and Hop62) lung cancer cells. Error bars are standard deviation. The P values were computed using t test (B) with multiple comparison adjustment by Dunnett's method (A and C). All statistical tests were two-sided.
Figure 3.
Figure 3.
Anaphase catastrophe in lung cancer cells after CCT68127 treatment. A) Comparison of CCT68127 effects on growth of lung cancer cells between vehicle controls, washout (CCT68127 washout after 48 hours’ treatment), and CCT68127 (continuously treated) groups. B) Percentages of cells undergoing multipolar anaphase after CCT68127 treatment in murine (ED1 and LKR13) and human (A549 and Hop62) lung cancer cells, and bipolar immortalized (C10 and Beas-2B) cells. Representative ED1 lung cancer cells are displayed in the upper panels with two spindle poles (vehicle control) and for those undergoing multipolar anaphases (four spindle poles in the middle panel and three spindle poles in the right panel) in the presence of CCT68127 treatment. The blue signal is DAPI staining, and the red signal is α-tubulin staining. Scale bars = 5 µm. C) Effects of engineered CP110 overexpression on growth inhibition by CCT68127 treatment of lung cancer cells. Error bars are standard deviation. The P values were computed using t test (C) with multiple comparison adjustment by the Tukey's method (A) and Dunnet's method (B). All statistical tests were two-sided.
Figure 4.
Figure 4.
Involvement of PEA15 in CCT68127 antineoplastic effects in lung cancer cells. A) Heatmaps of protein expression profiles independently analyzed by RPPA in murine (ED1 and LKR13) and human (H522 and Hop62) lung cancer cells after vehicle or CCT68127 treatments. Clusters of proteins markedly downregulated by CCT68127 treatment are displayed. Complete heatmaps appear in Supplementary Figure 4 (available online). B) Quantifications of PEA15 and PEA15-pS116 protein levels by RPPA after CCT68127 vs vehicle treatments are shown with error bars representing standard deviation. C) Consequences of engineered gain of PEA15 expression on proliferation of CCT68127-treated lung cancer cells. Immunoblot analyses confirmed PEA15 overexpression in upper panels. Error bars show standard deviations. The P values were computed by t tests. All statistical tests were two-sided.
Figure 5.
Figure 5.
Effects of PEA15 knockdown in lung cancer cells. A) Quantitative real-time polymerase chain reaction and immunoblot analyses confirmed PEA15 knockdown. B) Consequences of PEA15 knockdown on growth of lung cancer cells. C) Restored PEA15 expression after PEA15 knockdown in lung cancer cells. Error bars represent standard deviation. D) Consequences of PEA15 knockdown on growth inhibition after CCT68127 treatment of lung cancer cells. Error bars represent the standard deviation. The P values were computed using t test with multiple comparison adjustment by Dunnett's method. All statistical tests were two-sided.
Figure 6.
Figure 6.
PEA15 expression in human lung cancer cases. A) Comparison of PEA15 mRNA expression between normal (N) and malignant (T) lung tissues in lung adenocarcinoma (AD), and squamous cell carcinoma (SCC) lung cancers in the The Cancer Genome Atlas database (n = 59 for N, 517 for T in AD, and 51 for N, 501 for T in SCC). Each symbol represents a single case. Bars represent median values. B) PEA15 expression in normal and malignant lung tissues. Representative PEA15 immunostaining of lung cancers and adjacent normal lung tissues are in the upper panels, and PEA15 immunohistochemical staining of T and N are compared in the lower panels. Scale bars = 200 µm. C) Association between PEA15 immunohistochemical expression and stage. D) Kaplan-Meier analysis of overall survival between human lung cancer cases stratified by PEA15 immunohistochemical expression (high, intermediate, and low). Error bars display standard deviation. The P values were computed using t test (A and B) with multiple comparison adjustment by Tukey’s method (C) and log-rank test (D). The trend test was also performed (C). All statistical tests were two-sided. AD = adenocarcinoma; N = normal; SCC = squamous cell carcinoma; T = malignant.
Figure 7.
Figure 7.
Antitumorigenic effects of CCT68127 treatments. A) Comparison of lung cancer growth in mice treated with vehicle or CCT68127. Day 0 is the treatment start date. B) Mouse body weights did not appreciably change during vehicle or CCT68127 treatments. Error bars are standard deviation. C) Comparison of tumor weights after treatments with vehicle or CCT68127. Each symbol represents a single mouse. Images of the excised tumors are shown. D) Comparison of bioluminescent signals of syngeneic lung cancers in mice treated with vehicle or CCT68127. Representative bioluminescence images of these mice are shown over time in the left panels. E) Comparison of circulating tumor cell (CTC) numbers within the different groups of mice. The baseline group is mice without tumor cell injections. The pretreatment group was injected with tumor cells subcutaneously, and their CTCs were analyzed before the treatment. CCT68127 negative (-) and CCT68127 positive (+) groups were injected with tumor cells subcutaneously, and CTCs were analyzed after completion of the independent treatments with vehicle or CCT68127, respectively. Bars display mean value in this panel. Error bars represent the standard deviation in all graphs. The P values were computed using the mixed model analysis (A) and t test (B) with multiple comparison adjustment by Tukey's method (E). All statistical tests were two-sided. CTC = circulating tumor cell.
Figure 8.
Figure 8.
Antineoplastic activity of the CDK2/9 inhibitor CYC065. A) Dose-response curves for murine (ED1 and LKR13) and human (H522 and Hop62) lung cancer cells after CYC065 or vehicle treatments. B) Percentage of apoptotic cells after CYC065 treatment in murine (ED1 and LKR13) and human (H522 and Hop62) lung cancer cells. C) Percentages of cells undergoing multipolar anaphase after CYC065 or vehicle treatments of murine (ED1) and human (Hop62) lung cancer cells. The vehicle control lung cancer cell shown is bipolar, and in marked contrast the CYC065 treated cells are, respectively, shown with three (right panel) or four (middle panel) spindle poles. The blue signal is DAPI staining, and the red signal is α-tubulin staining. Scale bars = 5 µm. Error bars are standard deviation. The P values were computed using t test with multiple comparisons by Dunnet's method. All statistical tests were two-sided.

Similar articles

Cited by

References

    1. Islami F, Torre LA, Jemal A.. Global trends of lung cancer mortality and smoking prevalence. Transl Lung Cancer Res. 2015;44:327–338. - PMC - PubMed
    1. Torre LA, Bray F, Siegel RL, et al.Global cancer statistics, 2012. CA Cancer J Clin. 2015;652:87–108. - PubMed
    1. Torre LA, Siegel RL, Ward EM, et al.Global cancer incidence and mortality rates and trends-an update. Cancer Epidemiol Biomarkers Prev. 2016;251:16–27. - PubMed
    1. Shapiro GI. Cyclin-dependent kinase pathways as targets for cancer treatment. J Clin Oncol. 2006;2411:1770–1783. - PubMed
    1. Freemantle SJ, Liu X, Feng Q, et al.Cyclin degradation for cancer therapy and chemoprevention. J Cell Biochem. 2007;1024:869–877. - PubMed

MeSH terms