. 2017 Sep 1;109(9):djx014.
doi: 10.1093/jnci/djx014.

Co-activation of STAT3 and YES-Associated Protein 1 (YAP1) Pathway in EGFR-Mutant NSCLC

Affiliations

Co-activation of STAT3 and YES-Associated Protein 1 (YAP1) Pathway in EGFR-Mutant NSCLC

Imane Chaib et al. J Natl Cancer Inst. .

Abstract

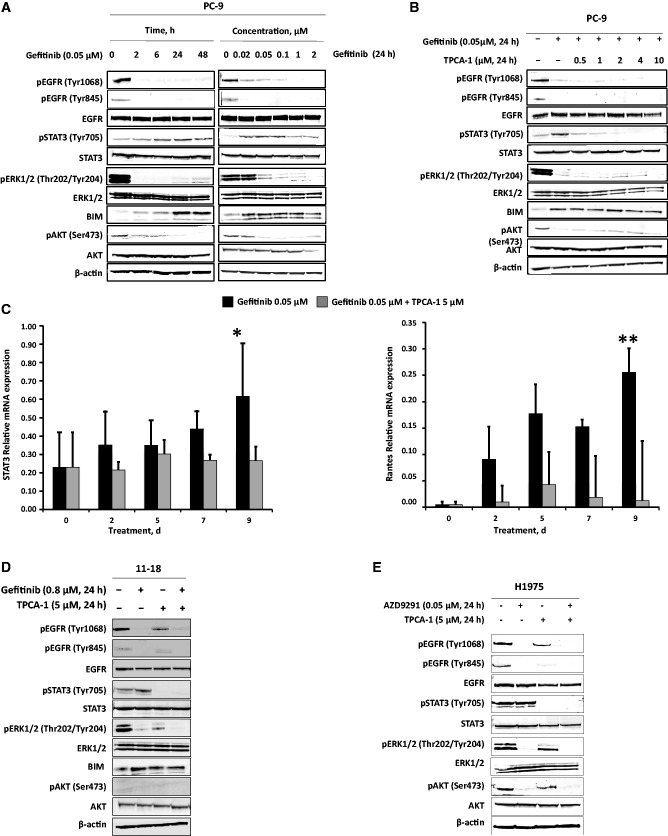
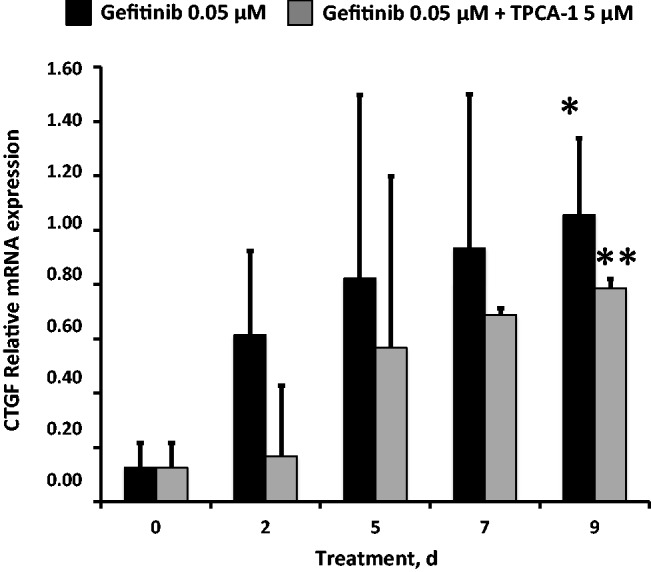
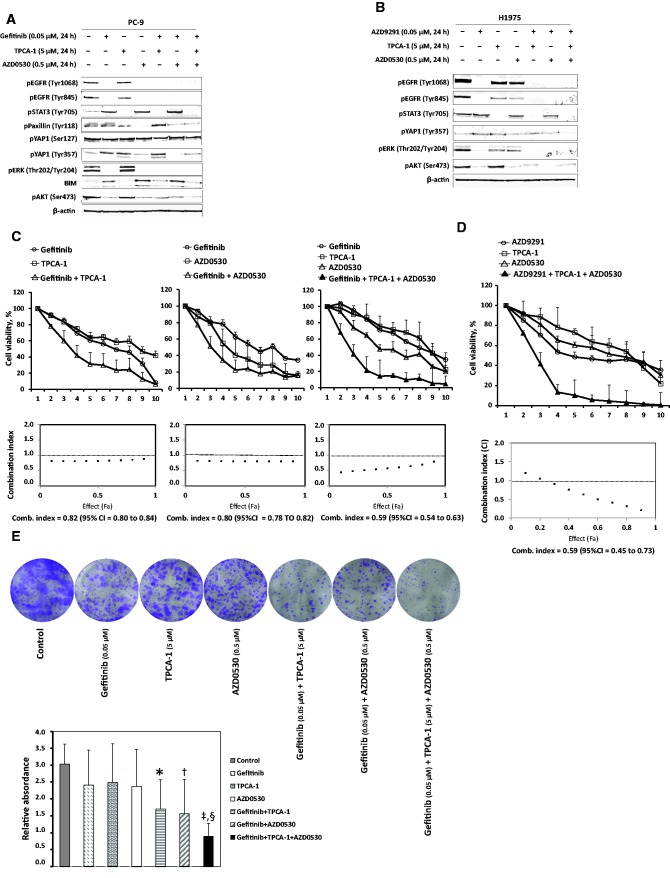
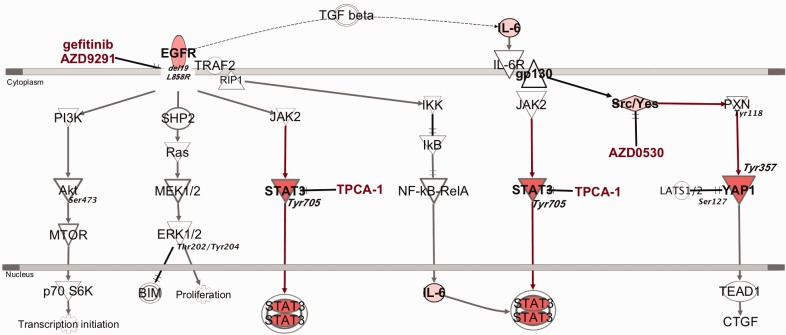
Background: The efficacy of epidermal growth factor receptor (EGFR) tyrosine kinase inhibitors (TKIs) in EGFR-mutant non-small cell lung cancer (NSCLC) is limited by adaptive activation of cell survival signals. We hypothesized that both signal transducer and activator of transcription 3 (STAT3) and Src-YES-associated protein 1 (YAP1) signaling are dually activated during EGFR TKI treatment to limit therapeutic response.

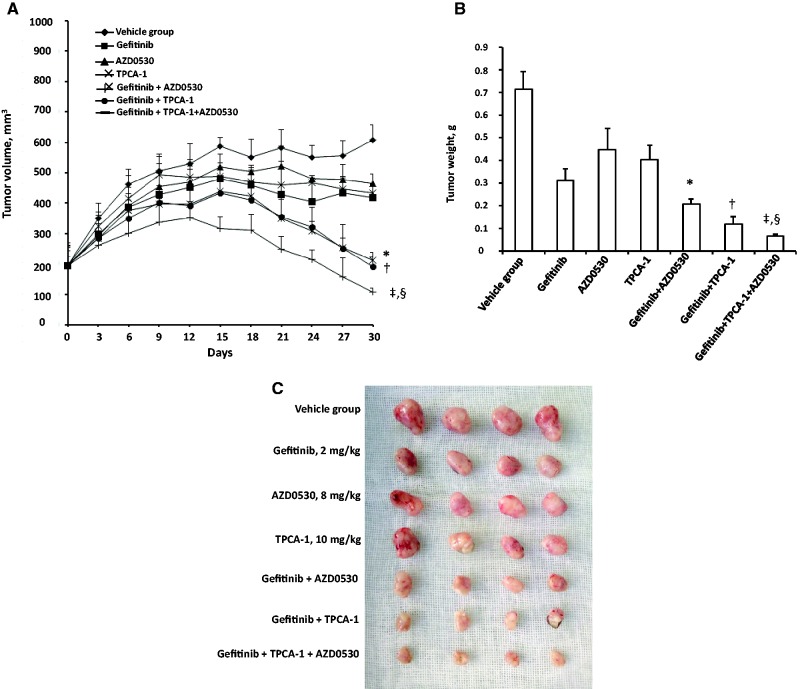
Methods: We used MTT and clonogenic assays, immunoblotting, and quantitative polymerase chain reaction to evaluate the efficacy of EGFR TKI alone and in combination with STAT3 and Src inhibition in three EGFR-mutant NSCLC cell lines. The Chou-Talalay method was used for the quantitative determination of drug interaction. We examined tumor growth inhibition in one EGFR-mutant NSCLC xenograft model (n = 4 mice per group). STAT3 and YAP1 expression was evaluated in tumors from 119 EGFR-mutant NSCLC patients (64 in an initial cohort and 55 in a validation cohort) by quantitative polymerase chain reaction. Kaplan-Meier and Cox regression analyses were used to assess the correlation between survival and gene expression. All statistical tests were two-sided.

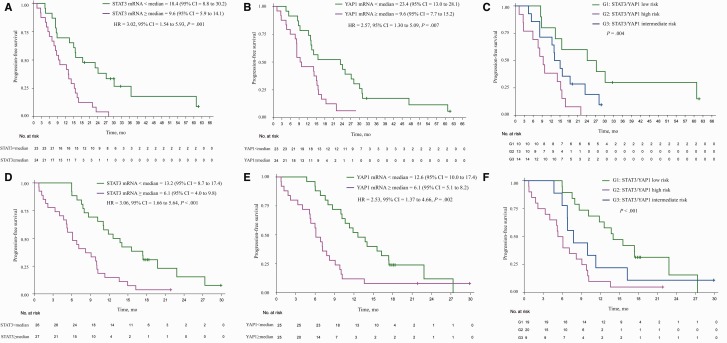
Results: We discovered that lung cancer cells survive initial EGFR inhibitor treatment through activation of not only STAT3 but also Src-YAP1 signaling. Cotargeting EGFR, STAT3, and Src was synergistic in two EGFR-mutant NSCLC cell lines with a combination index of 0.59 (95% confidence interval [CI] = 0.54 to 0.63) for the PC-9 and 0.59 (95% CI = 0.54 to 0.63) for the H1975 cell line. High expression of STAT3 or YAP1 predicted worse progression-free survival (hazard ratio [HR] = 3.02, 95% CI = 1.54 to 5.93, P = .001, and HR = 2.57, 95% CI = 1.30 to 5.09, P = .007, respectively) in an initial cohort of 64 EGFR-mutant NSCLC patients treated with firstline EGFR TKIs. Similar results were observed in a validation cohort.

Conclusions: Our study uncovers a coordinated signaling network centered on both STAT3 and Src-YAP signaling that limits targeted therapy response in lung cancer and identifies an unforeseen rational upfront polytherapy strategy to minimize residual disease and enhance clinical outcomes.


Figures

Figure 1.
Figure 1.
Effect of epidermal growth factor receptor (EGFR) tyrosine kinase inhibitors (TKIs) with or without TPCA-1 (signal transducer and activator of transcription 3 [STAT3] inhibitor) on EGFR-regulated signal transduction pathways. A) Protein lysates from the PC-9 cell line treated with gefitinib (0.05 μM) for 0 to 48 hours were collected and assessed by immunoblot analysis. PC-9 cells were treated with different doses of gefitinib for 24 hours, and protein lysates were assessed by immunoblot analysis. B) PC-9 cells were treated with gefitinib (0.05 μM) in the absence or presence of increasing concentrations of TPCA-1 for 24 hours. Expression of different proteins was analyzed using immunoblot analysis. C) STAT3 and Rantes mRNA expression were measured using quantitative reverse transcription polymerase chain reaction in PC-9 cells that were treated with 0.05 μM of gefitinib or 0.05 μM of gefitinib plus 5 μM of TPCA-1 for nine days. Data were generated from a minimum of three replicates. β-actin was used to normalize gene expression. Data are presented as the means ± standard deviation; *P = .04, **P = .01 (two-sided Student’s t test). D) Extracts from the 11-18 cell line were treated with 0.8 μM gefitinib, TPCA-1 (5 μM), or gefitinib combined with TPCA-1 for 24 hours. E) H1975 cells were treated with AZD9291 (0.05 μM) in the absence or presence of TPCA-1 (5 μM) for 24 hours. Expression of different proteins was analyzed by immunoblot analysis. BIM = Bcl2 interacting mediator of cell death; EGFR = epidermal growth factor receptor; STAT3 = signal transducer and activator of transcription 3.
Figure 2.
Figure 2.
Effect of epidermal growth factor receptor (EGFR) and signal transducer and activator of transcription 3 (STAT3) inhibition on the YES-associated protein 1 (YAP1) signaling pathway. connective tissue growth factor mRNA expression was measured using quantitative reverse transcription-polymerase chain reaction in PC-9 cells that were treated with 0.05 μM of gefitinib or 0.05 μM of gefitinib plus 5 μM of TPCA-1 for nine days. Data were generated from a minimum of three replicates. β-actin was used to normalize gene expression. Data are presented as the means ± standard deviation; *P = .04, **P = .002 (two-sided Student’s t test). CTGF = connective tissue growth factor.
Figure 3.
Figure 3.
Effects of the triple combination of epidermal growth factor receptor (EGFR) tyrosine kinase inhibitor (TKI), TPCA-1, and AZD0530 in PC-9 and H1975 cells. Extracts from (A) the PC-9 cell line treated with gefitinib (0.05 μM), TPCA-1 (5 μM), or AZD0530 (0.5 μM), or double and triple combinations for 24 hours and (B) the H1975 cell line treated with AZD9291 (0.05 μM), TPCA-1 (5 μM), or AZD0530 (0.5 μM), or double and triple combinations for 24 hours, were analyzed for indicated antibodies as well as β-actin as a loading control to confirm equal gel loading by immunoblot analysis. Similar results were obtained in three independent experiments. C) PC-9 cells were treated with serial dilutions of gefitinib, TPCA-1, AZD0530 alone and with their double and triple combinations for 72 hours. The cell viability was measured by MTT, and the synergy between the drugs was determined using the Chou and Talalay method (Chou and Talalay plot or Fa plot). The dotted horizontal line at 1 indicates the line of additive effect. Effect (Fa) indicates the fractional inhibition for each combination index. To calculate drug concentration for each Fa point, the drugs were mixed using constant ratios corresponding to 1/8, 1/4, 1/2, 5/8, 3/4, 7/8, 1, 1.5, and 2 of the individual IC50 values for each drug in the PC-9 cell line. The results represent the means of at least three independent experiments. Data are presented as the means ± standard deviation. D) H1975 cells were treated with serial dilutions of AZD9291, TPCA-1, AZD0530 as a triple combination for 72 hours, a procedure similar to those described in (C). E) PC-9 cells grown in six-well plates (1000 cells/well) for 24 hours and then left untreated or treated with gefitinib, TPCA-1, and AZD0530 alone and with their double and triple combinations. After 72 hours, media was replaced with fresh media without drugs. After seven more days, cells were washed and stained with crystal violet and then photographed. The crystal violet was extracted and assayed by spectrophotometry. The absorbance was measured at 570 nm. Gefitinib was used at 0.05 μM, TPCA-1 at 5 μM, and AZD0530 at 0.5 μM. Data are means ± standard deviation of three independent experiments. *P = .04, gefitinib plus TPCA-1 vs control; †P = .003, gefitinib plus AZD0530 vs control; ‡P = .03, gefitinib plus TPCA-1 plus AZD0530 vs gefitinib plus TPCA-1; §P = .05, gefitinib plus TPCA-1 plus AZD0530 vs gefitinib plus AZD0530 (two-sided Student’s t test). BIM = Bcl2 interacting mediator of cell death; EGFR = epidermal growth factor receptor; STAT3 = signal transducer and activator of transcription 3; YAP1 = YES-associated protein 1.
Figure 4.
Figure 4.
Effect of epidermal growth factor receptor (EGFR), signal transducer and activator of transcription 3 (STAT3), and Src co-inhibition in vivo. A) Mice with established PC-9 tumors were treated with vehicle control, gefitinib alone, TPCA-1 alone, AZD0530 alone, gefitinib and TPCA-1, gefitinib and AZD0530 or gefitinib, TPCA-1, and AZD0530. Each point represents the mean ± standard deviation of the tumor volume (n = 4 per group). Initially, different concentrations of gefitinib (2, 10, 50 mg/kg) were used. Both the 10 mg/kg and 50 mg/kg dose groups showed tumor regression with complete disappearance after 10 days of treatment. Considering the high sensitivity of PC-9 cells to gefitinib, a very low concentration of gefitinib (2 mg/kg) was finally used in this experiment, which explains the shape of the survival curves. Statistically significant differences on day 30 are shown for gefitinib plus AZD0530 vs gefitinib alone (*P < .001), gefitinib plus TPCA-1 vs gefitinib alone (†P < .001), and the triple combination of gefitinib, TPCA-1, and AZD0530 vs gefitinib plus AZD0530 (‡P < .001) and vs gefitinib plus TPCA-1 (§P = .01). B) After 30 days, the mice were killed and the tumors removed and weighed. Tumor weights were individually plotted, and comparisons between control and treatment groups were analyzed by Student’s t test. Representative tumor pictures were taken. The reduction in tumor weight obtained with gefitinib plus TPCA-1 or gefitinib plus AZD0530 in the PC-9 xenograft model was statistically significantly different compared with gefitinib alone (†P < .001 and *P = .009, respectively). The reduction in tumor weight obtained with the triple combination of gefitinib, TPCA-1, and AZD0530 was statistically significantly different compared with gefitinib plus TPCA-1 (§P = .03) and gefitinib plus AZD0530 (‡P < .001). C) Representative tumors surgically removed. The two-sided Student’s t test was used for the statistical analysis. EGFR = epidermal growth factor receptor; STAT3 = signal transducer and activator of transcription 3; YAP1 = YES-associated protein 1.
Figure 5.
Figure 5.
Signal transducer and activator of transcription 3 (STAT3) and YES-associated protein 1 (YAP1) mRNA expression as biomarkers to predict outcome to epidermal growth factor receptor (EGFR) tyrosine kinase inhibitor (TKI). A) Progression-free survival by STAT3 mRNA expression levels for the 64 patients with EGFR-mutant non–small cell lung cancer (NSCLC) treated with firstline EGFR TKI. STAT3 mRNA expression was evaluable in 47 out of the 64 patients. B) Progression-free survival by YAP1 mRNA expression levels for the 64 patients with EGFR-mutant NSCLC treated with firstline EGFR TKI. YAP1 mRNA expression was evaluable in 47 out of the 64 patients. C) Progression-free survival by STAT3 and YAP1 mRNA expression levels for the 64 patients with EGFR-mutant NSCLC treated with firstline EGFR TKI. Both STAT3 and YAP1 mRNA expression were evaluable in 37 out of 64 patients. STAT3 expression lower than the median combined with YAP1 expression lower than the median denotes a low-risk group. STAT3 expression higher than the median combined with YAP1 expression higher than the median denotes a high-risk group. D) Progression-free survival by STAT3 mRNA expression levels for the 55 patients with EGFR-mutant NSCLC treated with firstline EGFR (validation cohort). STAT3 mRNA expression was evaluable in 53 out of the 55 patients. E) Progression-free survival by YAP1 mRNA expression levels for the 55 patients with EGFR-mutant NSCLC treated with firstline EGFR (validation cohort). YAP1 mRNA expression was evaluable 50 out of the 55 patients. F) Progression-free survival by STAT3 and YAP1 mRNA expression levels for the 55 patients with EGFR-mutant NSCLC treated with firstline EGFR (validation cohort). Both STAT3 and YAP1 mRNA expression were evaluable in 48 out of 55 patients. STAT3 expression lower than the median combined with YAP1 expression lower than the median denotes a low-risk group. STAT3 expression higher than the median combined with YAP1 expression higher than the median denotes a high-risk group. Progression-free survivals were compared with a two-sided nonparametric log-rank test. CI = confidence interval; HR = hazard ratio.
Figure 6.
Figure 6.
Epidermal growth factor receptor (EGFR), signal transducer and activator of transcription 3 (STAT3), and Src-YES-associated protein 1 (YAP1) crosstalk. EGFR-activating mutations located in the tyrosine kinase domains and mainly in the form of a base-pair deletion at exon 19 (ΔE746_A750) or a point mutation at exon 21 (L858R) enhance cell growth and invasion via tyrosine phosphorylation and lead to the activation of mitogen-activated protein kinase (MAPK), STAT3, and AKT pathways. Ras-ERK signaling promotes cell growth and decreases apoptosis-related BIM expression. SHP2 modulates signals of receptor tyrosine kinases at the level of Ras. Phosphorylation of the tyrosine residue 705 of cytoplasmic STAT3 in response to activated EGFR promotes STAT3 homodimerization, which leads to nucleus translocation and DNA binding. IL-6 signals via receptor complexes, which contain gp130, the common signal-transducing protein of the IL-6 family of cytokines and IL-6R. IL-6R is not a signal transducer, but its function is to present IL-6 to the signal-transducer gp130, resulting in phosphorylation of gp130 by JAK2 and recruitment of STAT3. In EGFR TKI–resistant cells, paracrine or autocrine stimulation of the TGF-β axis drives expression of IL-6 and activation of STAT3, unleashing the cells from their EGFR activity dependency. gp130 associates with Src and YES and triggers activation of YAP1 through phosphorylation on the tyrosine residue 357, independently of STAT3. YAP1 is normally kept inactive in the cytoplasm through phosphorylation on serine residue 127 by the Hippo effector kinase LATS. EGFR inhibition promotes immediate ubiquitination of TRAF2, which is essential for RIP1 and IKK activation, IkB phosphorylation, and degradation and NF-κB (RelA) nuclear translocation. NF-κB-induced IL-6 ensures STAT3 activation. TPCA-1 is a STAT3 inhibitor. AZD0530 (saracatinib) is a potent, orally administered small molecule that inhibits Src by blocking the ATP-binding site of Src kinases. BIM = Bcl2 interacting mediator of cell death; CTGF = connective tissue growth factor; ERK = extracellular signal-regulated kinase; gp130 = glycoprotein 130; IkB = nuclear factor of kappa light polypeptide gene enhancer in B-cells inhibitor; IKK = IkB kinase; IL-6 = interleukin 6; IL-6R = IL-6 receptor; JAK2 = Janus kinase 2; LATS1/2 = large tumor suppressor kinase 1 and 2; MEK = mitogen-activated protein kinase; MTOR = mechanistic target of rapamycin; P 70 S6K = ribosomal protein S6 kinase beta-1; NF-κB = nuclear factor kappa light chain enhancer of activated B cells; PI3K = phosphatidylinositide 3 kinase; P XN = paxillin; RelA = v-rel reticuloendotheliosis viral oncogene homolog A; RIP1 = receptor-interacting protein 1; Ser = serine; SHP2 = Src homology region 2–containing protein tyrosine phosphatase 2; STAT3 = signal transducer and activator of transcription 3; TEAD1 = TEA domain transcription factor 1; TGF-beta = transforming growth factor beta; Thr = threonine; TRAF2 = TNF receptor–associated factor 2; Tyr = tyrosine; YAP1 = YES-associated protein 1.

Similar articles

Cited by

References

    1. Rosell R, Moran T, Queralt C, et al. Screening for epidermal growth factor receptor mutations in lung cancer. N Engl J Med. 2009;361(10):958–967. - PubMed
    1. Guo A, Villen J, Kornhauser J, et al. Signaling networks assembled by oncogenic EGFR and c-Met. Proc Natl Acad Sci U S A. 2008;105(2):692–697. - PMC - PubMed
    1. Phuchareon J, McCormick F, Eisele DW, et al. EGFR inhibition evokes innate drug resistance in lung cancer cells by preventing Akt activity and thus inactivating Ets-1 function. Proc Natl Acad Sci U S A. 2015;112(29):E3855–E3863. - PMC - PubMed
    1. Rosell R, Carcereny E, Gervais R, et al. Erlotinib versus standard chemotherapy as first-line treatment for European patients with advanced EGFR mutation-positive non-small-cell lung cancer (EURTAC): A multicentre, open-label, randomised phase 3 trial. Lancet Oncol. 2012;13(3):239–246. - PubMed
    1. Sordella R, Bell DW, Haber DA, et al. Gefitinib-sensitizing EGFR mutations in lung cancer activate anti-apoptotic pathways. Science. 2004;305(5687):1163–1167. - PubMed

MeSH terms