

Prevalence of Atypical Pathogens in Patients With Cough and Community-Acquired Pneumonia: A Meta-Analysis
- PMID: 28376442
- PMCID: PMC5389400
- DOI: 10.1370/afm.1993
Prevalence of Atypical Pathogens in Patients With Cough and Community-Acquired Pneumonia: A Meta-Analysis
Abstract
Purpose: Community-acquired pneumonia (CAP), acute cough, bronchitis, and lower respiratory tract infections (LRTI) are often caused by infections with viruses or Streptococcus pneumoniae. The prevalence of atypical pathogens Mycoplasma pneumoniae, Chlamydophila pneumoniae, Legionella pneumophila, and Bordetella pertussis among patients with these illnesses in the ambulatory setting has not been previously summarized. We set out to derive prevalence information from the existing literature.
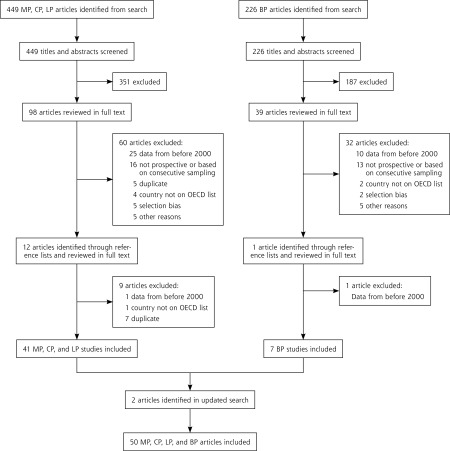
Methods: We performed a systematic review of MEDLINE for prospective, consecutive-series studies reporting the prevalence of M pneumoniae, C pneumoniae, L pneumophila and/or B pertussis in outpatients with cough, acute bronchitis, LRTI, or CAP. Articles were independently reviewed by 2 authors for inclusion and abstraction of data; discrepancies were resolved by consensus discussion. A meta-analysis was performed on each pathogen to calculate the pooled prevalence estimates using a random effects model of raw proportions.
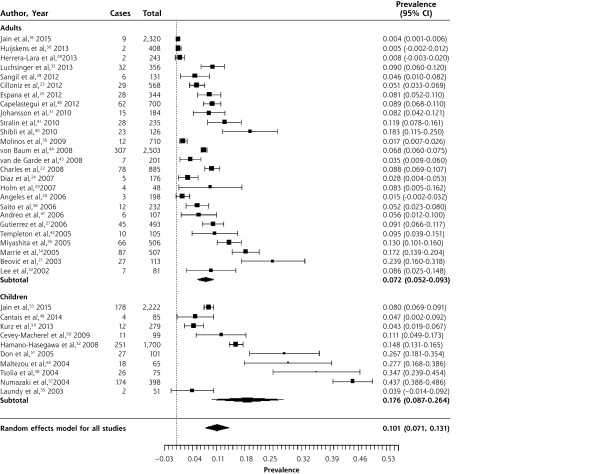
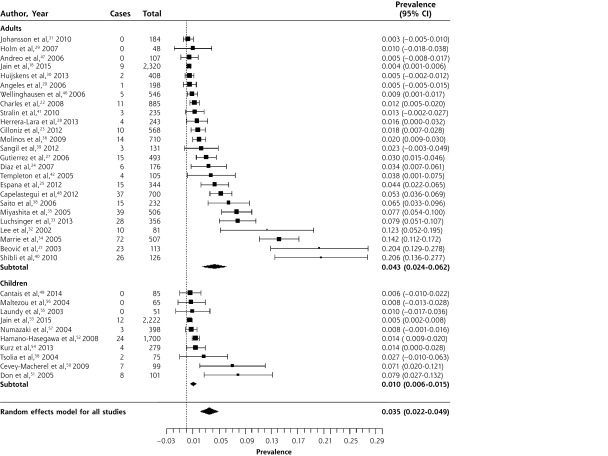
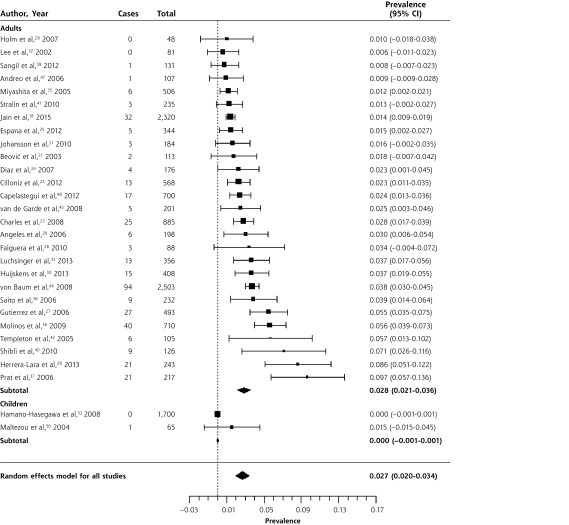
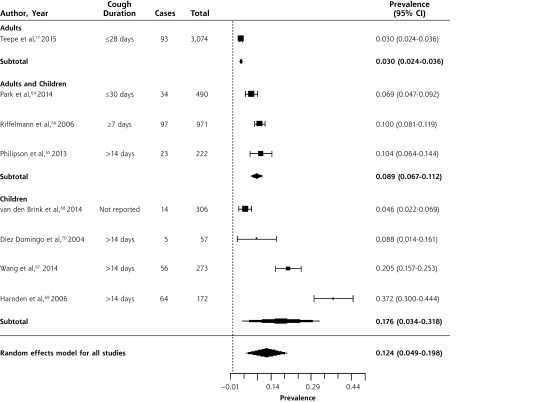
Results: Fifty studies met our inclusion criteria. While calculated heterogeneity was high, most studies reported prevalence for each pathogen within a fairly narrow range. In patients with CAP, the overall prevalences of M pneumoniae and C pneumoniae were 10.1% (95% CI, 7.1%-13.1%) and 3.5% (95% CI, 2.2%-4.9%), respectively. Consistent with previous reports, M pneumoniae prevalence peaked in roughly 6-year intervals. Overall prevalence of L pneumophila was 2.7% (95% CI, 2.0%-3.4%), but the organism was rare in children, with only 1 case in 1,765. In patients with prolonged cough in primary care, the prevalence of B pertussis was 12.4% (95% CI, 4.9%-19.8%), although it was higher in studies that included only children (17.6%; 95% CI, 3.4%-31.8%).
Conclusions: Atypical bacterial pathogens are relatively common causes of lower respiratory diseases, including cough, bronchitis, and CAP. Where surveillance data were available, we found higher prevalences in studies where all patients are tested for these pathogens. It is likely that these conditions are underreported, underdiagnosed, and undertreated in current clinical practice.
Keywords: Bordetella pertussis; Chlamydophila pneumoniae; Legionella pneumophila; Mycoplasma pneumoniae; community acquired pneumonia; cough; respiratory tract infection.
© 2016 Annals of Family Medicine, Inc.
Figures
References
-
- Hsiao CJ, Cherry D, Beatty PC, Rechtsteiner EA. National Ambulatory Medical Care Survey: 2007 summary. Hyattsville, MD: National Center for Health Statistics; 2010. National Health Statistics Reports, No. 27. - PubMed
-
- van Vugt SF, Verheij TJ, de Jong PA, et al. ; GRACE Project Group. Diagnosing pneumonia in patients with acute cough: clinical judgment compared to chest radiography. Eur Respir J. 2013;42(4):1076–1082. - PubMed
-
- Centers for Disease Control and Prevention. 2014 Provisional Pertussis Surveillance Report. http://www.cdc.gov/pertussis/downloads/pertuss-surv-report-2014.pdf. Published Oct 2015.
-
- Nguipdop-Djomo P, Fine P, Halsby K, Chalker V, Vynnycky E. Cyclic epidemics of Mycoplasma pneumoniae infections in England and Wales from 1975 to 2009: time-series analysis and mathematical modelling. The Lancet. 2013;382(S78).
Publication types
MeSH terms
LinkOut - more resources
Full Text Sources
Other Literature Sources
Medical
Miscellaneous