

Cord Blood Metabolome Is Highly Associated with Birth Weight, but Less Predictive for Later Weight Development
- PMID: 28376503
- PMCID: PMC5644937
- DOI: 10.1159/000453001
Cord Blood Metabolome Is Highly Associated with Birth Weight, but Less Predictive for Later Weight Development
Abstract
Background/aims: Fetal metabolism may be changed by the exposure to maternal factors, and the route to obesity may already set in utero. Cord blood metabolites might predict growth patterns and later obesity. We aimed to characterize associations of cord blood with birth weight, postnatal weight gain, and BMI in adolescence.
Methods: Over 700 cord blood samples were collected from infants participating in the German birth cohort study LISAplus. Glycerophospholipid fatty acids (GPL-FA), polar lipids, non-esterified fatty acids (NEFA), and amino acids were analyzed with a targeted, liquid chromatography-tandem mass spectrometry based metabolomics platform. Cord blood metabolites were related to growth factors by linear regression models adjusted for confounding variables.
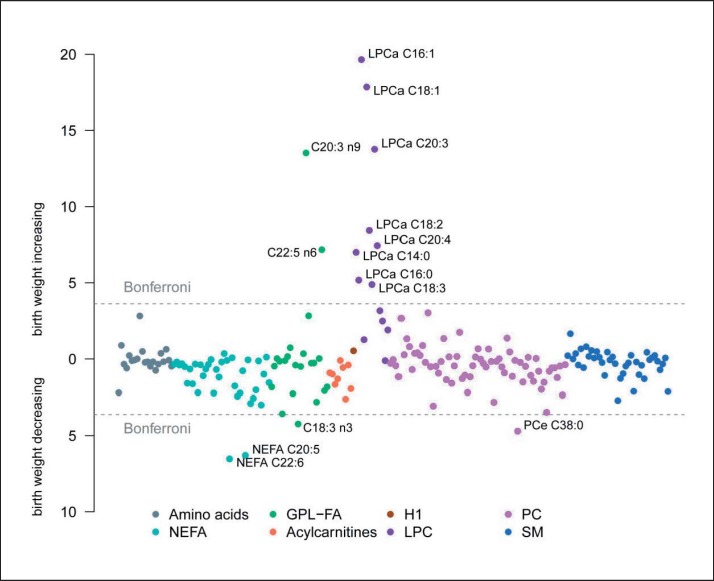
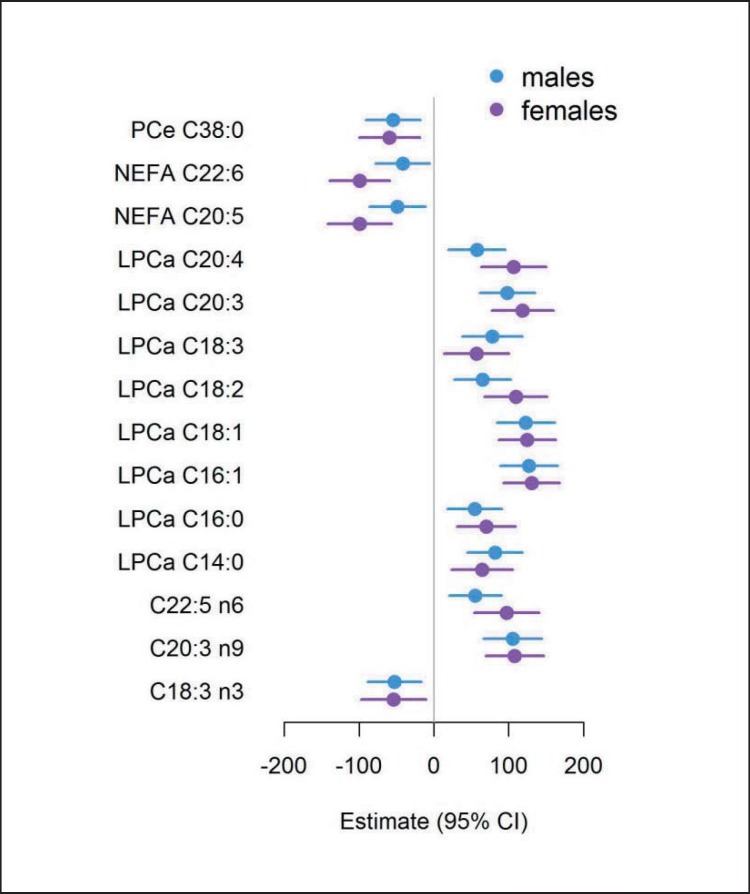
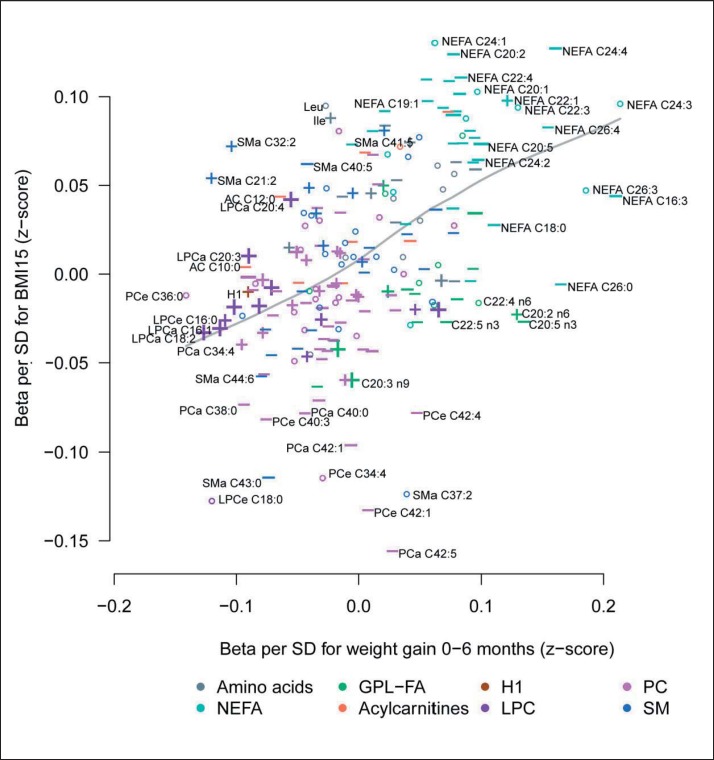
Results: Cord blood metabolites were highly associated with birth weight. Lysophosphatidylcholines C16:1, C18:1, C20:3, C18:2, C20:4, C14:0, C16:0, C18:3, GPL-FA C20:3n-9, and GPL-FA C22:5n-6 were positively related to birth weight, while higher cord blood concentrations of NEFA C22:6, NEFA C20:5, GPL-FA C18:3n-3, and PCe C38:0 were associated with lower birth weight. Postnatal weight gain and BMI z-scores in adolescents were not significantly associated with cord blood metabolites after adjustment for multiple testing.
Conclusion: Potential long-term programming effects of the intrauterine environment and metabolism on later health cannot be predicted with profiling of the cord blood metabolome.
Keywords: Childhood obesity; Cord blood; Early programming; Metabolomics.
© 2017 The Author(s) Published by S. Karger GmbH, Freiburg.
Figures

Similar articles
-
Transgenerational cycle of obesity and diabetes: investigating possible metabolic precursors in cord blood from the PREOBE study.Acta Diabetol. 2019 Sep;56(9):1073-1082. doi: 10.1007/s00592-019-01349-y. Epub 2019 May 6. Acta Diabetol. 2019. PMID: 31062097
-
Associations of cord blood metabolites with early childhood obesity risk.Int J Obes (Lond). 2015 Jul;39(7):1041-8. doi: 10.1038/ijo.2015.39. Epub 2015 Mar 25. Int J Obes (Lond). 2015. PMID: 25804930 Free PMC article.
-
Maternal BMI and Glycemia Impact the Fetal Metabolome.Diabetes Care. 2017 Jul;40(7):902-910. doi: 10.2337/dc16-2452. Diabetes Care. 2017. PMID: 28637888 Free PMC article.
-
Impact of maternal BMI and gestational diabetes mellitus on maternal and cord blood metabolome: results from the PREOBE cohort study.Acta Diabetol. 2019 Apr;56(4):421-430. doi: 10.1007/s00592-019-01291-z. Epub 2019 Feb 6. Acta Diabetol. 2019. PMID: 30725264
-
Offspring body size and metabolic profile - effects of lifestyle intervention in obese pregnant women.Dan Med J. 2014 Jul;61(7):B4893. Dan Med J. 2014. PMID: 25123127 Review.
Cited by
-
Myo-inositol moderates maternal BMI and glycemia related variations in in-vitro placental 13C-DHA-metabolism, altering their relationships with birthweight.Sci Rep. 2022 Sep 1;12(1):14895. doi: 10.1038/s41598-022-18309-2. Sci Rep. 2022. PMID: 36050341 Free PMC article.
-
Cord Blood Metabolome and BMI Trajectory from Birth to Adolescence: A Prospective Birth Cohort Study on Early Life Biomarkers of Persistent Obesity.Metabolites. 2021 Oct 28;11(11):739. doi: 10.3390/metabo11110739. Metabolites. 2021. PMID: 34822398 Free PMC article.
-
Sex-Specific Perturbation of Systemic Lipidomic Profile in Newborn Lambs Impacted by Prenatal Testosterone Excess.Endocrinology. 2023 Dec 23;165(2):bqad187. doi: 10.1210/endocr/bqad187. Endocrinology. 2023. PMID: 38060679 Free PMC article.
-
Cord Blood Metabolite Profiles and Their Association with Autistic Traits in Childhood.Metabolites. 2023 Nov 9;13(11):1140. doi: 10.3390/metabo13111140. Metabolites. 2023. PMID: 37999236 Free PMC article.
-
Cord blood metabolic signatures predictive of childhood overweight and rapid growth.Int J Obes (Lond). 2021 Oct;45(10):2252-2260. doi: 10.1038/s41366-021-00888-1. Epub 2021 Jul 12. Int J Obes (Lond). 2021. PMID: 34253844 Free PMC article.
References
-
- Barker DJ, Osmond C. Infant mortality, childhood nutrition, and ischaemic heart disease in England and Wales. Lancet. 1986;1:1077–1081. - PubMed
-
- Koletzko B, Brands B, Chourdakis M, Cramer S, Grote V, Hellmuth C, Kirchberg F, Prell C, Rzehak P, Uhl O, Weber M. The power of programming and the earlynutrition project: opportunities for health promotion by nutrition during the first thousand days of life and beyond. Ann Nutr Metab. 2014;64:187–196. - PubMed
-
- Sookoian S, Gianotti TF, Burgueno AL, Pirola CJ. Fetal metabolic programming and epigenetic modifications: a systems biology approach. Pediatr Res. 2013;73:531–542. - PubMed
-
- Hales CN, Barker DJ. The thrifty phenotype hypothesis. Br Med Bull. 2001;60:5–20. - PubMed
-
- Okada T, Takahashi S, Nagano N, Yoshikawa K, Usukura Y, Hosono S. Early postnatal alteration of body composition in preterm and small-for-gestational-age infants: implications of catch-up fat. Pediatr Res. 2015;77:136–142. - PubMed
MeSH terms
Substances
LinkOut - more resources
Full Text Sources
Other Literature Sources
Medical
