

Determinants of the calibration of SAPS II and SAPS 3 mortality scores in intensive care: a European multicenter study
- PMID: 28376908
- PMCID: PMC5379500
- DOI: 10.1186/s13054-017-1673-6
Determinants of the calibration of SAPS II and SAPS 3 mortality scores in intensive care: a European multicenter study
Abstract
Background: The aim of the Simplified Acute Physiology Score (SAPS) II and SAPS 3 is to predict the mortality of patients admitted to intensive care units (ICUs). Previous studies have suggested that the calibration of these scores may vary across countries, centers, and/or characteristics of patients. In the present study, we aimed to assess determinants of the calibration of these scores.
Methods: We assessed the calibration of the SAPS II and SAPS 3 scores among 5266 patients admitted to ICUs during a 4-week period at 120 centers in 17 European countries. We obtained calibration curves, Brier scores, and standardized mortality ratios. Points attributed to SAPS items were reevaluated and compared with those of the original scores. Finally, we tested associations between the calibration and center characteristics.
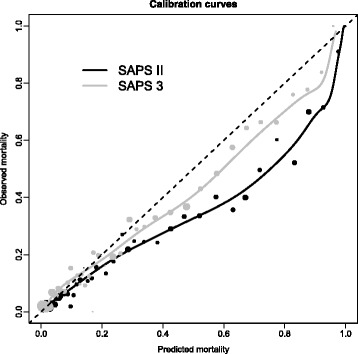
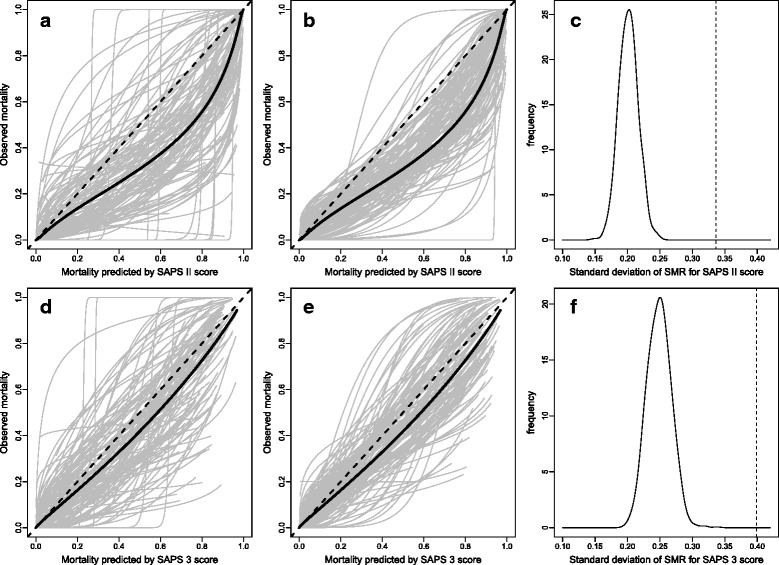
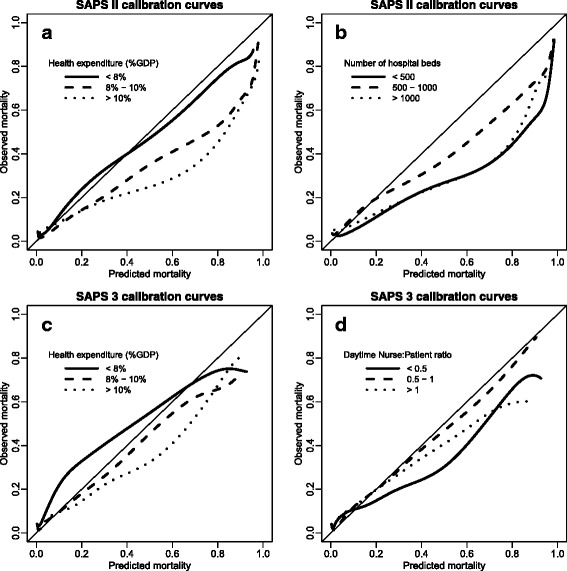
Results: The mortality was overestimated by both scores: The standardized mortality ratios were 0.75 (95% CI 0.71-0.79) for the SAPS II score and 0.91 (95% CI 0.86-0.96) for the SAPS 3 score. This overestimation was partially explained by changes in associations between some items of the scores and mortality, especially the heart rate, Glasgow Coma Scale score, and diagnosis of AIDS for SAPS II. The calibration of both scores was better in countries with low health expenditures. The between-center variability in calibration curves was much greater than expected by chance.
Conclusions: Both scores overestimate current mortality among European ICU patients. The magnitude of the miscalibration of SAPS II and SAPS 3 scores depends not only on patient characteristics but also on center characteristics. Furthermore, much between-center variability in calibration remains unexplained by these factors.
Trial registration: ClinicalTrials.gov identifier: NCT01422070 . Registered 19 August 2011.
Keywords: Calibration; Determinants; SAPS 3; SAPS II.
Figures
Similar articles
-
Validation of four prognostic scores in patients with cancer admitted to Brazilian intensive care units: results from a prospective multicenter study.Intensive Care Med. 2010 Jul;36(7):1188-95. doi: 10.1007/s00134-010-1807-7. Epub 2010 Mar 11. Intensive Care Med. 2010. PMID: 20221751
-
Predictive Performance of the Simplified Acute Physiology Score (SAPS) II and the Initial Sequential Organ Failure Assessment (SOFA) Score in Acutely Ill Intensive Care Patients: Post-Hoc Analyses of the SUP-ICU Inception Cohort Study.PLoS One. 2016 Dec 22;11(12):e0168948. doi: 10.1371/journal.pone.0168948. eCollection 2016. PLoS One. 2016. PMID: 28006826 Free PMC article.
-
Performance of SAPS II according to ICU length of stay: A Danish nationwide cohort study.Acta Anaesthesiol Scand. 2019 Oct;63(9):1200-1209. doi: 10.1111/aas.13415. Epub 2019 Jun 14. Acta Anaesthesiol Scand. 2019. PMID: 31197823
-
Severity scores in respiratory intensive care: APACHE II predicted mortality better than SAPS II.Respir Care. 1995 Oct;40(10):1042-7. Respir Care. 1995. PMID: 10152703 Review.
-
International registry on the use of the CytoSorb® adsorber in ICU patients : Study protocol and preliminary results.Med Klin Intensivmed Notfmed. 2019 Nov;114(8):699-707. doi: 10.1007/s00063-017-0342-5. Epub 2017 Sep 4. Med Klin Intensivmed Notfmed. 2019. PMID: 28871441 Review. English.
Cited by
-
Effectiveness of LODS, OASIS, and SAPS II to predict in-hospital mortality for intensive care patients with ST elevation myocardial infarction.Sci Rep. 2021 Dec 13;11(1):23887. doi: 10.1038/s41598-021-03397-3. Sci Rep. 2021. PMID: 34903820 Free PMC article.
-
Outcome in patients with open abdomen treatment for peritonitis: a multidomain approach outperforms single domain predictions.J Clin Monit Comput. 2022 Aug;36(4):1109-1119. doi: 10.1007/s10877-021-00743-8. Epub 2021 Jul 10. J Clin Monit Comput. 2022. PMID: 34247307 Free PMC article.
-
Development and Validation of Machine Learning-Based Models to Predict In-Hospital Mortality in Life-Threatening Ventricular Arrhythmias: Retrospective Cohort Study.J Med Internet Res. 2023 Nov 15;25:e47664. doi: 10.2196/47664. J Med Internet Res. 2023. PMID: 37966870 Free PMC article. Clinical Trial.
-
The association between the change in severity score from baseline and the outcomes of critically ill patients was enhanced by integration of bioimpedance analysis parameters.Sci Rep. 2024 Jun 25;14(1):14681. doi: 10.1038/s41598-024-65782-y. Sci Rep. 2024. PMID: 38918462 Free PMC article.
-
The predictive power of SAPS-3 and SOFA scores and their relations with patient outcomes in the Surgical Intensive Care Unit.Turk J Surg. 2019 Jun 13;35(2):124-130. doi: 10.5578/turkjsurg.4223. eCollection 2019 Jun. Turk J Surg. 2019. PMID: 32550317 Free PMC article.
References
Publication types
MeSH terms
Associated data
LinkOut - more resources
Full Text Sources
Other Literature Sources
Medical
