. 2017 Aug 1;313(2):E121-E133.
doi: 10.1152/ajpendo.00409.2016. Epub 2017 Apr 4.

Cyp8b1 ablation prevents Western diet-induced weight gain and hepatic steatosis because of impaired fat absorption

Affiliations

Cyp8b1 ablation prevents Western diet-induced weight gain and hepatic steatosis because of impaired fat absorption

Enrico Bertaggia et al. Am J Physiol Endocrinol Metab. .

Abstract

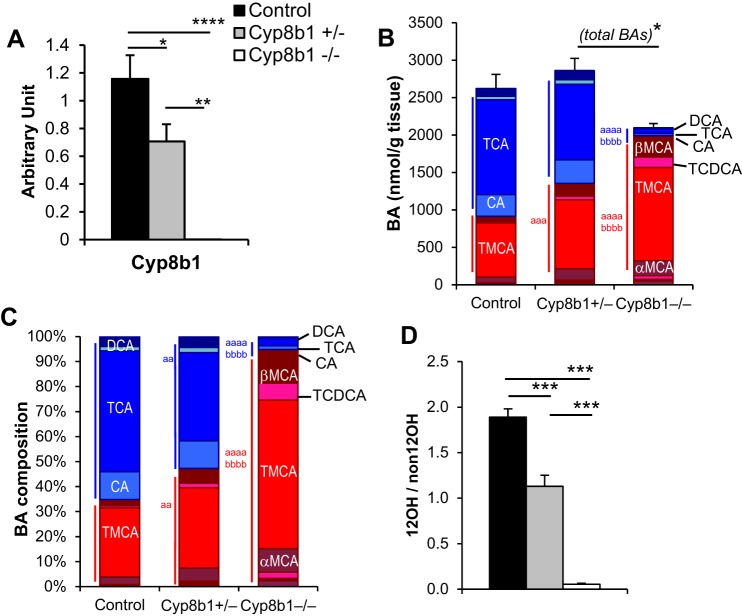
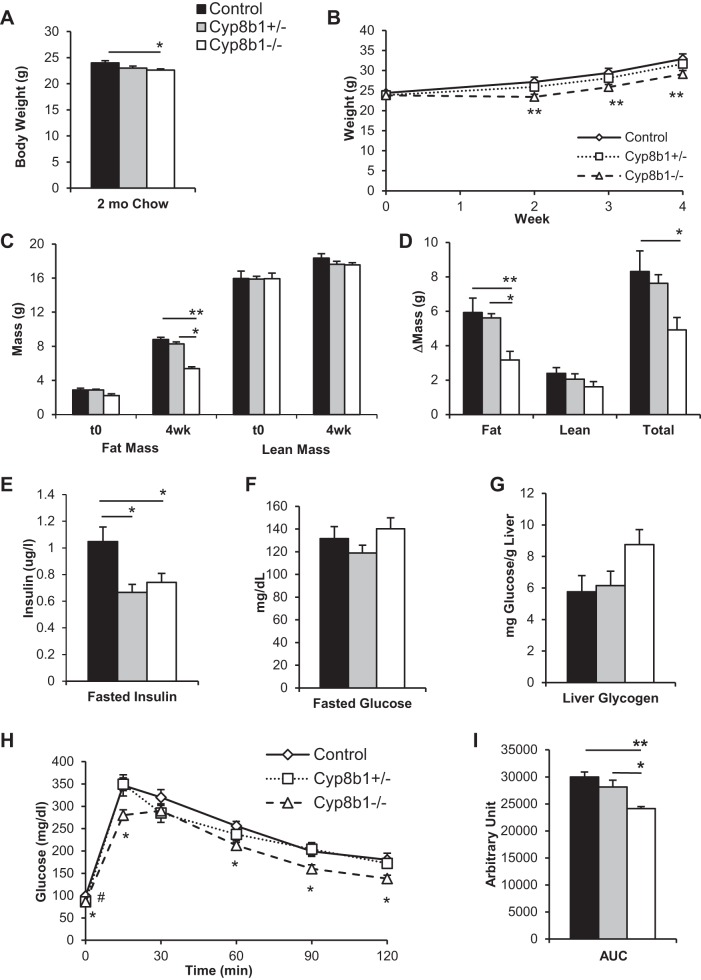
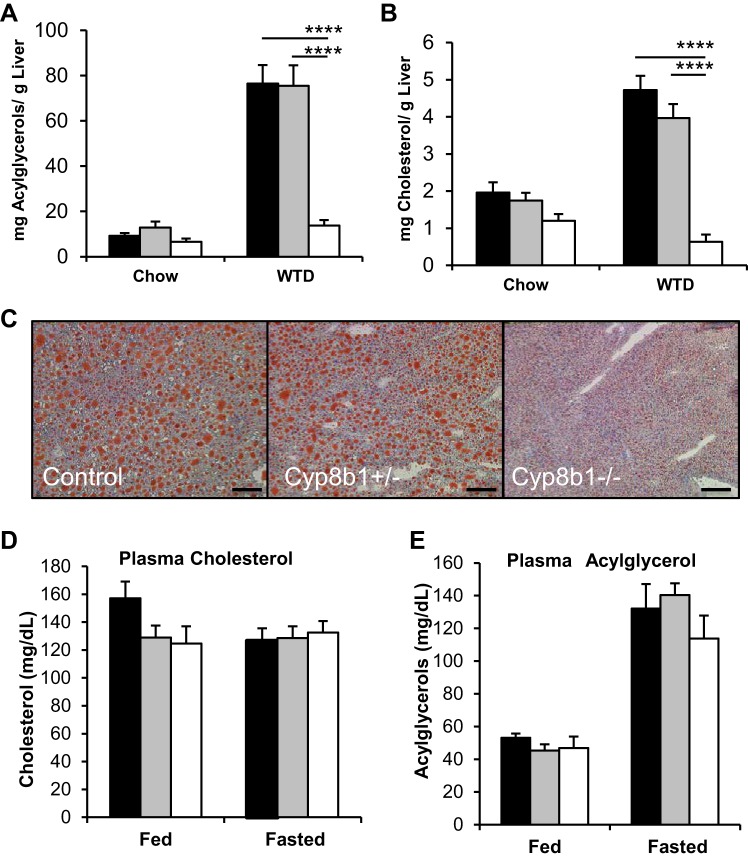
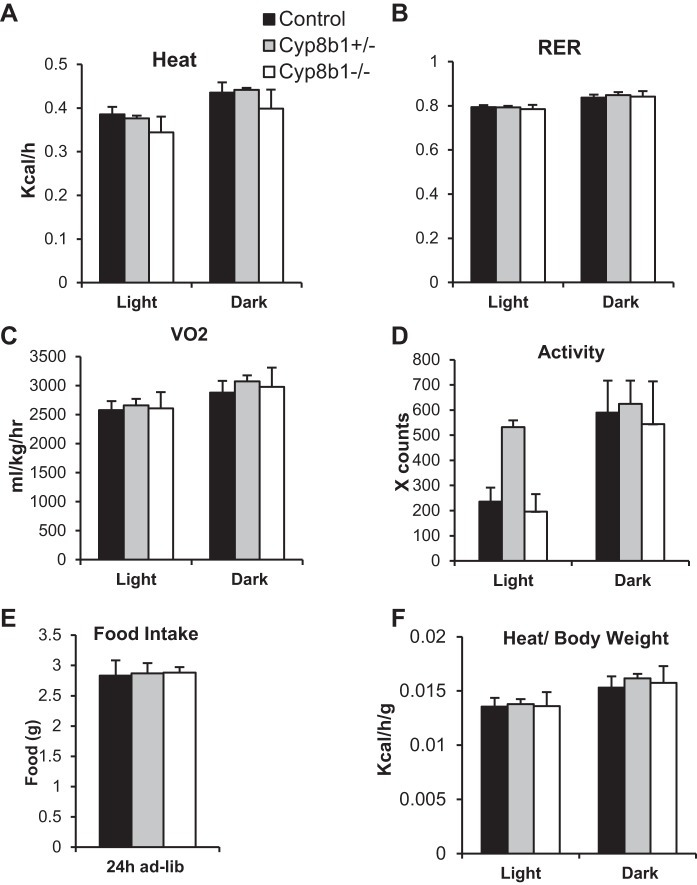
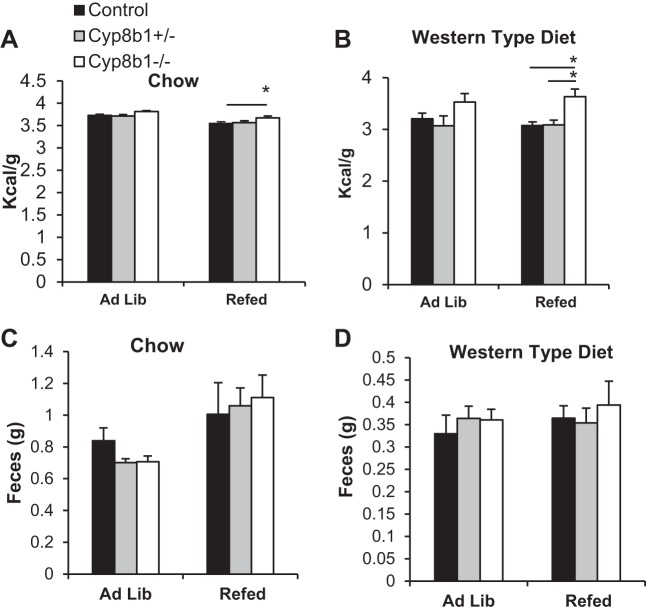
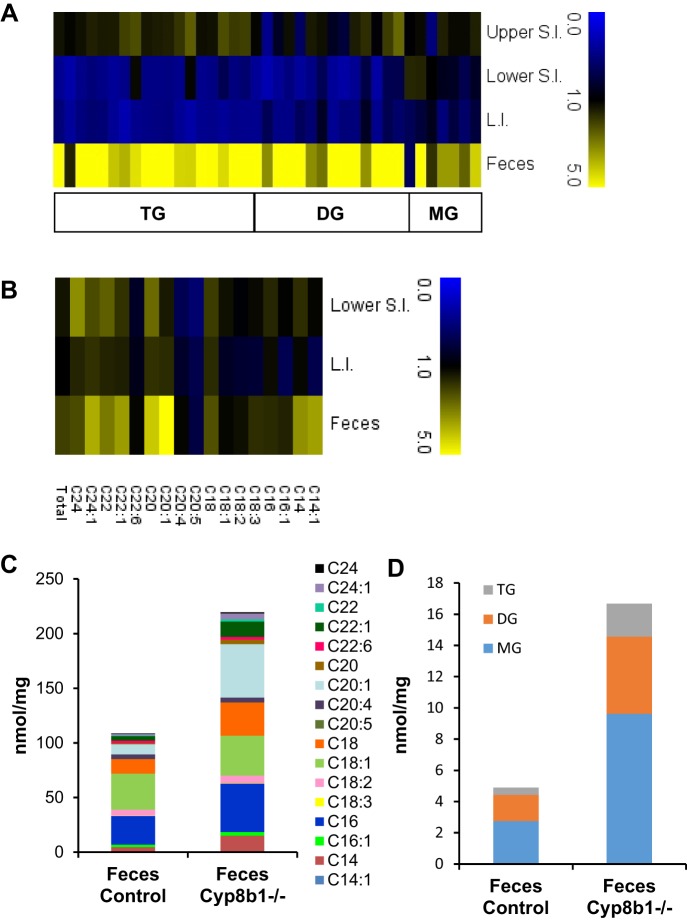
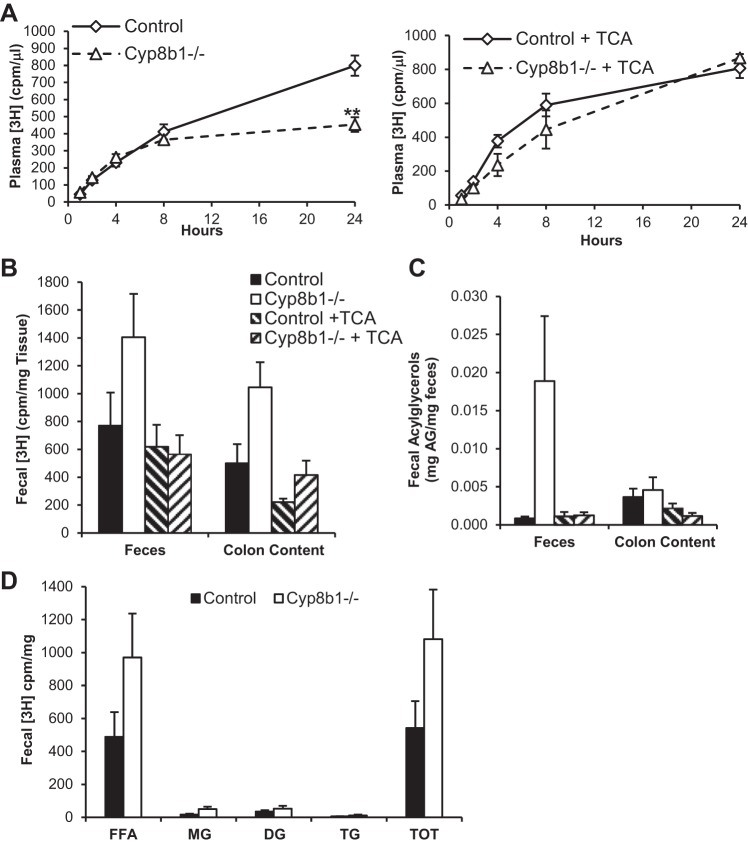
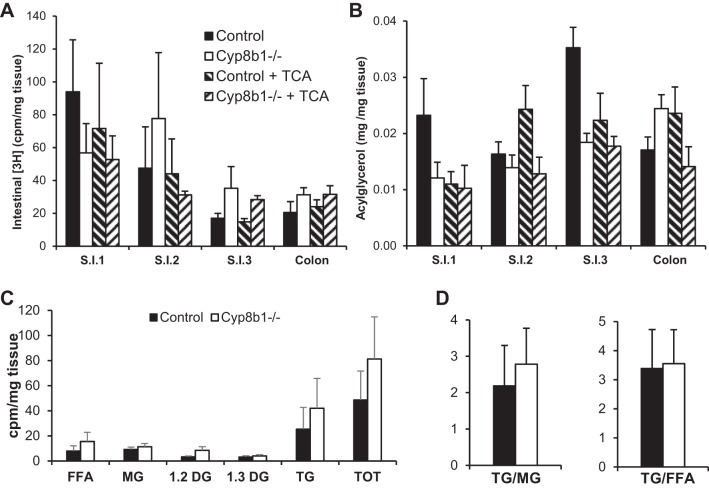
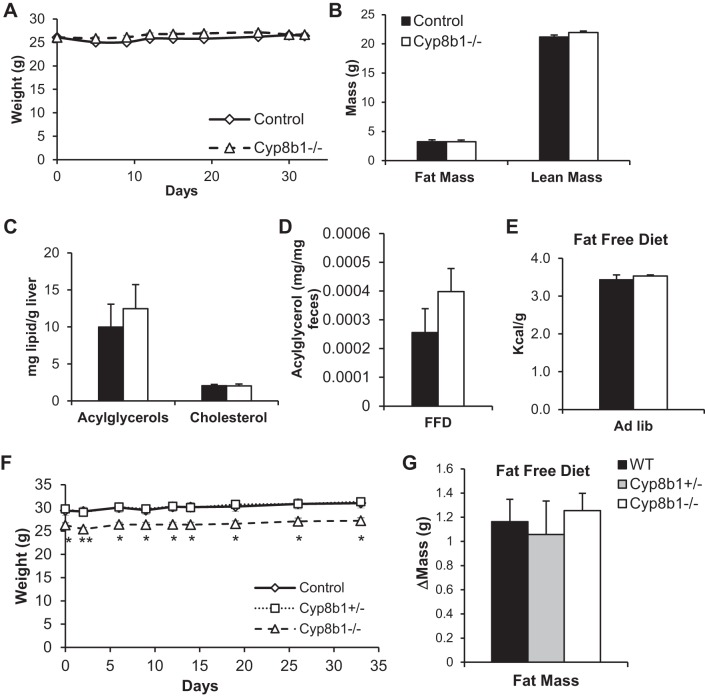
Bile acids (BAs) are cholesterol derivatives that regulate lipid metabolism, through their dual abilities to promote lipid absorption and activate BA receptors. However, different BA species have varying abilities to perform these functions. Eliminating 12α-hydroxy BAs in mice via Cyp8b1 knockout causes low body weight and improved glucose tolerance. The goal of this study was to determine mechanisms of low body weight in Cyp8b1-/- mice. We challenged Cyp8b1-/- mice with a Western-type diet and assessed body weight and composition. We measured energy expenditure, fecal calories, and lipid absorption and performed lipidomic studies on feces and intestine. We investigated the requirement for dietary fat in the phenotype using a fat-free diet. Cyp8b1-/- mice were resistant to Western diet-induced body weight gain, hepatic steatosis, and insulin resistance. These changes were associated with increased fecal calories, due to malabsorption of hydrolyzed dietary triglycerides. This was reversed by treating the mice with taurocholic acid, the major 12α-hydroxylated BA species. The improvements in body weight and steatosis were normalized by feeding mice a fat-free diet. The effects of BA composition on intestinal lipid handling are important for whole body energy homeostasis. Thus modulating BA composition is a potential tool for obesity or diabetes therapy.

Keywords: bile acids; diabetes; lipid absorption; obesity; triglyceride.


Figures

Fig. 1.
Fig. 1.
Cyp8b1 expression and bile acid quantitation. A: liver gene expression of Cyp8b1. B: absolute quantitation of the total bile acid pool. 12-Hydroxylated bile acids are colored in shades of blue. Non-12-hydroxylated bile acids are colored in shades of red. C: relative bile acid pool composition. D: ratio of 12-hydroxylated to non-12-hydroxylated bile acids. *P < 0.05, **P < 0.01, ***P < 0.001, ****P < 0.0001 between indicated groups. aaP < 0.01, aaaP < 0.001, aaaaP < 0.0001 compared with control; bbbbP < 0.0001 compared with heterozygous. Symbols in blue show statistics for comparisons of 12-hydroxylated bile acids. Symbols in red show statistics for comparisons of non-12-hydroxylated bile acids. DCA, deoxycholic acid; TCDCA, taurochenodeoxycholic acid; TMCA, tauro-α- and tauro-β-muricholic acid.
Fig. 2.
Fig. 2.
Body weight, mass composition, and glucose tolerance. A: body weight of mice on chow diet. B: body weight curve on Western-type diet (WTD). C: body mass composition at the beginning (t0) and after 4-wk WTD feeding. D: change in mass due to WTD. E and F: plasma insulin and glucose after an overnight fast. G: hepatic content of glycogen after 4-h refeeding WTD. H and I: oral glucose tolerance test and area under the curve (AUC). Values are displayed as means ± SE; n = 7. For acylglycerols and cholesterol, values were averaged from two technical replicates. Statistical significance is represented as *P < 0.05, **P < 0.01 measured by one-way ANOVA. For B, we used ANOVA with repeated measures.
Fig. 3.
Fig. 3.
Hepatic and circulating lipids. AC: hepatic acylglycerols and cholesterol during chow and WTD feeding and Oil Red O staining of frozen livers. Scale bar is 200 μm. D and E: plasma levels of cholesterol and acylglycerols in the ad libitum fed and overnight fasted state. Values are displayed as means ± SE; n = 7. For cholesterol and acylglycerols, results are averaged from two technical replicates. Statistical significance is represented as ****P < 0.0001 Cyp8b1+/− vs. control, measured by one-way ANOVA.
Fig. 4.
Fig. 4.
Energy expenditure and fecal caloric output. AD: indirect calorimetry measurement of heat production, respiratory exchange ratio (RER), volume of oxygen consumed (V̇o2), and locomotor activity. E: 24-h food intake on WTD. F: quantification of heat production per gram of body weight. Values are displayed as means ± SE; n = 8; ad-lib, ad libitum.
Fig. 5.
Fig. 5.
Fecal caloric output. A and B: fecal caloric content from chow- and WTD-fed mice, as measured by bomb calorimetry. C and D: fecal mass output from chow- and WTD-fed mice collected over a 24-h period. Values are displayed as means ± SE; n = 8. Values were averaged from two technical replicates. Statistical significance is shown as *P < 0.05, measured by two-way ANOVA.
Fig. 6.
Fig. 6.
Lipidomic analysis. A and B: heat maps representing the ratio of Cyp8b1−/− mice to littermate controls for lipid species in intestinal tissue and feces. Triacylglycerol, diacylglycerol, and monoacylglycerol (TG, DG, and MG; A) and free fatty acids (B). C and D: quantitation of lipid species in feces (n = 8). L.I., large intestine; S.I., small intestine.
Fig. 7.
Fig. 7.
Lipid absorption. A: plasma [3H]triolein-derived counts [counts/min (cpm)] in untreated (left) and TCA-treated mice (right). B: [3H] counts in feces and colon contents (cpm/mg). C: total acylglycerols (AG) in feces and colon contents. D: triolein-derived [3H] counts in lipid species separated by thin layer chromatography. Here, n = 6. Statistical significance is represented as **P < 0.01, measured by one-way ANOVA. TOT, total.
Fig. 8.
Fig. 8.
Lipid accumulation in the enterocytes. A: triolein-derived [3H] in intestinal wall (cpm/mg). B: total acylglycerols in intestine. C: triolein-derived counts in lipid species separated by thin layer chromatography in jejunum (cpm/mg). D: ratio of TG to MG and TG to FFA. Here, n = 6.
Fig. 9.
Fig. 9.
Fat-free diet feeding. A: body weight curves of mice on fat-free diet, for mice starting at the same body weight. BE show measurements from these mice. B: body mass composition after 3-wk FFD feeding. C: hepatic levels of acylglycerols and cholesterol. D: levels of fecal acylglycerols. E: fecal caloric content from mice fed FFD, ad libitum. F: body weight curve of mice on FFD. G: fat mass gain after 4 wk of FFD feeding, for same mice shown in F. Values are displayed as mean ± SE; n = 6. Statistical significance is represented as *P < 0.05, **P < 0.01, Cyp8b1−/− vs. control, measured by one-way ANOVA. WT, wild type.

References

    1. Ables GP, Yang KJ, Vogel S, Hernandez-Ono A, Yu S, Yuen JJ, Birtles S, Buckett LK, Turnbull AV, Goldberg IJ, Blaner WS, Huang LS, Ginsberg HN. Intestinal DGAT1 deficiency reduces postprandial triglyceride and retinyl ester excursions by inhibiting chylomicron secretion and delaying gastric emptying. J Lipid Res 53: 2364–2379, 2012. doi:10.1194/jlr.M029041. - DOI - PMC - PubMed
    1. Akiyoshi T, Uchida K, Takase H, Nomura Y, Takeuchi N. Cholesterol gallstones in alloxan-diabetic mice. J Lipid Res 27: 915–924, 1986. - PubMed
    1. Biddinger SB, Haas JT, Yu BB, Bezy O, Jing E, Zhang W, Unterman TG, Carey MC, Kahn CR. Hepatic insulin resistance directly promotes formation of cholesterol gallstones. Nat Med 14: 778–782, 2008. doi:10.1038/nm1785. - DOI - PMC - PubMed
    1. Bonde Y, Eggertsen G, Rudling M. Mice abundant in muricholic bile acids show resistance to dietary induced steatosis, weight gain, and to impaired glucose metabolism. PLoS One 11: e0147772, 2016. doi:10.1371/journal.pone.0147772. - DOI - PMC - PubMed
    1. Borgstroem B. Influence of bile salt, pH, and time on the action of pancreatic lipase; physiological implications. J Lipid Res 5: 522–531, 1964. - PubMed

Publication types