. 2017 Jun 1;77(11):3070-3081.
doi: 10.1158/0008-5472.CAN-15-3052. Epub 2017 Apr 4.

Combination Therapy Targeting BCL6 and Phospho-STAT3 Defeats Intratumor Heterogeneity in a Subset of Non-Small Cell Lung Cancers

Affiliations

Combination Therapy Targeting BCL6 and Phospho-STAT3 Defeats Intratumor Heterogeneity in a Subset of Non-Small Cell Lung Cancers

Dhruba Deb et al. Cancer Res. .

Abstract

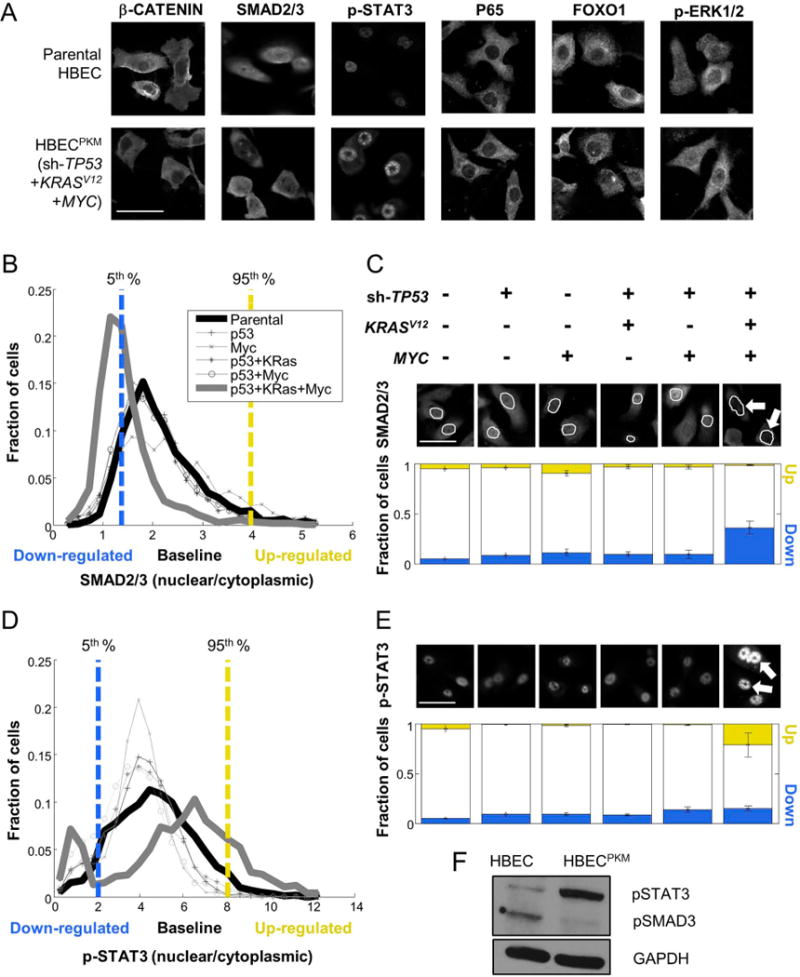
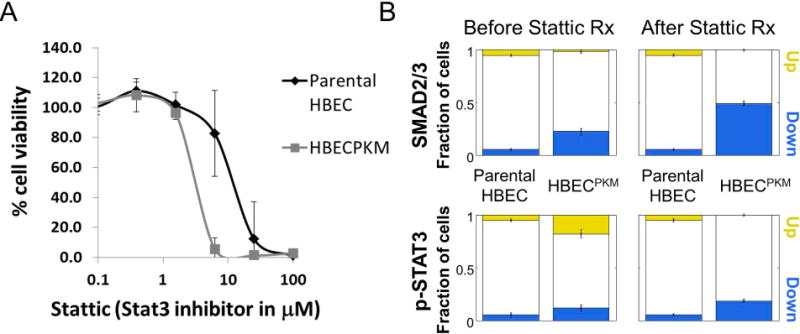
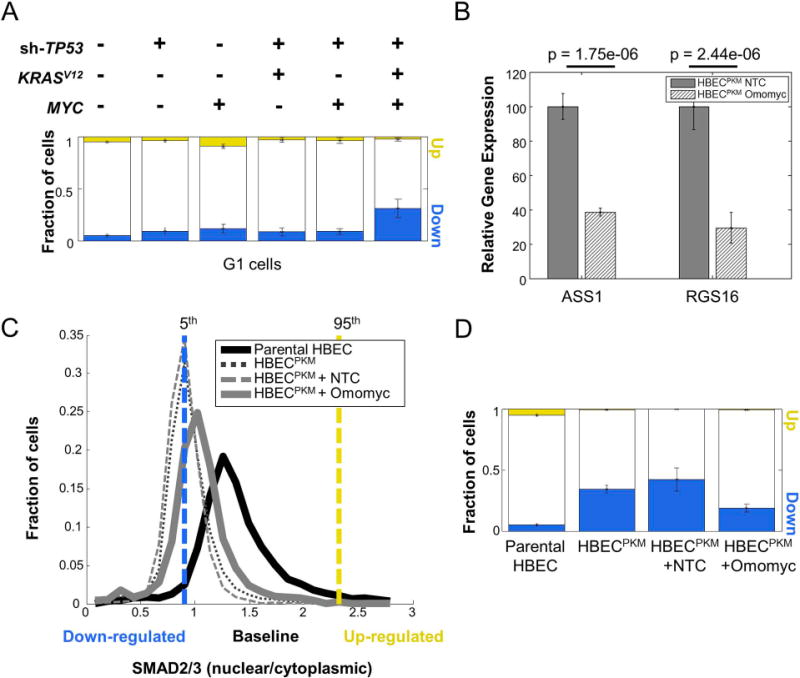
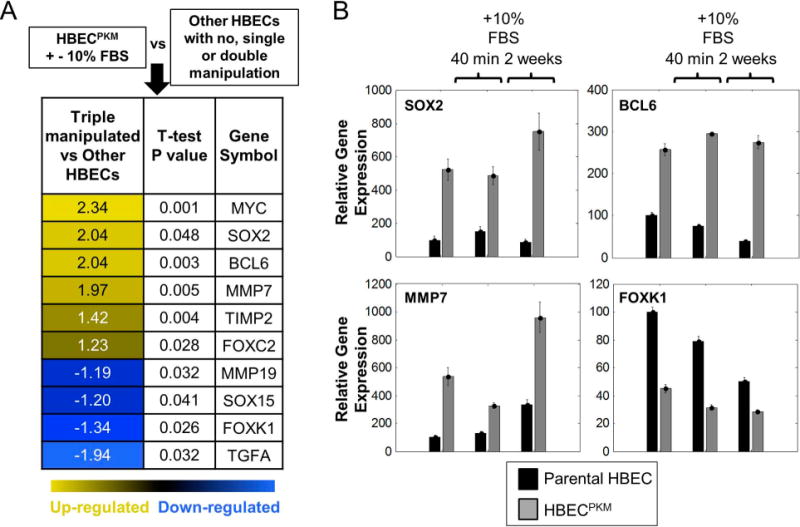
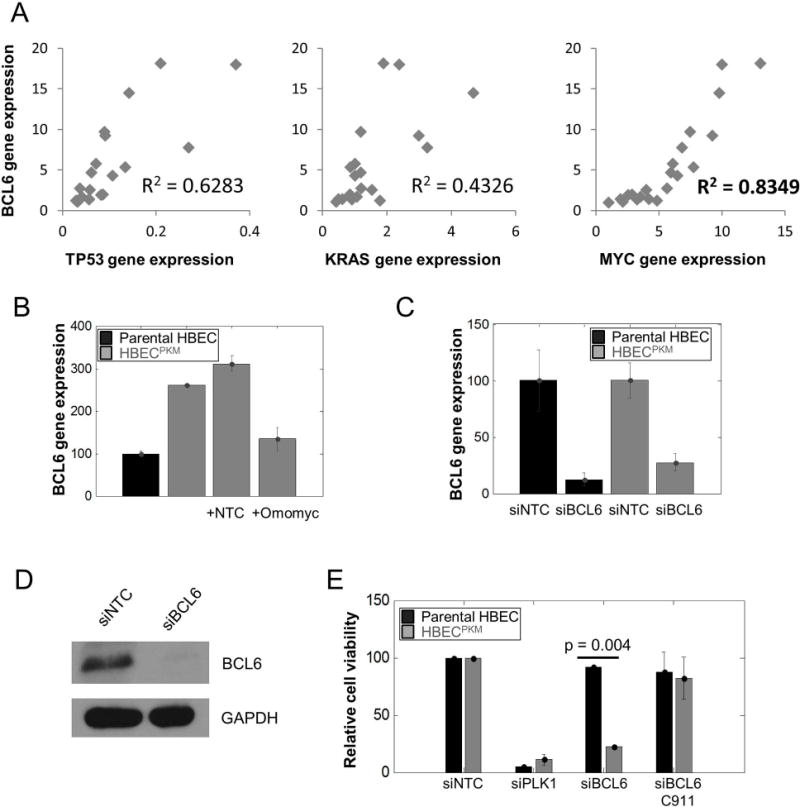
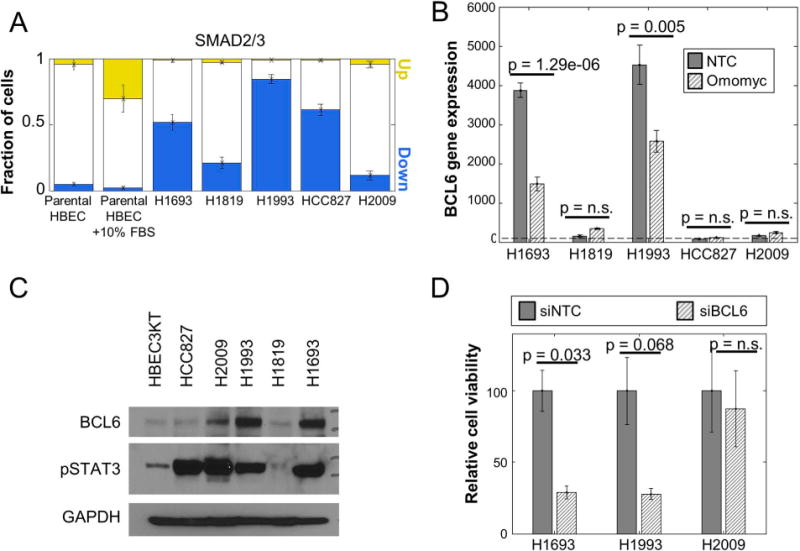
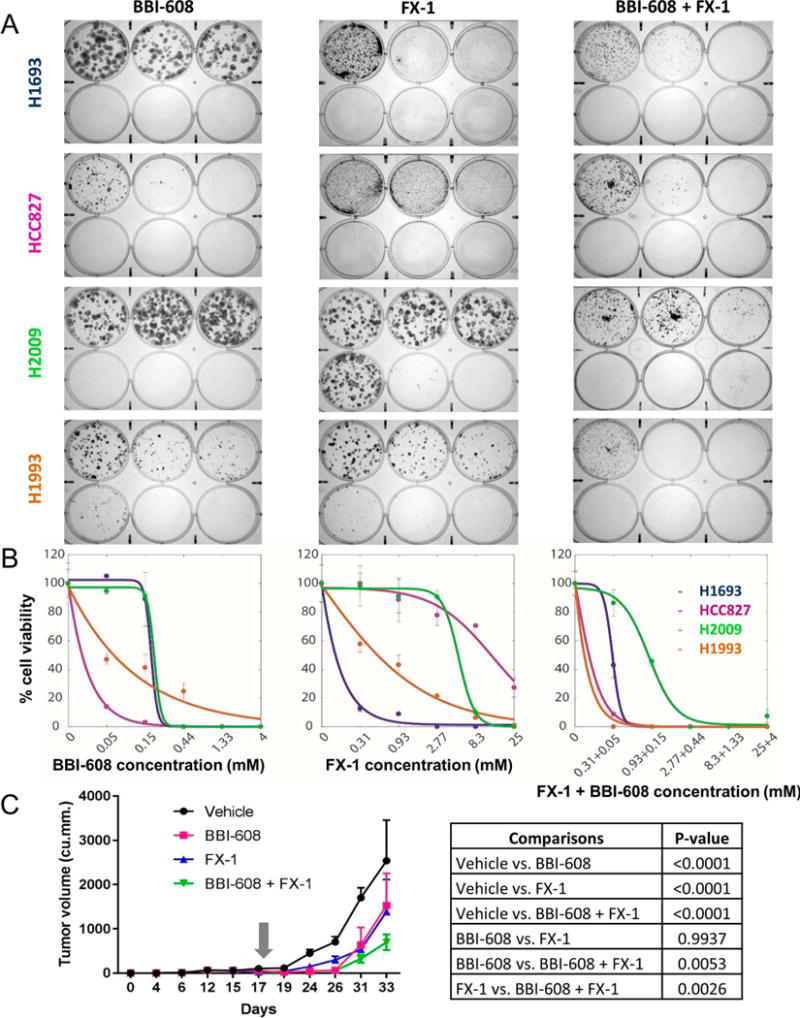
Oncogene-specific changes in cellular signaling have been widely observed in lung cancer. Here, we investigated how these alterations could affect signaling heterogeneity and suggest novel therapeutic strategies. We compared signaling changes across six human bronchial epithelial cell (HBEC) strains that were systematically transformed with various combinations of TP53, KRAS, and MYC-oncogenic alterations commonly found in non-small cell lung cancer (NSCLC). We interrogated at single-cell resolution how these alterations could affect classic readouts (β-CATENIN, SMAD2/3, phospho-STAT3, P65, FOXO1, and phospho-ERK1/2) of key pathways commonly affected in NSCLC. All three oncogenic alterations were required concurrently to observe significant signaling changes, and significant heterogeneity arose in this condition. Unexpectedly, we found two mutually exclusive altered subpopulations: one with STAT3 upregulation and another with SMAD2/3 downregulation. Treatment with a STAT3 inhibitor eliminated the upregulated STAT3 subpopulation, but left a large surviving subpopulation with downregulated SMAD2/3. A bioinformatics search identified BCL6, a gene downstream of SMAD2/3, as a novel pharmacologically accessible target of our transformed HBECs. Combination treatment with STAT3 and BCL6 inhibitors across a panel of NSCLC cell lines and in xenografted tumors significantly reduced tumor cell growth. We conclude that BCL6 is a new therapeutic target in NSCLC and combination therapy that targets multiple vulnerabilities (STAT3 and BCL6) downstream of common oncogenes, and tumor suppressors may provide a potent way to defeat intratumor heterogeneity. Cancer Res; 77(11); 3070-81. ©2017 AACR.


Conflict of interest statement

Conflict of interest: The authors disclose no potential conflicts of interest.

Figures

Figure 1
Figure 1. Oncogenically transformed HBECPKM cells reveal significant alterations in SMAD2/3 and STAT3 signaling
A. Immunofluorescence (IF) images of parental and HBECPKM with antibodies against β-CATENIN, SMAD2/3, p-STAT3, P65, FOXO1, p-ERK1/2 (scale bar = 50 μm). B. Definition of downregulated (blue), baseline and upregulated (yellow) fraction of cells in SMAD2/3 signaling in oncogenically manipulated HBECs compared to the parental HBEC. For each cell line, shown are the single cell distributions of nuclear to cytoplasmic SMAD2/3 intensity. The vertical lines denote 5th (blue) and 95th (yellow) percentiles of the parental HBEC distribution. Cells below and above these lines are considered down-regulated and up-regulated respectively. C. Quantification of signaling alteration for total SMAD2/3 in parental and oncogenically manipulated HBECs. Top: Shown are the oncogenic manipulations performed on each cell line. Middle: Sample IF images with antibodies against SMAD2/3, with cell nuclei outlined in white. The white arrows point to lower SMAD2/3 in the nuclei of HBECPKM cells. Bottom: For each cell line, blue and yellow bars indicate the fraction of up-regulated (“up”) and down-regulated (“down”) cells. Error bars represent standard deviations (n = 8 technical replicates) for fractions of altered subpopulation measured across technical replicate wells. D–E. As in (B-C) for p-STAT3 (n = 6 technical replicates). Growth conditions are as described in text. F. Western blot for parental HBEC and HBECPKM cells with antibodies against p-SMAD3, p-STAT3 and GAPDH (loading control).
Figure 2
Figure 2. STAT3 inhibitor diminishes the subpopulation of cells up-regulated in STAT3 signaling but leaves the subpopulation of cells down-regulated in SMAD2/3 signaling
A. MTS assay of parental HBEC and HBECPKM cells for their response to STAT3 inhibitor Stattic. x-axis: concentration of Stattic in log scale; y-axis: percent viability, with 100% corresponding to DMSO control conditions for each respective cell line. Error bars represent standard deviation (n = 8 technical replicates). Solid curves were constructed using a sigmoidal curve fit. B. Quantification of downregulated (blue) and upregulated (yellow) fraction of cells in SMAD2/3 and p-STAT3 signaling in HBECPKM cells (relative to parental HBEC) before and after Stattic treatment. Error bars as in Fig 1C (n = 6 technical replicates).
Figure 3
Figure 3. Down-regulation in SMAD2/3 signaling is oncogene-dependent
A. Single-cell quantification of altered fraction of cells across parental and oncogenically manipulated HBEC cell lines in G1 phase of cell cycle. Cells were computationally classified into various cell cycle phases based on their DNA intensity (5). For each step in the oncogenic progression, only cells belonging to the G1 phase were considered. SMAD2/3 signaling alteration was calculated as in Fig. 1C (n = 8 technical replicates). B. qRT-PCR analysis of well-known MYC target genes (ASS1, RGS16) in HBECPKM cells with Non-target control (NTC) and Omomyc construct. The expression of each gene in HBECPKM cells with Omomyc construct is normalized to its expression in HBECPKM cells with NTC. Error bars represent standard deviation (n = 6 technical replicates); p-values are computed using a two-sided t-test. C. Effect of MYC knockdown on SMAD2/3 signaling. Shown are the single-cell distributions of SMAD2/3 signaling (as in Fig. 1B) for HBECPKM (black dotted line), HBECPKM with non-target control vector (grey dashed line), HBECPKM with Omomyc vector (solid grey line), compared to parental HBEC (solid black line). The vertical lines denote 5th (blue) and 95th (yellow) percentiles of the parental HBEC distribution. Cells below and above these lines are considered down-regulated and up-regulated respectively. Results are obtained from pooling wells (n = 6 technical replicates). D. Quantification of SMAD2/3 signaling heterogeneity showing fraction of upregulated (yellow) and downregulated (blue) cells, in HBECPKM, with non-target control and Omomyc construct. Error bars as in Fig. 1C (n = 6 technical replicates).
Figure 4
Figure 4. Alterations in SMAD2/3 downstream genes may reveal novel targetable vulnerabilities
A. mRNA expression analysis of TGFβ downstream genes using microarray. HBECPKM cells grown in presence and absence of 10% FBS is in one group. Other HBECs (with no, single or double manipulations) are in the second group. Only differentially and significantly altered (two-sided t-test, p-value < 0.05) genes are shown. Numbers in the first column represent fold change (Log2) between the median level of gene expression of HBECPKM and other HBECs. B. mRNA expression analysis of top 3 upregulated genes (SOX2, BCL6, MMP7) in HBECPKM cells using qRT-PCR. FOXK1 is used as an example of a downregulated gene in HBECPKM. Parental HBEC (black) or HBECPKM (grey) were grown in defined, serum-free growth condition, in 10% FBS treatment for 40 minutes or in 10% FBS treatment for 2 weeks. y-axis: gene expression relative to human reference (Methods). Error bars represent standard error (n = 6 technical replicates).
Figure 5
Figure 5. BCL6 is a targetable vulnerability in HBECPKM cells
A. Correlation of relative BCL6 gene expression and TP53, K-RAS and MYC gene expression in 20 single-cell clonal populations of HBECPKM using qRT-PCR. The coefficients of determination R2 (0.6283, 0.4326 and 0.8466 respectively) for simple linear regression as shown. B. qRT-PCR of BCL6 gene expression for (left to right): parental HBEC (black), HBECPKM, HBECPKM transfected with non-target control (NTC) and HBECPKM transfected with Omomyc construct. Error bars are as in Fig. 3B (n = 2 technical replicates); normalization is with respect to the parental HBEC. C. Confirmation of BCL6 knockdown based on gene expression. Relative BCL6 gene expression using qRT-PCR for (left to right): parental HBEC transfected with non- target control, parental HBEC transfected with siRNA against BCL6, HBECPKM transfected with non-target control and HBECPKM transfected with siRNA against BCL6. Error bars are as in Fig. 3B (n = 6 technical replicates); the expression of BCL6 in each cell line with siBCL6 is normalized to BCL6 expression with siNTC. D. Confirmation of BCL6 knockdown based on protein expression. Western blot showing BCL6 protein expression in HBECPKM transfected with non-target control and siRNA against BCL6 E. Effect of BCL6 knockdown on cell viability for parental HBEC and HBECPKM transfected with (left to right): non-target control, siRNA against PLK1 (positive toxic control), siRNA against BCL6, and C911 control for siBCL6. Error bars represent standard error (n = 2 technical replicates) and p-values are calculated using a two sided t-test.
Figure 6
Figure 6. BCL6 in a targetable vulnerability in a subset of NSCLC cell lines
A. Quantitation of the fraction of cells with altered SMAD2/3 signaling in NSCLC cell lines H1693, H1819, H1993, HCC827 and H2009 compared to parental HBEC and parental HBEC treated with 10% FBS for 40 minutes (positive control) based on immunofluorescence microscopy. Error bars (n = 7 technical replicates) as in Fig. 1C. B. Relative BCL6 gene expression from qRT-PCR assay of NSCLC cell lines transfected with non-target control and Omomyc construct compared to the level in parental HBEC (horizontal dotted line). Error bars and p-values are as in Fig. 3B (n = 6 technical replicates). C. Protein expression of BCL6 and phospho-STAT3 in NSCLC cell lines H1693, H1819, H1993, HCC827 and H2009 compared to parental HBEC as measured by western blot. GAPDH is used as a loading control. D. Relative viability of NSCLC cell lines H1693 and H1993 compared to H2009 after siRNA mediated BCL6 knockdown. Error bars and p-values are as in Fig. 3B (n = 2 technical replicates).
Figure 7
Figure 7. In vitro or in vivo combination treatment with BCL6 and STAT3 inhibitors eliminates more cancer cells than single agent treatments
A. Liquid colony formation assay of four NSCLC cell lines H1693, HCC827, H2009 and H1993 with their responses to STAT3 inhibitor, BBI-608 alone (left), FX-1 alone (middle) and the combination treatment (right). Image shows crystal violet stained colonies after 2 weeks of drug treatment. For both single agent and combination treatments, BBI-608 concentration (mM) ranges in the six well plates are 0, 0.05, and 0.15 (top row left to right), and 0.44, 1.33 and 4 (bottom row left to right). FX-1 concentration (mM) ranges in the six well plates are 0, 0.31, and 0.93 (top row left to right), and 2.77, 8.3 and 25 (bottom row left to right). B. Quantification of liquid colony formation assay of four NSCLC cell lines H1693, HCC827, H2009 and H1993 to BBI-608 alone (left), FX-1 alone (middle) and the combination treatment (right). The number of colonies in each experimental condition were normalized to vehicle controls. Error bars represent standard deviation (n=8 technical replicates). Solid curves were constructed using a sigmoidal curve fit. C.Volume of H1993 cell line derived subcutaneous, xenografted tumors measured (1/2*length*width*width) and averaged in each of the 4 treatment groups (vehicle, BBI-608 alone, FX-1 alone and BBI-608+FX-1 combination) over time. BBI-608 was administered at 20 mg/kg. FX-1 was administered at 25 mg/kg. Gray arrow represents the start day of treatment. P-values are calculated by two way Anova with Tukey’s multiple comparison test. Error bars represent standard deviation (n = 10 technical replicates).

References

    1. Lauro S, Onesti CE, Righini R, Marchetti P. The use of bevacizumab in non-small cell lung cancer: an update. Anticancer research. 2014;34:1537–45. - PubMed
    1. Larsen JE, Minna JD. Molecular biology of lung cancer: clinical implications. Clinics in chest medicine. 2011;32:703–40. - PMC - PubMed
    1. Devarakonda S, Morgensztern D, Govindan R. Genomic alterations in lung adenocarcinoma. The Lancet Oncology. 2015;16:e342–51. - PubMed
    1. Kim HS, Mendiratta S, Kim J, Pecot CV, Larsen JE, Zubovych I, et al. Systematic identification of molecular subtype-selective vulnerabilities in non-small-cell lung cancer. Cell. 2013;155:552–66. - PMC - PubMed
    1. Singh DK, Ku CJ, Wichaidit C, Steininger RJ, 3rd, Wu LF, Altschuler SJ. Patterns of basal signaling heterogeneity can distinguish cellular populations with different drug sensitivities. Molecular systems biology. 2010;6:369. - PMC - PubMed

Publication types

MeSH terms

Substances