

STARD3 mediates endoplasmic reticulum-to-endosome cholesterol transport at membrane contact sites
- PMID: 28377464
- PMCID: PMC5430228
- DOI: 10.15252/embj.201695917
STARD3 mediates endoplasmic reticulum-to-endosome cholesterol transport at membrane contact sites
Abstract
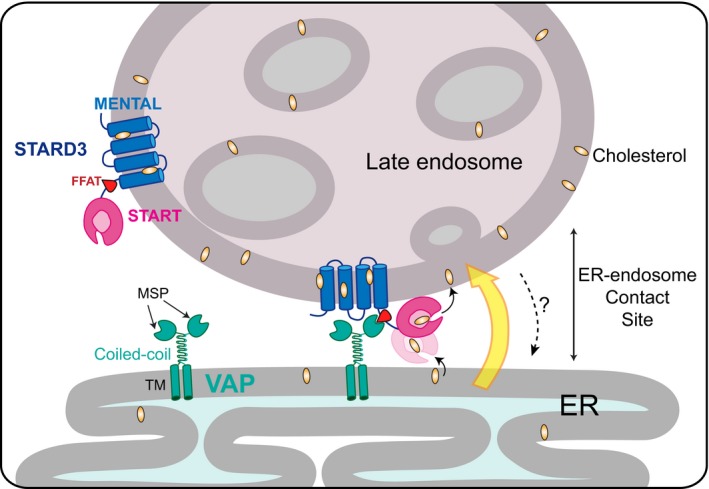
StAR-related lipid transfer domain-3 (STARD3) is a sterol-binding protein that creates endoplasmic reticulum (ER)-endosome contact sites. How this protein, at the crossroad between sterol uptake and synthesis pathways, impacts the intracellular distribution of this lipid was ill-defined. Here, by using in situ cholesterol labeling and quantification, we demonstrated that STARD3 induces cholesterol accumulation in endosomes at the expense of the plasma membrane. STARD3-mediated cholesterol routing depends both on its lipid transfer activity and its ability to create ER-endosome contacts. Corroborating this, in vitro reconstitution assays indicated that STARD3 and its ER-anchored partner, Vesicle-associated membrane protein-associated protein (VAP), assemble into a machine that allows a highly efficient transport of cholesterol within membrane contacts. Thus, STARD3 is a cholesterol transporter scaffolding ER-endosome contacts and modulating cellular cholesterol repartition by delivering cholesterol to endosomes.
Keywords: cholesterol; endoplasmic reticulum; endosome; lipid transfer protein; membrane contact site.
© 2017 The Authors. Published under the terms of the CC BY NC ND 4.0 license.
Figures
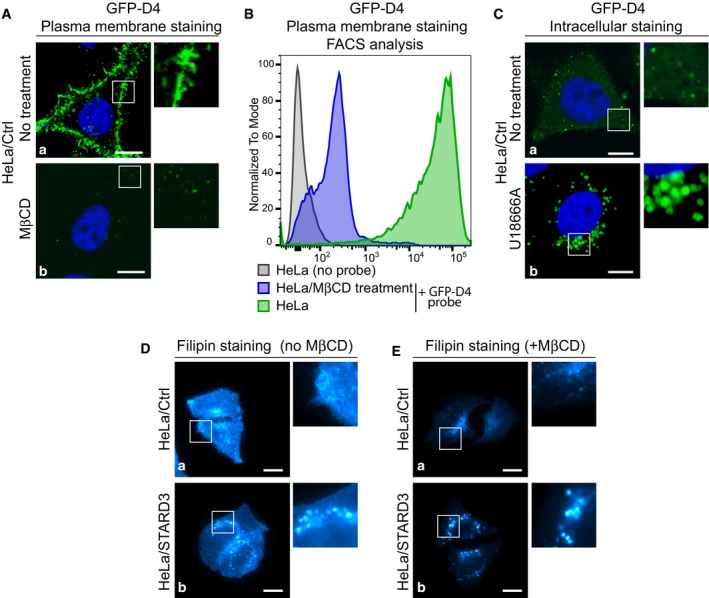
Plasma membrane cholesterol staining with the GFP‐D4 probe. Live HeLa/Ctrl cells were left untreated (a) or treated with MβCD (b) to remove plasma membrane cholesterol (10 mM in serum‐free medium; 30 min at 37°C), and incubated with GFP‐D4 prior to fixation and nucleus staining (blue). GFP‐D4 highly stained the plasma membrane of untreated cells (a), while almost no staining was present on MβCD‐treated cells (b).
Analysis by flow cytometry of plasma cholesterol membrane staining with the GFP‐D4 probe. HeLa cells were either left untreated and unstained (HeLa/no probe), untreated (HeLa + GFP‐D4 probe) or treated with MβCD (HeLa/MβCD treatment + GFP‐D4 probe), and next stained; cells were then analyzed by flow cytometry. These representative histograms display the number of cells analyzed (normalized to mode) as a function of GFP‐D4 fluorescence (log intensity). Note that HeLa cells are strongly labeled with the GFP‐D4 probe; MβCD treatment prior to labeling strongly decreases GFP‐D4 signal intensity.
Intracellular cholesterol staining with GFP‐D4. HeLa/Ctrl cells were left untreated (a) or treated with U18666A (1 μg/ml; 1 h at 37°C) to promote intracellular cholesterol accumulation (b). After fixation, cells were permeabilized by freezing in liquid nitrogen and incubated with GFP‐D4. Untreated cells (a) were labeled on small discrete structures by the GFP‐D4 probe; in U18666A‐treated cells (b), cholesterol‐filled endosomes were strongly labeled by the GFP‐D4 probe.
Whole‐cell cholesterol staining with filipin on fixed HeLa/Ctrl (a) and HeLa/STARD3 (b) cells. Filipin stains cholesterol in the plasma membrane and in intracellular compartments. Note that HeLa/STARD3 cells display intracellular puncta of filipin staining.
Intracellular cholesterol staining with filipin. Live HeLa/Ctrl (a) and HeLa/STARD3 (b) cells were treated with MβCD (10 mM in serum‐free medium; 30 min at 37°C) prior to fixation and filipin staining. MβCD treatment removed cholesterol from the plasma membrane and allowed a better visualization of intracellular cholesterol pools.
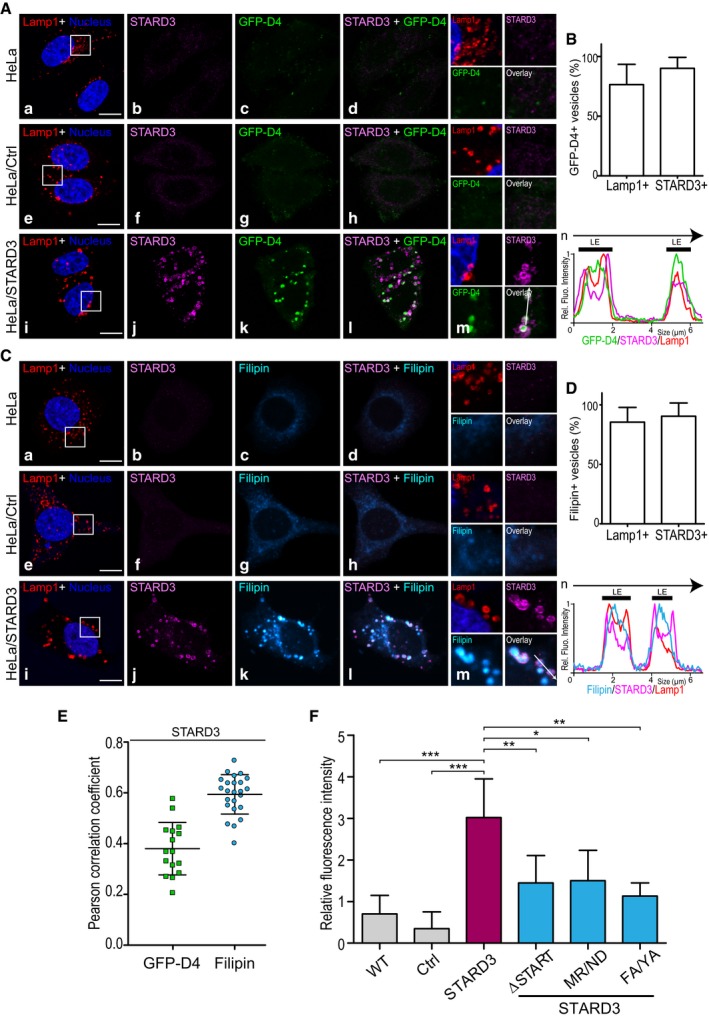
To follow cholesterol accumulation in late endosomes, HeLa (a–d), HeLa/Ctrl (e–h), and HeLa/STARD3 (i–l) cells were labeled with anti‐Lamp1 antibodies (red), anti‐STARD3 antibodies (magenta), and with the fluorescent cholesterol probe GFP‐D4 (green). Nuclei were stained in blue. Merged image of GFP‐D4 and STARD3 signals is shown in (d, h, and l). The subpanels on the right are higher magnification (2.5×) images of the area outlined in white (a, e, i). Overlay indicates GFP‐D4 and STARD3 merged image. (n) Linescan analyses with relative fluorescence intensities of the green, magenta, and red channels along the arrow in (m) (HeLa/STARD3 cell). Black thick lines indicate the positions of late endosomes (LE).
Colocalization between GFP‐D4‐positive vesicles and Lamp1 and STARD3 was quantified in HeLa/STARD3 cells (12 cells).
Filipin as a second method to follow cholesterol accumulation in late endosomes. HeLa (a–d), HeLa/Ctrl (e–h) and HeLa/STARD3 (i–l) cells were labeled with anti‐Lamp1 antibodies (red), anti‐STARD3 antibodies (magenta), and with the fluorescent cholesterol probe filipin (Cyan Hot). Nuclei are stained in blue. Merged image of filipin and STARD3 signals is shown in (d, h and l). Shown on the right are higher magnification (2.5×) images of the area outlined in white (a, e, i). The filipin and STARD3 merged image is labeled Overlay. (n) Linescan analyses with relative fluorescence intensities of the cyan, magenta, and red channels along the arrow in (m) (HeLa/STARD3 cell). Black thick lines indicate the positions of late endosomes.
Colocalization between filipin‐positive vesicles and Lamp1 and STARD3 was quantified in HeLa/STARD3 cells (10 cells).
Pearson correlation coefficients between STARD3 and GFP‐D4 (left) or filipin (right) staining are shown. Each dot represents a single cell (GFP‐D4: 16 cells; filipin: 24 cells; from three independent experiments).
Relative fluorescence intensity of intracellular filipin signals in HeLa, HeLa/Ctrl, HeLa/STARD3, HeLa/STARD3 ΔSTART, HeLa/STARD3 MR/ND, and HeLa/STARD3 FA/YA cells. n: number of independent experiments. HeLa, HeLa/Ctrl, HeLa/STARD3, HeLa/STARD3 ΔSTART: n = 6; HeLa/STARD3 MR/ND and HeLa/STARD3 FA/YA: n = 3. Total number of cells analyzed: HeLa: 309; HeLa/Ctrl: 234; HeLa/STARD3: 295; HeLa/STARD3 ΔSTART: 238; HeLa/STARD3 MR/ND: 116 and HeLa/STARD3 FA/YA: 137. Number of cells analyzed per sample per experiment ≥ 32.
- A
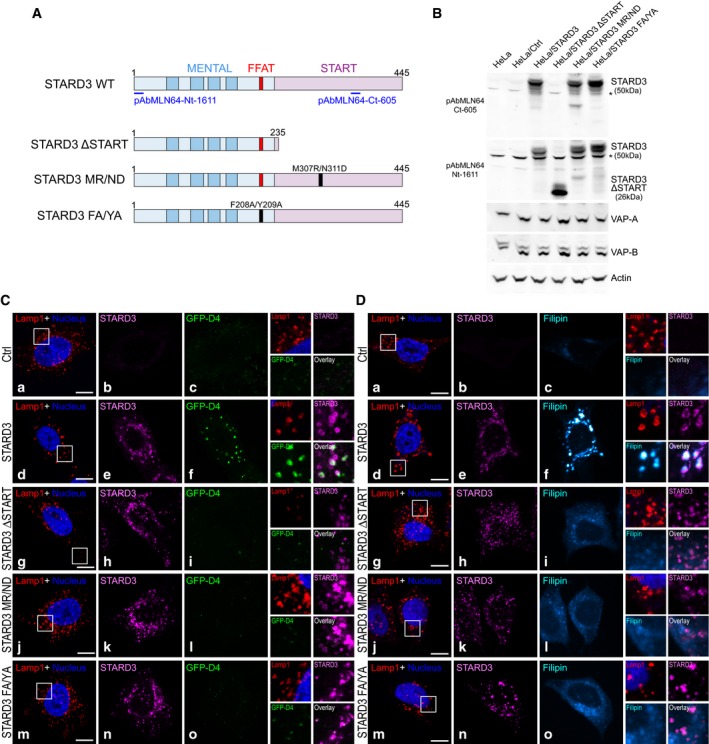
Schematic representation of the different STARD3 mutants used in the study. The MENTAL domain in light blue contains 4 transmembrane helices (dark blue) and a FFAT motif (red); the START domain in pink contains two essential residues involved in cholesterol binding (M307 and N311). Positions of the epitopes recognized by the rabbit polyclonal pAbMLN64‐Nt‐1611 and pAbMLN64‐Ct‐605 antibodies are shown. Point mutation positions are labeled in black.
- B
Western blot analysis of STARD3 expression in the different cell lines. The expression of VAP proteins is unchanged; actin was used as a loading control. *: unspecific band.
- C, D
To mark cholesterol accumulation in endosomes, HeLa/Ctrl (a–c), HeLa/STARD3 (d–f), HeLa/STARD3 ΔSTART (g–i), HeLa/STARD3 MR/ND (j–l), and HeLa/STARD3 FA/YA (m–o) were labeled with anti‐Lamp1 antibodies (red), anti‐STARD3 antibodies (magenta), and with the fluorescent cholesterol probe GFP‐D4 (C: green) or filipin (D: Cyan Hot). Nuclei are stained in blue. Higher magnification (2.5×) images of the area outlined in white (a, d, g, j, m) are shown on the right. The GFP‐D4 and STARD3 merged image (C) and the filipin and STARD3 merged image (D) are labeled Overlay.
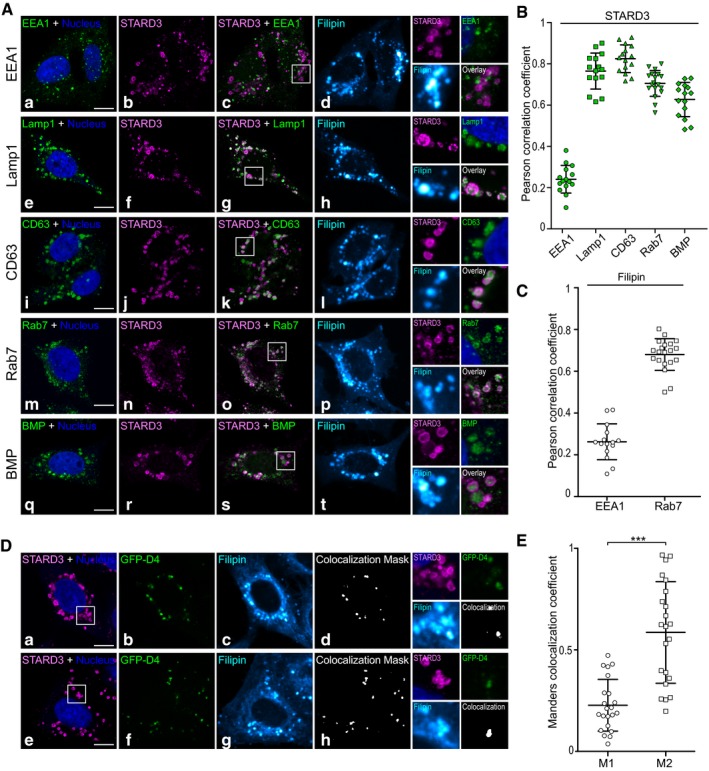
HeLa/STARD3 cells were co‐labeled with anti‐STARD3 (magenta), with the fluorescent cholesterol probe filipin (Cyan Hot) and with anti‐EEA1 (a–d, green), anti‐Lamp1 (e–h, green), anti‐CD63 (i–l, green), anti‐Rab7 (m–p, green), or anti‐BMP (q–t, green) antibodies. Nuclei were stained in blue. Merged image of magenta and green signals is shown in (c, g, k, o, and s). The subpanels on the right are higher magnification (2.6×) images of the area outlined in white (c, g, k, o, s). Overlays show STARD3 and the endocytic markers merged images. Scale bars: 10 μm.
Pearson correlation coefficients between STARD3 and the endocytic markers EEA1, Lamp1, CD63, Rab7, and BMP are shown; each dot represents one single cell; cells originates from three independent experiments (15 cells). The horizontal lines show the mean ± SD.
Pearson correlation coefficients between filipin and the early endosome marker EEA1 (left) and with the late endosome marker Rab7 (right). Each dot represents one single cell (left 15 cells, right: 20 cells); cells originate from three independent experiments. The horizontal lines show the mean ± SD.
HeLa/STARD3 cells were co‐stained with two fluorescent cholesterol probes (GFP‐D4 in green and filipin in Cyan Hot) and with anti‐STARD3 (magenta). Two similar cells are shown (bottom and top). Nuclei were stained in blue. (d, h) Pixels where the green and the Cyan Hot channels co‐localize are shown in white. The subpanels on the right are higher magnification (2.6×) images of the area outlined in white (a, e). Scale bars: 10 μm.
Mander's correlation coefficients between filipin and GFP‐D4 are shown; each dot represents one single cell acquired from three independent experiments (22 cells). M1 corresponds to the fraction of filipin signal overlapping with GFP‐D4 signal. M2 corresponds to the fraction of GFP‐D4 signal overlapping with filipin signal. GFP‐D4‐labeled structures are strongly labeled with filipin, while filipin‐positive structures can be GFP‐D4 positive or GFP‐D4 negative. This illustrates the different properties of the two cholesterol probes: While filipin binds to all free cholesterol, GFP‐D4 only binds to cholesterol‐rich membranes. The horizontal lines show the mean ± SD. Paired two‐tailed t‐test; ***P < 0.0001.
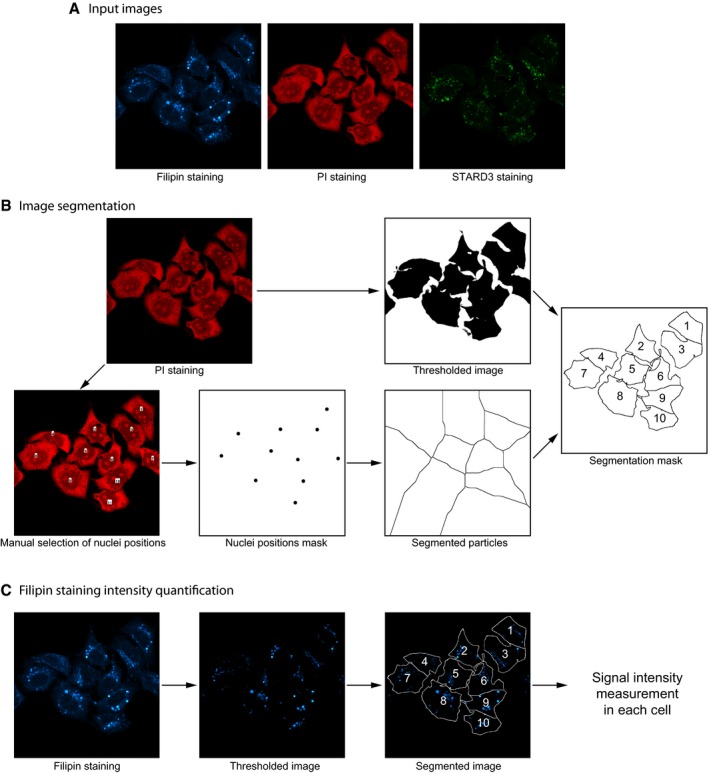
Fields containing about a dozen of cells labeled with filipin, anti‐STARD3, and propidium iodide (PI) were randomly acquired by confocal microscopy in three‐channel images.
Image analysis was performed with Fiji (
http://fiji.sc/ ). Image segmentation was performed on the PI staining image. An intensity threshold was applied to determine the cell contours. Nuclei positions, manually selected on the PI staining image, were used to divide the image into discrete areas with a watershed algorithm (Find maxima). Combination of the thresholded and the segmented particles images allowed to build a segmentation mask where individual cell contours could be determined.To quantify the filipin staining intensity, an intensity threshold was first applied on raw images. This threshold allowed to focus the analysis on filipin accumulation puncta. After applying the segmentation mask onto the filipin staining thresholded image, filipin staining intensity was measured in individual cells.
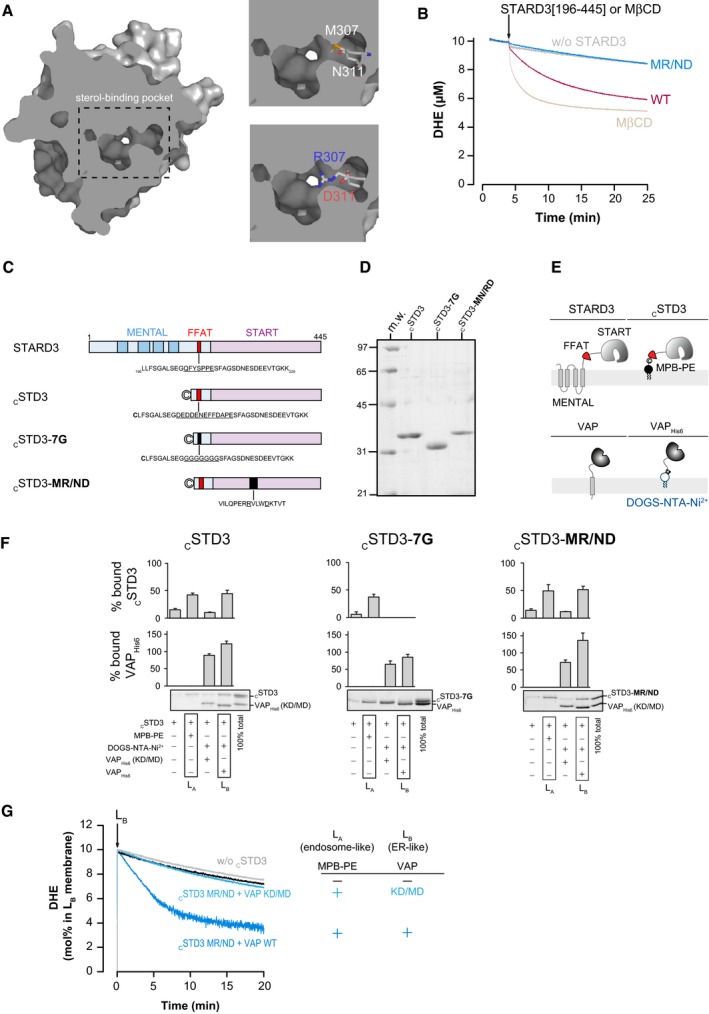
Structure of the START domain of STARD3 (PDB entry 1EM2). Top right image: M307 and N311 residues, which are localized in the sterol‐binding pocket, are shown in stick. Bottom right image: a mutated form of the START domain is shown with the M307R/N311D double mutation. Carbon atoms are shown in white, oxygen in red, nitrogen in blue, and thiol in yellow.
DHE transfer assay. DOPC liposomes (100 μM total lipids) containing 10 mol% DHE and 2.5 mol% DNS‐PE (donor) were mixed with a similar amount of DOPC liposome (acceptor) at 37°C. After 3 min, cSTD3 which corresponds to STARD3[196–445] (500 nM) or its mutated version (MR/ND) was injected. Negative and positive experiments are done in the absence of the protein and in the presence of 1 mM MβCD, respectively. The signal was converted into amount of DHE present in donor liposome (in μM). The slow decay observed without the protein (gray line) was due to spontaneous DHE transfer. The lipid binding mutant was totally deficient in cholesterol transport (blue line). The non‐mutated version is able to transfer sterol (magenta line). MβCD extracted sterol from donor liposomes (brown line).
Domain organization of STARD3 and description of the different cSTD3 recombinant proteins used in the study.
SDS–PAGE gel of purified cSTD3 constructs. The gel was stained with Sypro Orange to visualize proteins and molecular weight markers.
Position of cSTD3 and VAPHis6 with respect to the membrane compared to the respective cytosolic region of the full‐length proteins.
Flotation assays. cSTD3 (750 nM) was incubated with DOPC liposomes, doped or not with 3 mol% MPB‐PE (LA liposome), or with liposomes containing 2 mol% DOGS‐NTA‐Ni2+ (LB liposome) and decorated with VAPHis6 or VAP(KD/MD)His6. After centrifugation, the liposomes were recovered by centrifugation at the top of a sucrose cushion and analyzed by SDS–PAGE. The amount of protein recovered in the top fraction (lanes 1–4) was quantified, and the fraction of liposome‐bound cSTD3 and VAPHis6 as reported in the upper panels was determined by using the content of lane 5 (total 100%) as a reference. Mean ± SEM; n = 3 independent experiments (cSTD3 MR/ND and cSTD3 7G mutants) or 4 independent experiments (cSTD3).
DHE transport assay using mutant STARD3 MR/ND. DOPC liposomes (62.5 μM total lipids, LA) containing or not 3 mol% MPB‐PE were mixed with cSTD3‐MR/ND (475 nM). After 5 min, LB liposomes (DOPC/DOGS‐NTA‐Ni2+/DNS‐PE/DHE 85.5/2/2.5/10 mol/mol, 62.5 μM total lipids), naked or covered with 500 nM VAPHis6 (dark blue) or VAP(KD/MD)His6 (light blue), were added. It is noteworthy that connecting LA and LB liposomes is sufficient to induce some sterol transfer in the presence of mutated STARD3 (cSTD3 MR/ND) (dark blue). Possibly, a close apposition of membranes induced by the tethering allows a faster spontaneous sterol transfer.
- A–E
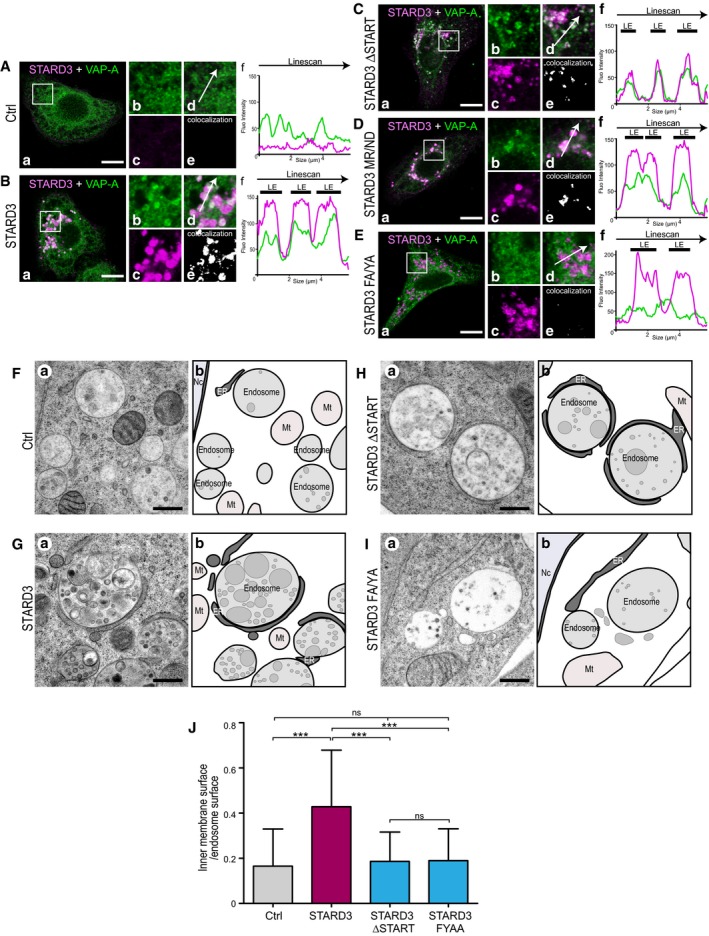
Hela/Ctrl (A), HeLa/STARD3 (B), HeLa/STARD3 ΔSTART (C), HeLa/STARD3 MR/ND (D), and HeLa/STARD3 FA/YA (E) cells were labeled with anti‐STARD3 (pAbMLN64‐Nt‐1611; magenta) and with anti‐VAP‐A (green) antibodies. Subpanels: (a) Merged image of green and magenta signals. Scale bars: 10 μm. (b–d) Higher magnification (3×) of the area outlined in white in (a), showing the green (b), magenta (c), and merge (d) signals. (e) Pixels where the green and the magenta channels co‐localize are shown in white. (f) Linescan analyses showing fluorescence intensities of the magenta and green channels along the arrow in (d). Black thick lines indicate the positions of LEs. WT STARD3, STARD3 ΔSTART, and STARD3 MR/ND recruit VAP‐A in ER–endosome contacts while STARD3 FA/YA does not.
- F–I
TEM images (a) of control HeLa/Ctrl (F), HeLa/STARD3 (G), HeLa/STARD3 ΔSTART (H), and HeLa/STARD3 FA/YA (I) cells. (b) Schematic representation of images shown in (a); the ER, endosomes, and inner endosomal membranes are in dark, light, and medium gray. Scale bar: 400 nm. Please note that HeLa/STARD3 and HeLa/STARD3 ΔSTART cells exhibit extensive ER–endosome contacts while HeLa/STARD3 FA/YA cells only display few ER–endosome contacts, similarly to HeLa/Ctrl cells. Mt: mitochondria; Nc: nucleus.
- J
Quantification by stereology of relative inner endosomal membrane surface on TEM sections. Thirty‐eight endosome sections were quantified for each cell line. Mean ± SD; ***P < 0.001, Kruskal–Wallis with Dunn's multiple comparison test.
- A
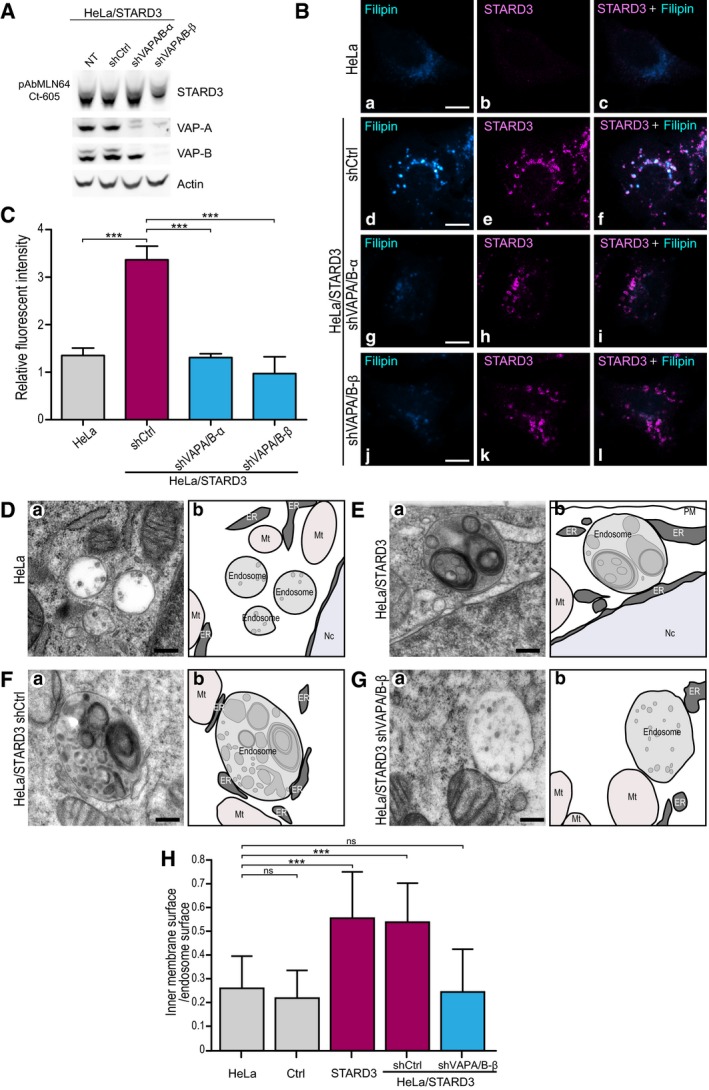
Western blot analysis of VAP‐A and VAP‐B expression in untreated (NT) HeLa/STARD3 cells or HeLa/STARD3 expressing a control shRNA (shCtrl) or two pairs of shRNAs targeting VAP‐A and VAP‐B (shVAP‐A/B‐α or shVAP‐A/B‐β). Actin was used as a loading control.
- B
HeLa cells (a–c), and HeLa/STARD3 cells expressing a control shRNA (shCtrl; d–f) or two pairs of shRNAs targeting VAP‐A and VAP‐B [shVAP‐A/B‐α (g–i) or shVAP‐A/B‐β (j–l)] were labeled with anti‐STARD3 antibodies (magenta) and with the fluorescent cholesterol probe filipin (Cyan Hot). Merged images of filipin and STARD3 signals are shown in (c, f, i and l). Scale bars: 10 μm.
- C
Relative fluorescence intensity of intracellular filipin signal in HeLa, HeLa/STARD3/shCtrl, HeLa/STARD3/shVAP‐A/B‐α, and HeLa/STARD3/shVAP‐A/B‐β. n = 3 independent experiments. Total number of cells analyzed: HeLa: 84; HeLa/STARD3/shCtrl: 130; HeLa/STARD3/shVAP‐A/B‐α: 109; HeLa/STARD3/shVAP‐A/B‐β: 92. Number of cells analyzed per sample per experiment ≥ 25. Mean ± SD; ***P < 0.001, ANOVA with Tukey's multiple comparison test.
- D–G
TEM images (a) of control HeLa cells (D), HeLa/STARD3 cells (E), or HeLa/STARD3 cells expressing a control shRNA (F) or a pair of shRNAs targeting VAP‐A and VAP‐B (G). Scale bars: 200 nm. Schematic representation (b) of images shown in (a); the ER, endosomes, and intraluminal membranes are in dark, light, and median gray, respectively. Mt: mitochondria; Nc: nucleus; PM: plasma membrane.
- H
Quantification by stereology of relative intraluminal membrane surface on TEM sections. Fifty (HeLa; HeLa/Ctrl; HeLa/STARD3) and 25 (HeLa/STARD3/shCtrl; HeLa/STARD3/shVAP‐A/B‐β) endosome sections were quantified. Mean ± SD; ***P < 0.001, Kruskal–Wallis with Dunn's multiple comparison test.
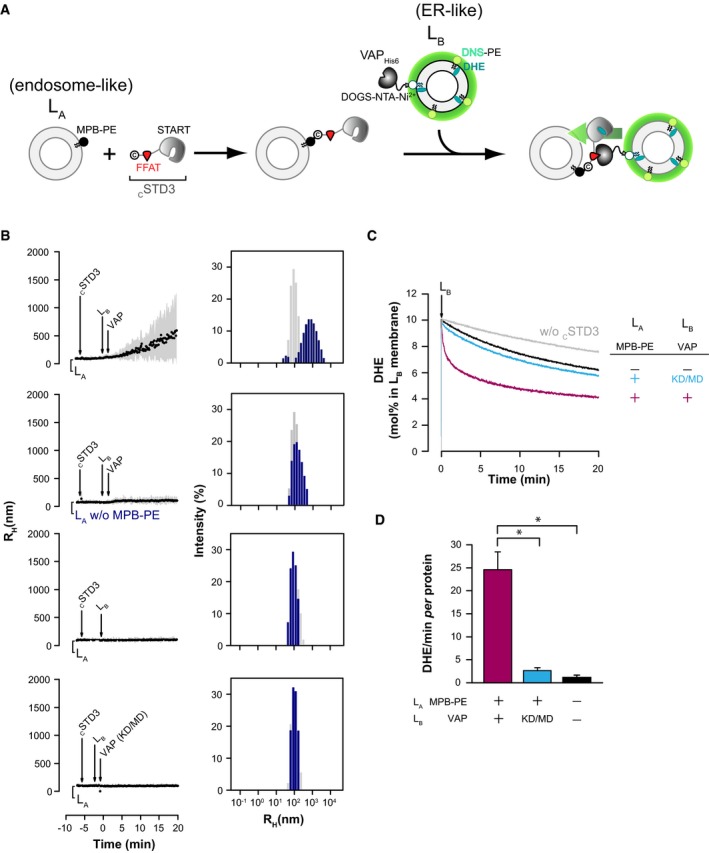
Description of the experimental strategy. For DLS experiments, LA liposomes (endosome‐like) are decorated with cSTD3 owing to covalent links with MPB‐PE lipids, and mixed with LB liposomes (ER‐like) covered by VAPHIS6 attached to DOGS‐NTA‐Ni2+. For DHE transport experiment, LB liposomes also contain DHE and a dansylated lipid (DNS‐PE). The transport of DHE from LB to LA liposomes is followed by FRET.
Aggregation assays in real time. Liposomes (50 μM total lipids), decorated or not with cSTD3 (380 nM), were mixed with LB liposomes (50 μM total lipids) naked or covered with VAPHis6 or VAP(KD/MD)His6 (380 nM). Aggregation was followed by DLS. Left panels: mean radius and polydispersity (shaded area) over time. Right panels: size distribution before (gray bars) and after (blue bars) the reaction. Please note that only the condition presented on the top graphs show increased polydispersity and mean radius over time.
DHE transport assay. DOPC liposomes (62.5 μM total lipids, LA) containing or not 3 mol% MPB‐PE were mixed with cSTD3 (475 nM). After 5 min, LB liposomes (DOPC/DOGS‐NTA‐Ni2+/DNS‐PE/DHE 85.5/2/2.5/10 mol/mol, 62.5 μM total lipids), naked or covered with 500 nM VAPHis6 or VAP(KD/MD)His6, were added. FRET between DHE and DNS‐PE in the LA liposomes diminishes as DHE is transported to the LA liposomes. The signal was converted into amount of DHE present in LB liposomes (in mol%). Please note that a slow transport of DHE is observed without cSTD3 (gray line) due to spontaneous DHE transfer. The black and blue lines show the modest transfer activity of the untethered cSTD3. The magenta line show the rapid transfer activity of the tethered cSTD3.
Initial DHE transport rate measured with cSTD3 in the presence or the absence of MPB‐PE and functional VAP (475 nM). Mean ± SEM; n = 4 independent experiments; *P < 0.05, Mann–Whitney test.
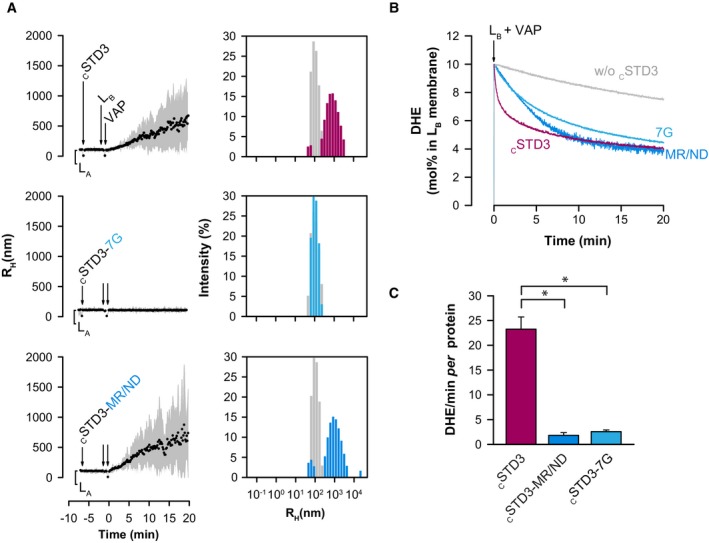
Aggregation assays. LB liposomes (50 μM total lipids) covered with VAPHis6 (380 nM) were mixed with LA liposomes covered with cSTD3, cSTD3‐7G, or cSTD3‐MR/ND (380 nM). Left panels: mean radius and polydispersity (shaded area) over time. Right panels: size distribution before (gray bars) and after the reaction (colored bars).
DHE transport assay. DOPC liposomes (62.5 μM total lipids, LA) containing 3 mol% MPB‐PE were mixed with cSTD3, cSTD3‐7G, or cSTD3‐MR/ND (475 nM). After 5 min, liposomes (DOPC/DOGS‐NTA‐Ni2+/DNS‐PE/DHE liposomes 85.5/2/2.5/10 mol/mol, 62.5 μM total lipids, LB), covered with 500 nM VAPHis6, were added. Please note the rapid transfer activity of the tethered cSTD3 (magenta line). A delayed and slower transport is observed both in untethered condition (light blue line) and with the lipid‐binding deficient mutant (dark blue line).
Initial DHE transport rate measured with cSTD3, cSTD3‐7G, or cSTD3‐MR/ND. Mean ± SEM; n = 4 for cSTD3 and n = 3 for other cSTD3 constructs; *P < 0.05, Mann–Whitney test.
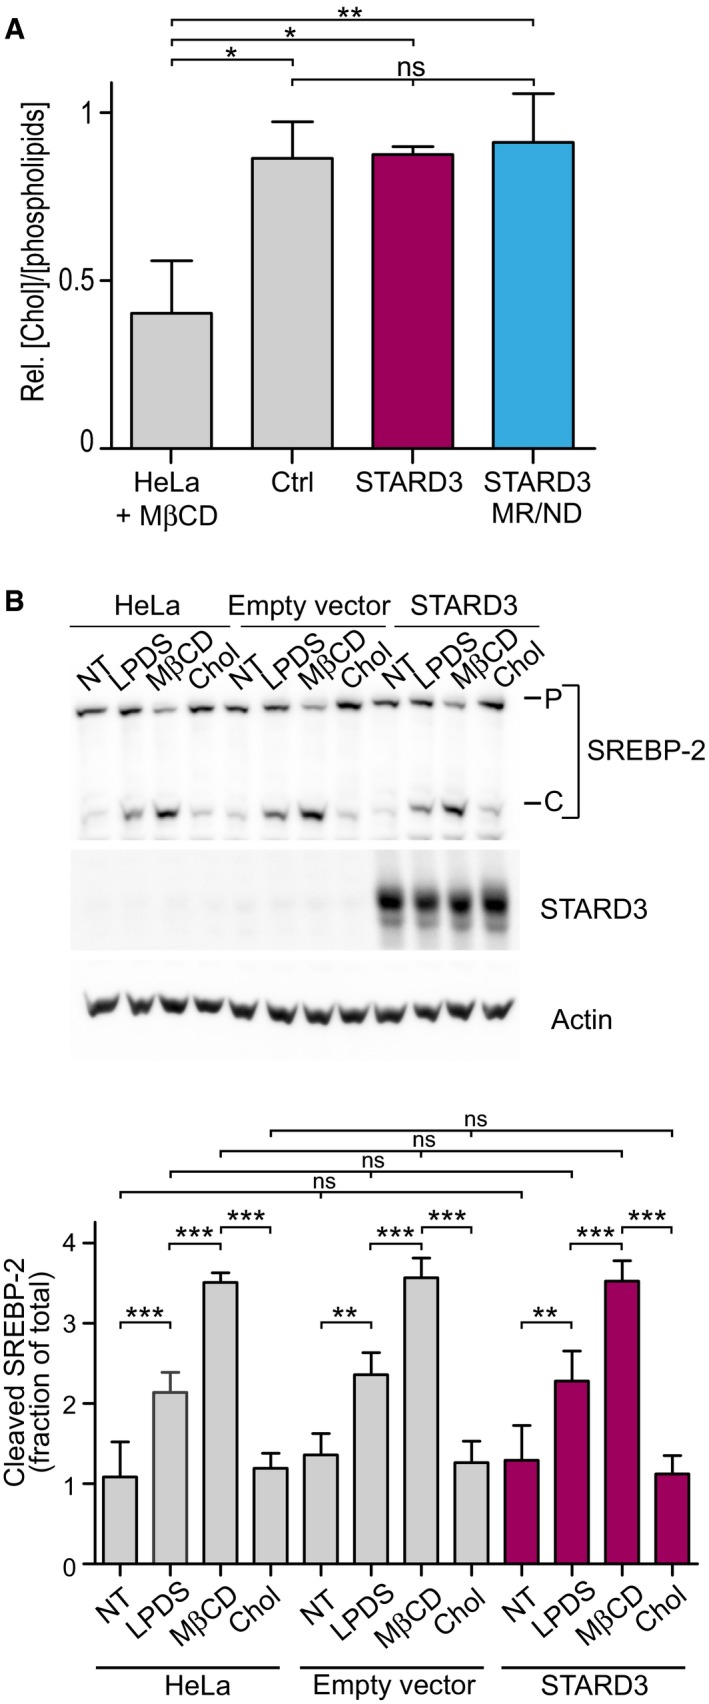
Total free cholesterol quantification after total lipid extraction in control cells and in cells expressing STARD3 or the lipid binding mutant form of STARD3 (STARD3 MR/ND) (n = 3). Please note that control HeLa cells treated with MβCD have a significant depletion of total cholesterol (n = 2). Mean ± SD; ANOVA with Tukey's multiple comparison test.
Western blot analysis of SREBP‐2 activation in controls (HeLa, HeLa/empty vector) or STARD3‐overexpressing HeLa cells. Cells were incubated for 2 h in DMEM culture medium supplemented with: 5% FCS (NT); 5% LPDS, 10 μM mevinolin (LPDS); 5% LPDS, 10 μM mevinolin, 1 mM MβCD (MβCD); 5% LPDS, 10 μM mevinolin, 500 μM cholesterol complexed to MβCD (MβCD‐Chol). The proteasome inhibitor MG132 (10 μM) was present in all conditions. P = precursor form of SREBP‐2; C = cleaved form of SREBP‐2. Lower panel: WB quantification in which cleaved SREBP‐2 is expressed as a fraction of total SREBP2 (P+C). Mean ± SD; n = 4 independent experiments; **P < 0.01, ***P < 0.001, ANOVA with Tukey's multiple comparison test.
- A–C
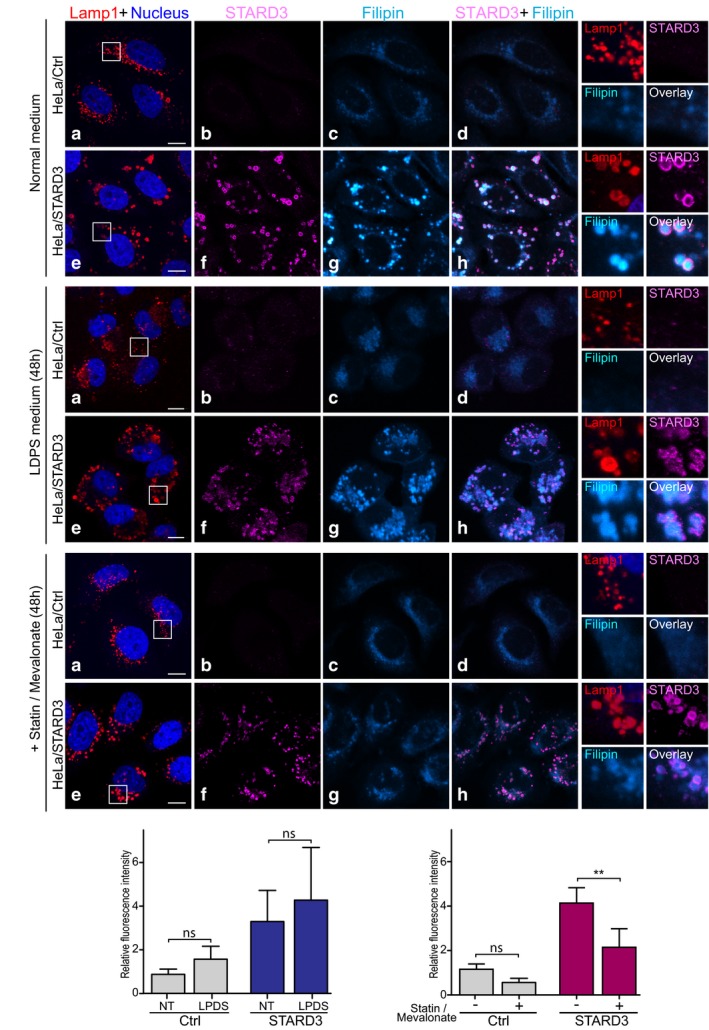
HeLa/Ctrl and HeLa/STARD3 cells were incubated in normal medium (A), LPDS‐containing medium (B) or normal medium with 50 μM mevinolin and 100 μM mevalonate (C), for 48 h. Cholesterol accumulation in endosomes was detected by filipin staining (Cyan Hot) in endosomes identified by the presence of Lamp1 (red) and STARD3 (magenta). Nuclei were stained in blue. Merged image of filipin and STARD3 signals is shown in (d and h). The subpanels on the right are higher magnification (3.5×) images of the area outlined in white (a, e). The filipin and STARD3 merged image is labeled Overlay. Scale bars: 10 μm.
- D, E
Relative fluorescence intensity of intracellular filipin in HeLa/Ctrl and HeLa/STARD3 cells incubated or not in LPDS‐containing medium (D) or treated or not with mevinolin and mevalonate (E). Mean ± SD; n = 5 (D) and n = 4 (E) independent experiments; **P < 0.01, ANOVA with Tukey's multiple comparison test.
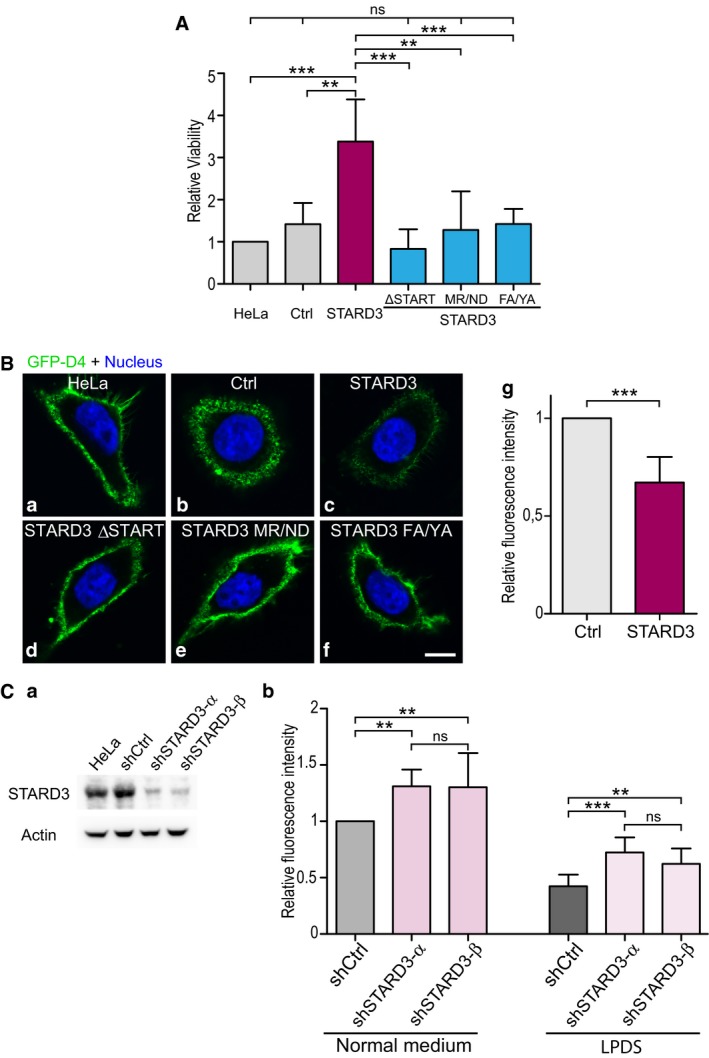
Indirect analysis of plasma membrane cholesterol content. Cells were treated with amphotericin B (20 μg/ml; 4 h at 37°C), and cell viability was measured using a luminescent cell viability assay. Relative cell viability is represented on the graph. Mean ± SD; n: number of independent experiments; HeLa, HeLa/Ctrl, HeLa/STARD3: n = 5; HeLa/STARD3 ΔSTART; HeLa/STARD3 MR/ND; HeLa/STARD3 FA/YA: n = 4. **P < 0.01, ***P < 0.001, ANOVA with Tukey's multiple comparison test.
Plasma membrane cholesterol labeling using the GFP‐D4 probe. Live cells were incubated with GFP‐D4 probe (green) prior to fixation and nuclei staining (blue). Both signals are merged (a–f). Scale bar: 10 μm. (g) Quantification of mCherry‐D4 membrane labeling by flow cytometry. Fluorescence mean intensities are compared with that of control cells set to one. Mean ± SD; n = 7 independent experiments; paired two‐tailed t‐test; ***P = 0.0006.
Western blot analysis (a) of STARD3 in HeLa cells, HeLa cells expressing a control shRNA (shCtrl) and in HeLa cells expressing two shRNAs targeting STARD3 (shSTARD3‐α and shSTARD3‐β). Actin was used as a loading control. Plasma membrane cholesterol was labeled using the GFP‐D4 probe (b) under normal cell culture conditions and under LPDS culture conditions (24‐h treatment); flow cytometry quantification of the GFP‐D4 staining is expressed as mean intensity with that of control cell in normal medium set to one. Mean ± SD; n = 9 independent experiments; **P < 0.01, ***P < 0.001, ANOVA with Tukey's multiple comparison test.
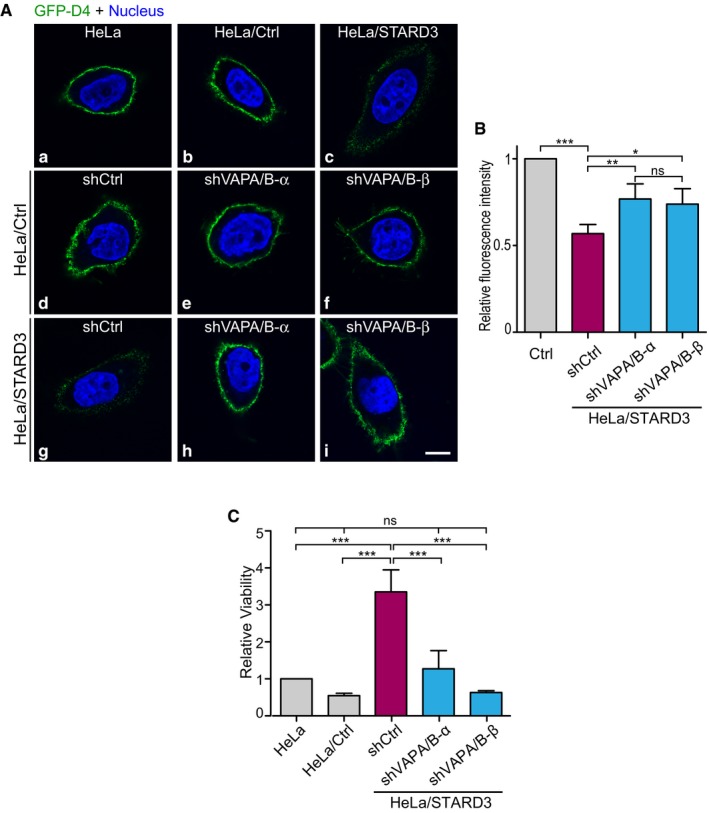
Plasma membrane cholesterol labeling using the GFP‐D4 probe as in Fig 8B. Live cells were incubated with GFP‐D4 probe (green) prior to fixation and nuclei staining (blue). Both signals are merged (a–i). Scale bar: 10 μm.
Plasma membrane cholesterol was labeled using the GFP‐D4 probe. GFP‐D4 signal was quantified by flow cytometry. Mean ± SD; n = 4 independent experiments; *P < 0.05, **P < 0.01, ***P < 0.001, ANOVA with Tukey's multiple comparison test.
Indirect analysis of plasma membrane cholesterol content. Cells were treated with amphotericin B (20 μg/ml; 4 h at 37°C), and cell viability was measured using a luminescent cell viability assay. Relative cell viability is represented on the graph. Mean ± SD; n = 3; ***P < 0.001, ANOVA with Tukey multiple comparison test.
References
-
- Abe M, Makino A, Hullin‐Matsuda F, Kamijo K, Ohno‐Iwashita Y, Hanada K, Mizuno H, Miyawaki A, Kobayashi T (2012) A role for sphingomyelin‐rich lipid domains in the accumulation of phosphatidylinositol‐4,5‐bisphosphate to the cleavage furrow during cytokinesis. Mol Cell Biol 32: 1396–1407 - PMC - PubMed
-
- Alpy F, Stoeckel ME, Dierich A, Escola JM, Wendling C, Chenard MP, Vanier MT, Gruenberg J, Tomasetto C, Rio MC (2001) The steroidogenic acute regulatory protein homolog MLN64, a late endosomal cholesterol‐binding protein. J Biol Chem 276: 4261–4269 - PubMed
-
- Alpy F, Wendling C, Rio M‐C, Tomasetto C (2002) MENTHO, a MLN64 homologue devoid of the START domain. J Biol Chem 277: 50780–50787 - PubMed
-
- Alpy F, Tomasetto C (2005) Give lipids a START: the StAR‐related lipid transfer (START) domain in mammals. J Cell Sci 118: 2791–2801 - PubMed
-
- Alpy F, Latchumanan VK, Kedinger V, Janoshazi A, Thiele C, Wendling C, Rio M‐C, Tomasetto C (2005) Functional characterization of the MENTAL domain. J Biol Chem 280: 17945–17952 - PubMed
Publication types
MeSH terms
Substances
LinkOut - more resources
Full Text Sources
Other Literature Sources
Medical
Molecular Biology Databases
Research Materials
