. 2017 Apr 18;114(16):4153-4158.
doi: 10.1073/pnas.1703931114. Epub 2017 Apr 4.

SMARCE1 is required for the invasive progression of in situ cancers

Affiliations

SMARCE1 is required for the invasive progression of in situ cancers

Ethan S Sokol et al. Proc Natl Acad Sci U S A. .

Abstract

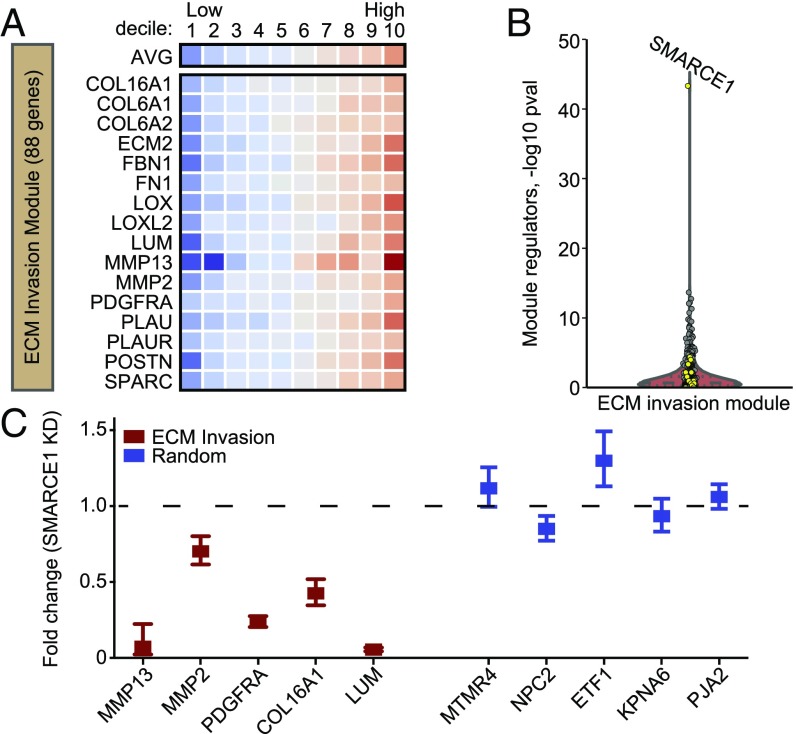
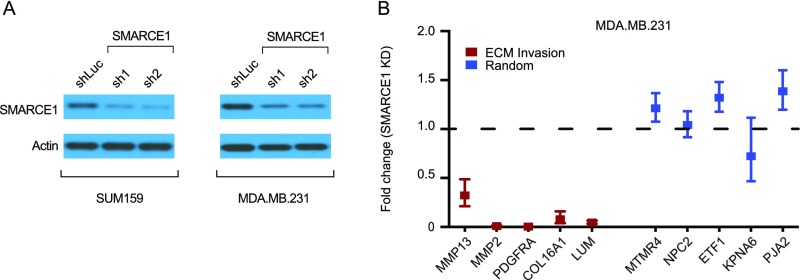
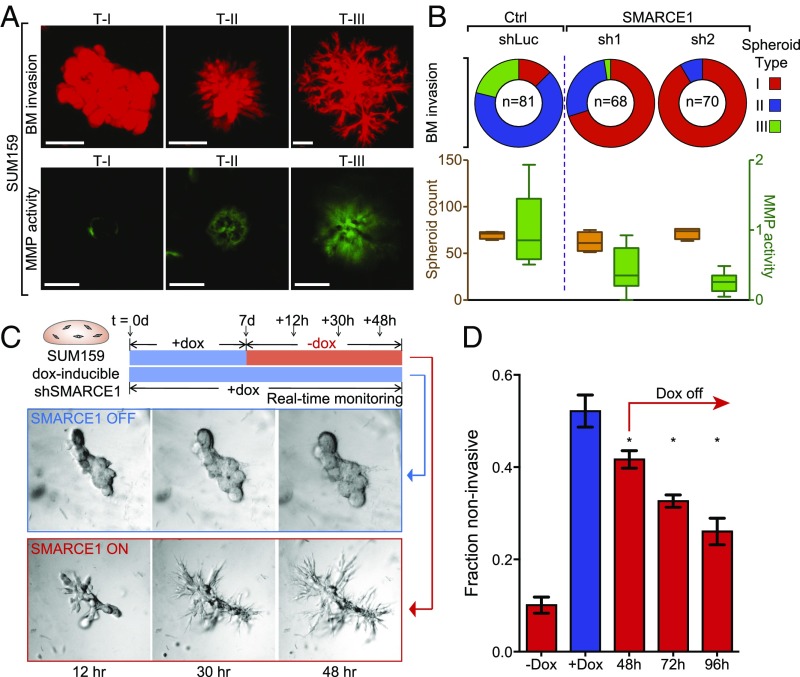
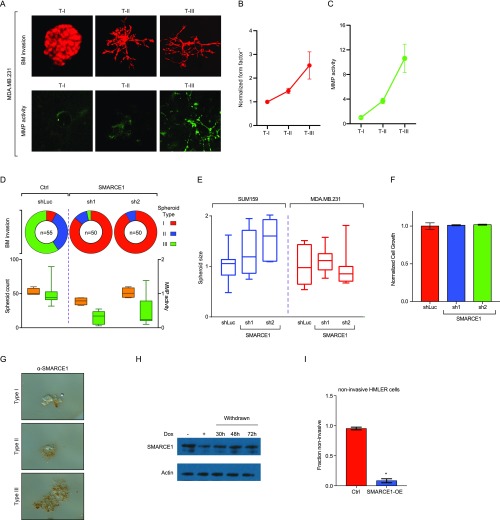
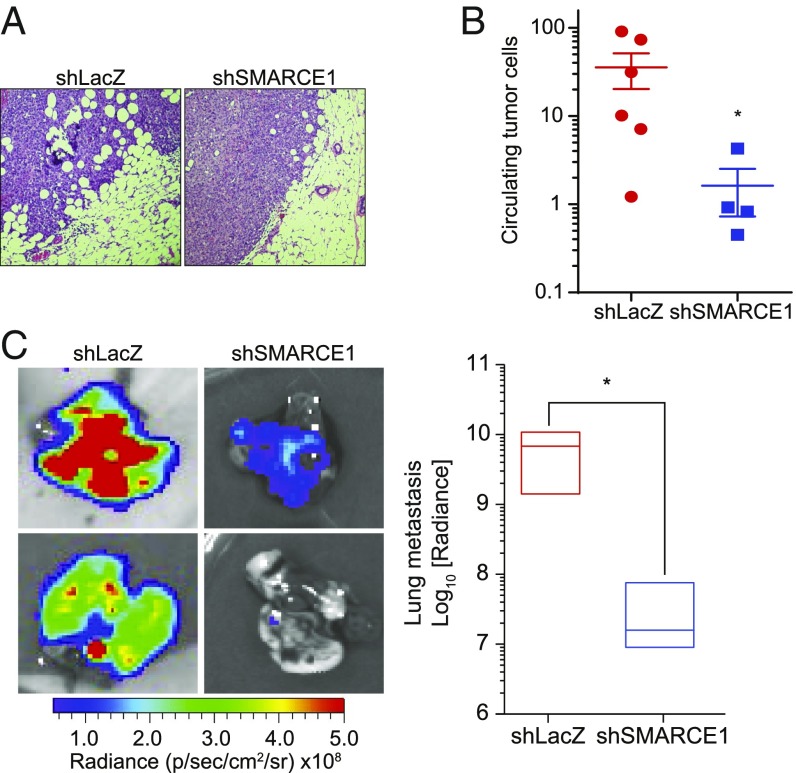
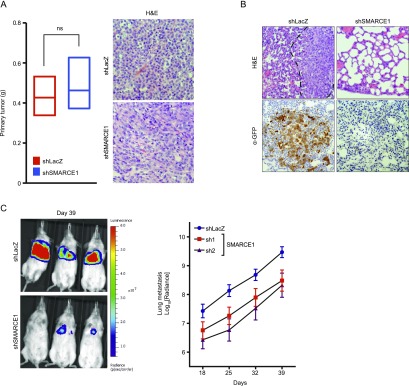
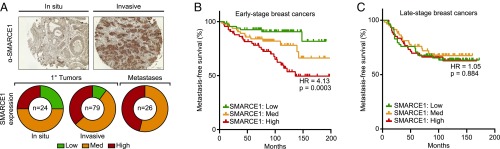
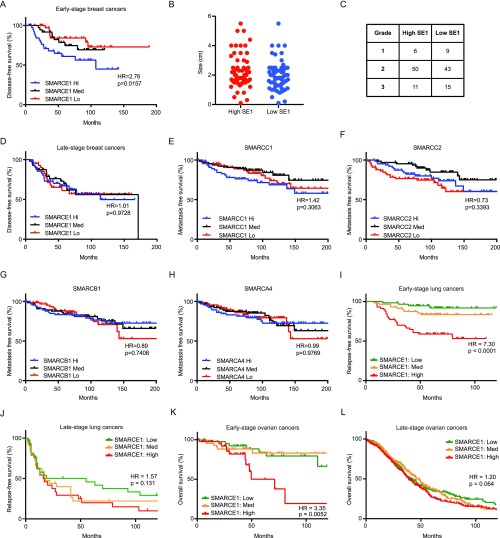
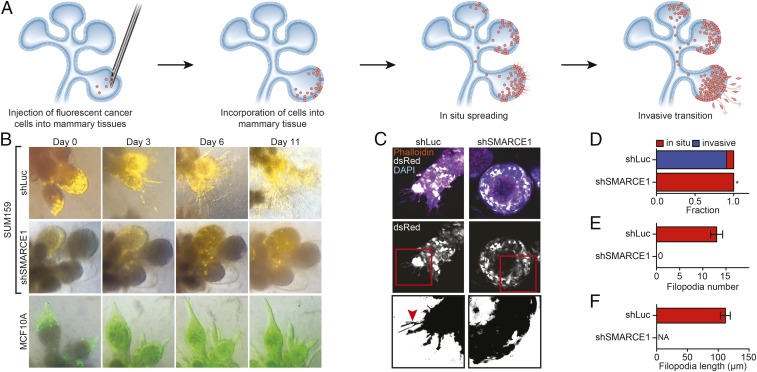
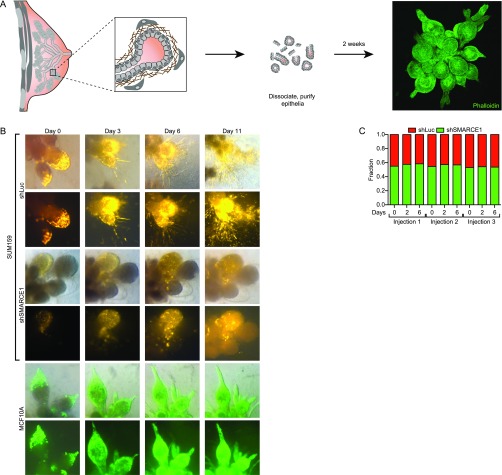
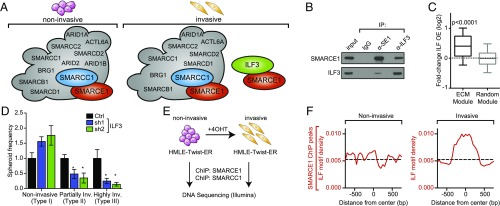
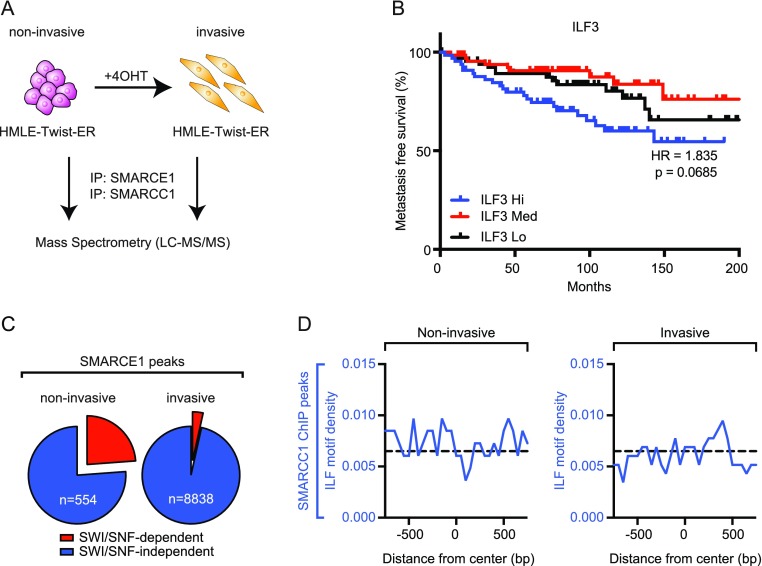
Advances in mammography have sparked an exponential increase in the detection of early-stage breast lesions, most commonly ductal carcinoma in situ (DCIS). More than 50% of DCIS lesions are benign and will remain indolent, never progressing to invasive cancers. However, the factors that promote DCIS invasion remain poorly understood. Here, we show that SMARCE1 is required for the invasive progression of DCIS and other early-stage tumors. We show that SMARCE1 drives invasion by regulating the expression of secreted proteases that degrade basement membrane, an ECM barrier surrounding all epithelial tissues. In functional studies, SMARCE1 promotes invasion of in situ cancers growing within primary human mammary tissues and is also required for metastasis in vivo. Mechanistically, SMARCE1 drives invasion by forming a SWI/SNF-independent complex with the transcription factor ILF3. In patients diagnosed with early-stage cancers, SMARCE1 expression is a strong predictor of eventual relapse and metastasis. Collectively, these findings establish SMARCE1 as a key driver of invasive progression in early-stage tumors.

Keywords: DCIS; SMARCE1; biomarker; invasive progression.


Conflict of interest statement

The authors declare no conflict of interest.

Figures

Fig. S1.
Fig. S1.
Computational analysis of gene modules involved in DCIS-to-IDC progression. (A) Schematic representation of the transition from DCIS to invasive breast cancer. In DCIS (Left), cancer cells (red) remain encapsulated within the ducts (blue) and are surrounded by the basement membrane (green). Subsequently, as cells transition to invasive carcinoma (Right), they degrade the basement membrane and invade into surrounding tissues. (B) Spearman correlations were calculated from all pairwise comparisons of genes up-regulated in invasive tumors vs. DCIS tumors. Hierarchical clustering was performed on the pairwise correlation matrix. Plotted is a heat map of the clustered correlation matrix. Red indicates a high correlation, and black indicates low/no correlation. The blue bar marks genes present in module 1, and the green bar marks genes present in module 2. (C) Expression of genes in a random module across 158 primary human breast tumors. Tumors were sorted based on their average expression of the 88 genes in the module (AVG), and divided into ten groups (deciles). The heat map denotes the average expression in the corresponding decile. (D) A violin plot showing the contributions of 1,124 transcription and chromatin-modifying factors to expression of the random module. Statistical significance was computed by using the hypergeometric test. SWI/SNF complex genes are highlighted in yellow.
Fig. 1.
Fig. 1.
SMARCE1 regulates an ECM invasion module that is up-regulated upon DCIS progression. (A) Expression of genes in the ECM invasion module across 158 primary human breast tumors. Tumors were sorted based on their average expression of the 88 genes in the module (AVG), and divided into ten groups (deciles). Heat map denotes the average expression in the corresponding decile. (B) Violin plot showing the contributions of 1,124 transcription and chromatin-modifying factors to expression of the ECM invasion module. Statistical significance was computed with the hypergeometric test. SWI/SNF complex genes are highlighted in yellow. (C) Quantitative PCR analysis of expression of ECM invasion module genes and random module genes in SUM159 cells transduced with control or SMARCE1 shRNAs. Gene expression is normalized to GAPDH and plotted as fold change relative to the control cell line (n = 4; mean ± SEM).
Fig. S2.
Fig. S2.
Knockdown of SMARCE1 in breast cancer cells reduces the expression of ECM invasion module genes. (A) Western blot showing the expression of SMARCE1 in control and shSMARCE1 (sh1 and sh2) SUM159 and MDA.MB.231 cells. (B) Quantitative PCR analysis of expression of ECM invasion module genes and random module genes in MDA.MB.231 cells transduced with control or SMARCE1 shRNAs. Gene expression is normalized to GAPDH and plotted as fold change relative to the control cell line (n = 4 plotted as mean ± SEM).
Fig. 2.
Fig. 2.
SMARCE1 is required for cancer cell invasion through basement membrane. (A) Epifluorescence images of tumor spheroids formed by SUM159 cells in 3D basement membrane (BM). (Top) Noninvasive (T-I), partially invasive (T-II), or highly invasive (T-III) spheroids. (Bottom) Collagen IV hydrolysis (green) in DQ collagen IV-supplemented BM. (Scale bars: 100 µm.) (B) Quantification of tumor spheroid invasiveness, protease activity, and number in control and shSMARCE1 SUM159 cells. (Top) Quantification of T-I, T-II, and T-III spheroids. (Bottom) Spheroid MMP activity relative to shLuc controls and spheroid number per BM. (C) SMARCE1 reexpression rescues invasive progression in tumor spheroids. (Top) Experimental design to measure effect of SMARCE1 reexpression on spheroid invasiveness. (Bottom) Representative images of tumor spheroids 12, 30, and 48 h after doxorubicin (dox) withdrawal (SMARCE1 ON) or continued treatment with doxorubicin (SMARCE1 OFF). (D) Quantification of noninvasive spheroids after SMARCE1 inhibition for 7–9 d (+dox) and subsequent reexpression of SMARCE1 (dox off) for 48, 72, or 96 h. All spheroids were quantified at day 11 (n = 4; *P < 0.05).
Fig. S3.
Fig. S3.
SMARCE1 inhibition blocks invasion through basement membrane. (A) Epifluorescence images of tumor spheroids formed by MDA.MB.231 cells in 3D basement membrane (BM) showing noninvasive (T-I), partially invasive (T-II), or highly invasive (T-III) characteristics. Below are epifluorescence images showing collagen hydrolysis (green signal) of type I, II, and III spheroids cultured in DQ collagen (IV)-supplemented BM cultures. (Scale bar: 100 µm.) (B) Basement membrane invasiveness of type I, II, and III structures in SUM159 cells was calculated by using image segmentation analysis and form factor calculation and normalized to T-I spheroids. (C) Quantification of MMP activity in each SUM159 spheroid type, normalized to T-I. (D) Quantification of spheroids formed by control and shSMARCE1 MDA.MB.231 cells (Upper) and quantification of spheroid counts and MMP activity of the same cells (Lower). (E) Quantification of the size of spheroids formed by control and shSMARCE1 (sh1 and sh2) SUM159 and MDA.MB.231 cells, respectively. (F) MTS proliferation assays (Celltiter Glo-based) were performed in basement membrane cultures 3 d after seeding for SUM159 control (shLuc) and SMARCE1 KD lines (sh1 and sh2). (G) SUM159 cells were cultured in basement membrane for 7 d and immunohistochemically stained for SMARCE1. Representative images of type I, II, and III colonies are shown. Note the stronger staining in invasive regions. (H) Western blot showing the expression of SMARCE1 in SUM159 cells infected with a doxorubicin (dox)-inducible shRNA. Cells were grown in the absence of doxorubicin (−), presence of 1 µg/mL doxorubicin (+), or with doxorubicin followed by doxorubicin withdrawal for 30, 48, or 72 h. (I) HMLER cells infected with control (Ctrl) or FLAG-SMARCE1 (SMARCE1-OE) constructs were seeded into polymerized collagen matrices and grown for 7 d. Shown is the quantification of the fraction of noninvasive structures from control (n = 87) and SMARCE1-OE (n = 71; *P < 0.05).
Fig. S4.
Fig. S4.
SMARCE1 does not affect proliferation of breast cancer cells. SUM159 breast cancer cells expressing a control shRNA (Ctrl) or shRNAs targeting SMARCC1 (A) or SMARCE1(B) were cultured in 2D for 4 d. Cell viability was measured with CellTiter Glo and plotted for 0, 2, and 4 d.
Fig. 3.
Fig. 3.
SMARCE1 is essential for metastasis in vivo. (A) Representative H&E-stained sections of the tumor boundary from MDA.MB.231-LM2–injected control (shLacZ) and SMARCE1-inhibited (shSMARCE1) tumors 4 wk after injection. (B) Number of circulating tumor cells in mice bearing control (n = 6) or SMARCE1-inhibited (n = 4) tumors. (C) Representative luminescence images and quantification of metastatic burden in whole lungs of mice inoculated with shLacZ (n = 3) or shSMARCE1 (n = 4) MDA.MB.231-LM2 cells (*P < 0.05).
Fig. S5.
Fig. S5.
The role of SMARCE1 in tumorigenesis and metastasis in vivo. (A) (Left) Quantification of primary tumor weight in mice inoculated with MDA.MB.231-LM2 cells expressing an shRNA targeting LacZ (shLacZ; n = 6) or SMARCE1 (shSMARCE1; n = 6). (Right) Representative images of tumor sections stained with H&E. (B) Lung sections from mice inoculated with shLacZ or shSMARCE1. MDA.MB.231-LM2 cells were stained with H&E and an α-GFP antibody. Dotted line indicates the border of a metastatic lesion. (C) Quantification of metastatic burden in lungs of mice injected in the tail vein with shLacZ or shSMARCE1 MDA.MB.231-LM2 cells at 18, 25, 32, and 39 d postinjection. Shown are representative luminescent images from tail vein-injected mice (shLacZ or shSMARCE1) 39 d following injection.
Fig. 4.
Fig. 4.
SMARCE1 expression is prognostic in early-stage tumors. (A) Patient breast tissues from in situ and invasive breast cancers were immunohistochemically stained for SMARCE1 (Top). In situ breast cancer, invasive breast cancer, and metastasis staining intensities were quantified (Bottom). (B and C) SMARCE1 expression was examined in a cohort of patients with early-stage breast tumors [N stage 0 (lymph node-negative), GSE11121; n = 200] and late-stage breast tumors (N stage ≥ 1, GSE20685; n = 190). Metastasis-free survival curves in patients stratified into tertiles (high, medium, low) based on tumor SMARCE1 expression. HRs and P values were determined with the log-rank statistical test.
Fig. S6.
Fig. S6.
SMARCE1 predicts outcome in patients with early-stage tumors. (A) A cohort of patients with early-stage breast tumors (GSE21653, node-negative patients; n = 116) were binned into SMARCE1 high (top tertile), SMARCE1 medium (middle tertile), or SMARCE1 low (bottom tertile) categories, and disease-free survival curves were plotted. The top and bottom tertiles were compared with the log-rank test to determine an HR and P value. (B and C) A cohort of patients with breast cancer (node-negative, GSE11121; n = 200) were binned into SMARCE1 high, medium, or low by tertile, and tumor size (B) and tumor grade (C) were plotted. (D) A cohort of patients with late-stage breast tumors (GSE21653, node-positive patients; n = 133) were binned into SMARCE1 high (top tertile), SMARCE1 medium (middle tertile), or SMARCE1 low (bottom tertile) categories, and disease-free survival curves were plotted. The top and bottom tertiles were compared with log-rank test to determine an HR and P value. (EH) Early-stage breast tumors (GSE11121) were stratified based on the tertile expression of SMARCC1 (E), SMARCC2 (F), SMARCB1 (G), or SMARCA4 (H), and were plotted for metastasis-free survival. (IL) Patients were binned into SMARCE1 high (top tertile), SMARCE1 medium (middle tertile), or SMARCE1 low (bottom tertile) categories, and survival curves were plotted. A cohort of patients with early-stage lung tumors (stage IA or IB, GSE31210; n = 168) (I) and late-stage lung tumors (stage II or above, GSE30219; n = 94) (J) were analyzed for relapse-free survival. A cohort of patients with early-stage (stage I or II; n = 133) (K) and late-stage (stage III or IV; n = 1,148) (L) ovarian cancers (KMplot ovarian cancer, 2015 version) were analyzed for overall survival. The top and bottom tertiles were compared with log-rank test to determine an HR and P value.
Fig. 5.
Fig. 5.
SMARCE1 is required for cancers to escape the ductal-lobular architecture of normal mammary tissues. (A) Schematic of the tissue model of invasive progression of in situ cancer cells. (B) Representative bright-field images with a fluorescent overlay of dsRed-labeled SUM159 cells transduced with shLuc or shSMARCE1 (pseudocolored yellow) and Venus-labeled MCF10A cells injected into mammary tissues. (C) Confocal images of tissues 3 d postinjection. Red arrowhead indicates filopodia. (D) Fraction of SUM159 cells (shLuc or shSMARCE1) that remained encapsulated (in situ) or escaped the tissue architecture (invasive) 3 d postinjection. (E) Number of filopodia formed by SUM159 cells per tissue injected in D. (F) Length of the filopodia from E (*P < 0.05).
Fig. S7.
Fig. S7.
SMARCE1 is required for cancer cells to escape the ductal-lobular architecture of normal mammary tissues. (A) Schematic of how primary mammary samples were processed to produce tissue outgrowths. Patient samples were mechanically and enzymatically dissociated then purified with differential pelleting and plating (Materials and Methods). Shown is a representative tissue grown in culture for 3 wk and stained for phalloidin (green, Right). (B) Images from Fig. 5B were split into a merge (bright-field and epifluorescence; Top) and epifluorescence-only image (Bottom) for each condition indicated. Representative images at 0, 3, 6, and 10/11 d after injection are shown. (C) DsRed-labeled SUM159 shLuc cells and Venus-labeled SUM159 shSMARCE1 cells were coinjected into tissues, and fluorescence intensities were measured over 6 d. Plotted is the fraction of fluorescent intensity contributed from dsRed (red) and Venus (green).
Fig. 6.
Fig. 6.
SMARCE1 binds ILF3 and is recruited to ILF motifs. (A) Schematic representation of the list of binding partners of SMARCE1 or SMARCC1 in noninvasive or invasive HMLE-Twist-ER cell [untreated or treated with 125 nM 4-hydroxytamoxifen (4OHT), respectively] identified by co-IP and MS. SMARCE1 and SMARCC1 interacted with each other as well as other members of the SWI/SNF complex (shown in gray) in invasive and noninvasive cells. An additional unique interaction between SMARCE1 and ILF3 was detected in invasive HMLE-Twist-ER cells. (B) Co-IP of endogenous SMARCE1 (SE1) and ILF3 in nuclear lysates from invasive SUM159 cells. (C) Expression of the ECM invasion module or a random module of 88 genes in embryonic fibroblasts from transgenic mice overexpressing ILF2/3 (GSE67591) relative to expression in genetically matched mice without ILF2/3 overexpression. (D) Quantification of tumor spheroid invasiveness in control (shLuc) or shILF3 (sh1, sh2) SUM159 cells grown in basement membrane. (E) Experimental design for ChIP and sequencing (ChIP-seq) of SMARCC1 and SMARCE1 in noninvasive and invasive HMLE-Twist-ER cells (untreated or treated with 125 nM 4OHT, respectively). (F) SMARCE1 is localized to ILF motifs specifically in invasive HMLE-Twist-ER cells. Motif density was calculated by using a sliding window of 50 bp extending to 750 bp on either side of SMARCE1-bound peaks identified by ChIP-seq (*P < 0.05).
Fig. S8.
Fig. S8.
SMARCE1 physically binds ILF3 and is recruited to ILF motifs in the genome. (A) Schematic representation of the MS design. The HMLE-Twist-ER cell line is noninvasive in the absence of 4OHT, but can be induced into an invasive state through the addition of 4OHT. SMARCE1 and SMARCC1 were immunoprecipitated in HMLE-Twist-ER cells grown in the presence (125 nM) or absence of 4OHT, and their coprecipitates were determined by using MS. (B) ILF3 expression was examined in a cohort of early-stage breast tumors (N stage 0, GSE11121; n = 200). Patients were binned into ILF3 high, ILF3 medium, or ILF3 low tertiles, and metastasis-free survival curves were plotted. (C) Binding of SMARCE1 and SMARCC1 in the genome of HMLE-Twist-ER cells was analyzed by ChIP-Seq. SMARCE1 and SMARCC1 peaks were determined by using MACS. Shown is the fraction of SMARCE1 peaks that overlap with SMARCC1 (red, SWI/SNF-dependent) in noninvasive (no 4OHT) cells and invasive (+4OHT) cells. Also shown is the total number of observed peaks. (D) A de novo motif for ILF was generated by using HOMER on genes that were more than twofold up-regulated in ILF2/3-overexpressing murine fibroblasts relative to genetically matched controls. Regions around SMARCC1-bound peak centers were subdivided into bins of size 50 bp. Within each bin, motif density per peak was calculated.

Similar articles

Cited by

References

    1. Place AE, Jin Huh S, Polyak K. The microenvironment in breast cancer progression: Biology and implications for treatment. Breast Cancer Res. 2011;13:227. - PMC - PubMed
    1. Howlader N, et al. SEER Cancer Statistics Review, 1975-2013. National Cancer Institute; Bethesda, MD: 2016.
    1. Kerlikowske K, et al. Biomarker expression and risk of subsequent tumors after initial ductal carcinoma in situ diagnosis. J Natl Cancer Inst. 2010;102:627–637. - PMC - PubMed
    1. Schuetz CS, et al. Progression-specific genes identified by expression profiling of matched ductal carcinomas in situ and invasive breast tumors, combining laser capture microdissection and oligonucleotide microarray analysis. Cancer Res. 2006;66:5278–5286. - PubMed
    1. Hernandez L, et al. Genomic and mutational profiling of ductal carcinomas in situ and matched adjacent invasive breast cancers reveals intra-tumour genetic heterogeneity and clonal selection. J Pathol. 2012;227:42–52. - PMC - PubMed

Publication types

MeSH terms

Substances