. 2017 Apr 4;7(1):774.
doi: 10.1038/s41598-017-00670-2.

TSLP is a direct trigger for T cell migration in filaggrin-deficient skin equivalents

Affiliations

TSLP is a direct trigger for T cell migration in filaggrin-deficient skin equivalents

Leonie Wallmeyer et al. Sci Rep. .

Abstract

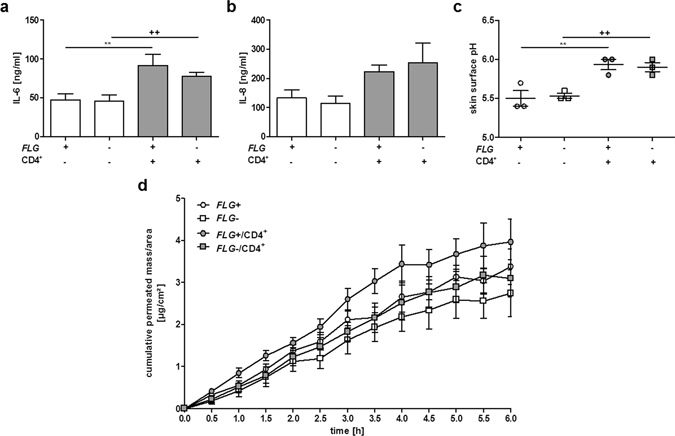
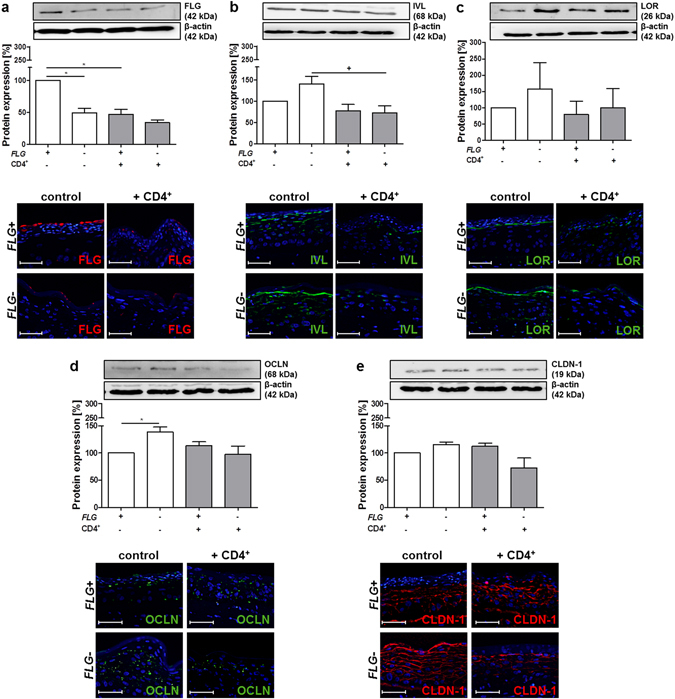
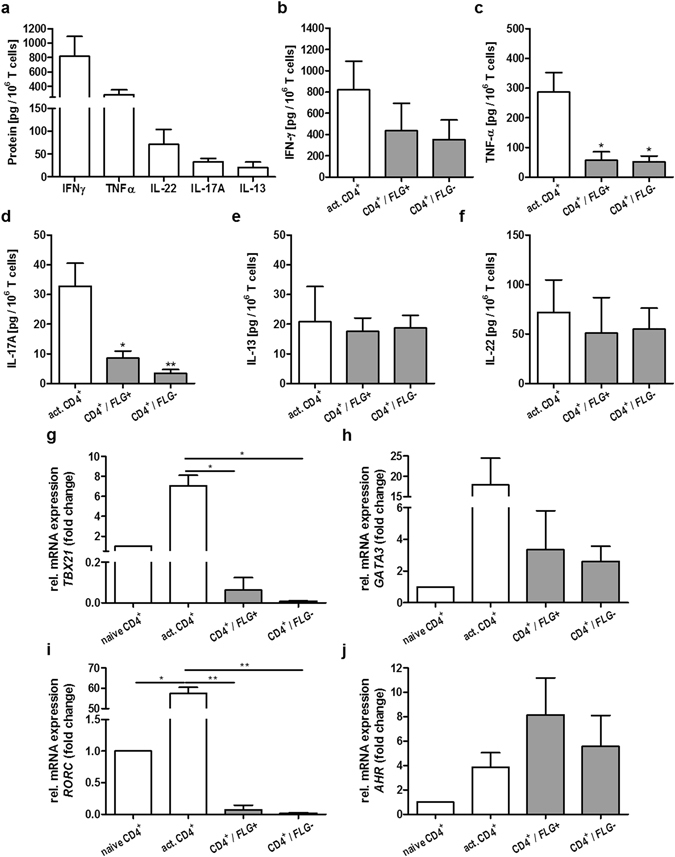
Mutations in the gene encoding for filaggrin (FLG) are major predisposing factors for atopic dermatitis (AD). Besides genetic predisposition, immunological dysregulations considerably contribute to its pathophysiology. For example, thymic stromal lymphopoietin (TSLP) is highly expressed in lesional atopic skin and significantly contributes to the pathogenesis of AD by activating dendritic cells that then initiate downstream effects on, for example, T cells. However, little is known about the direct interplay between TSLP, filaggrin-deficient skin and other immune cells such as T lymphocytes. In the present study, FLG knockdown skin equivalents, characterised by intrinsically high TSLP levels, were exposed to activated CD4+ T cells. T cell exposure resulted in an inflammatory phenotype of the skin equivalents. Furthermore, a distinct shift from a Th1/Th17 to a Th2/Th22 profile was observed following exposure of T cells to filaggrin-deficient skin equivalents. Interestingly, TSLP directly stimulated T cell migration exclusively in filaggrin-deficient skin equivalents even in the absence of dendritic cells, indicating a hitherto unknown role of TSLP in the pathogenesis of AD.


Conflict of interest statement

The authors declare that they have no competing interests.

Figures

Figure 1
Figure 1
Exposure to activated CD4+ T cells induces inflammatory responses in normal (FLG+) and filaggrin-deficient (FLG−) skin equivalents. (a,b) Levels of the pro-inflammatory cytokines IL-6 and IL-8 in FLG+ and FLG− skin equivalents, with and without exposure to activated CD4+ T cells (mean ± SEM, n = 7). (c) Skin surface pH of FLG+ and FLG− skin equivalents before and after exposure to activated CD4+ T cells (mean ± SEM, n = 3). (d) Skin permeability of FLG+ (○) and FLG− (□) skin equivalents without activated CD4+ T cells and FLG+ (○) and FLG− (□) skin equivalents after exposure to activated CD4+ T cells (mean ± SEM, n = 4). *Indicates statistically significant differences between FLG+ skin equivalents (**p ≤ 0.01), +indicates statistically significant differences between FLG− skin equivalents (++ p ≤ 0.01).
Figure 2
Figure 2
Exposure of activated CD4+ T cells to the skin equivalents reduces the expression of important skin barrier and tight junction proteins. Western blot and relative protein expression semi-quantified by densitometry, as well as representative immunostaining of normal (FLG+) and filaggrin-deficient (FLG−) skin equivalents alone and after addition of activated CD4+ T cells for (a) filaggrin (FLG, red), (b) involucrin (IVL, green), (c) loricrin (LOR, green), (d) occludin (OCLN, green) and (e) claudin-1 (CLDN-1, red). Counterstained with DAPI (blue), scale bar = 100 μm. *Indicates statistically significant differences between FLG+ skin equivalents (*p ≤ 0.05), +indicates statistically significant differences between FLG− skin equivalents (+ p ≤ 0.05). (Mean ± SEM; n = 4).
Figure 3
Figure 3
The presence of CD4+ T cells disorders stratum corneum (SC) barrier lipids of normal (FLG+), but not filaggrin-deficient (FLG−), skin equivalents. (a,b) Infrared spectroscopy of isolated SC (spectra and wavenumbers of methylene asymmetric stretching vibration). (Mean ± SEM; n = 4). (ce) High-performance thin layer chromatography analysis of SC lipids (free fatty acids, ceramide subclasses and glucosylceramides) of FLG+ and FLG− skin equivalents with or without exposure to activated CD4+ T cells (mean ± SEM; n = 4). *Indicates statistically significant differences between FLG+ skin equivalents (*p ≤ 0.05, **p ≤ 0.01).
Figure 4
Figure 4
CD4+ T cell migration occurs exclusively in filaggrin-deficient (FLG−) skin equivalents. (a) Representative light microscopy picture of a FLG− skin equivalent containing migrated T cells attached to magnetic beads (arrows). (b) Corresponding immunostaining against CD4+ T cells (red), counterstained with DAPI (blue), scale bar = 100 µm. (c) Immunostaining against non-activated CD4+ T cells (red, arrows) in FLG− skin equivalents, counterstained with DAPI (blue). Representative light microscopy picture of (d) a normal (FLG+) skin equivalent and (e) FLG− skin equivalents generated from keratinocytes transfected with siRNA negative control after exposure to activated T cells (arrows, attached to magnetic beads; scale bar = 100 µm, SC = stratum corneum, VE = viable epidermis, D = dermis).
Figure 5
Figure 5
TSLP directly stimulates T cell migration in filaggrin-deficient (FLG−) skin equivalents. (a) Western blot and relative protein expression of TSLP in normal (FLG+) and FLG− skin equivalents before and after exposure to activated CD4+ T cells (mean ± SEM; n = 4), *indicates statistical significance over FLG+ skin equivalents (*p ≤ 0.05, **p ≤ 0.01). (b) Representative immunostains against TSLP (red) in FLG+ and FLG− skin equivalents (scale bar = 100 μm). (c) Representative light microscopy pictures of FLG− skin equivalents supplemented with activated CD4+ T cells (control) and with TSLPr antibody pre-incubated T cells (+TSLPr), scale bar = 100 µm. (d) Dermis equivalents, with and without topical application of 50 ng/ml TSLP, prior to T cell exposure (scale bar = 100 µm). (e) Representative dot plots from the flow cytometric transwell migration assay with non-activated and activated CD4+ T cells, incubated for 48 h with medium only (negative control), 30 ng/ml SDF-1α (positive control), and 50 ng/ml TSLP with and without pre-incubation with TSLPr antibody.
Figure 6
Figure 6
Impact of TSLP on the differentiation profile of activated CD4+ T cells. (a) Levels of IFN-γ, TNF-α, IL-22, IL-17A and IL-13 produced by activated CD4+ T cells (mean ± SEM; n = 3–5). (b–f) Respectively, release of, IFN-γ, TNF-α, IL-17A, IL-13 and IL-22 from activated CD4+ T cells alone (white bar) and after addition to FLG− skin equivalents (grey bar), relative to 106 CD4+ T cells (mean ± SEM; n = 3–5; *p ≤ 0.05, **p ≤ 0.01). (g–j) Respectively, relative mRNA expression of T cell master regulators TBX21 (Th1), GATA3 (Th2), RORC (Th17) and AHR (Th22).

References

    1. Pickett K, Frampton G, Loveman E. Education to improve quality of life of people with chronic inflammatory skin conditions: a systematic review of the evidence. Br J Dermatol. 2016;174:1228–1241. doi: 10.1111/bjd.14435. - DOI - PubMed
    1. Bieber T. Atopic dermatitis. N Engl J Med. 2008;358:1483–1494. doi: 10.1056/NEJMra074081. - DOI - PubMed
    1. Novak N, Leung DY. Advances in atopic dermatitis. Curr Opin Immunol. 2011;23:778–783. doi: 10.1016/j.coi.2011.09.007. - DOI - PMC - PubMed
    1. Proksch E, Fölster-Holst R, Jensen JM. Skin barrier function, epidermal proliferation and differentiation in eczema. J Dermatol Sci. 2006;43:159–169. doi: 10.1016/j.jdermsci.2006.06.003. - DOI - PubMed
    1. Janssens M, et al. Lamellar lipid organization and ceramide composition in the stratum corneum of patients with atopic eczema. J Invest Dermatol. 2011;131:2136–2138. doi: 10.1038/jid.2011.175. - DOI - PubMed

Publication types

MeSH terms