

A Quantitative Approach to Predict Differential Effects of Anti-VEGF Treatment on Diffuse and Focal Leakage in Patients with Diabetic Macular Edema: A Pilot Study
- PMID: 28377846
- PMCID: PMC5374879
- DOI: 10.1167/tvst.6.2.7
A Quantitative Approach to Predict Differential Effects of Anti-VEGF Treatment on Diffuse and Focal Leakage in Patients with Diabetic Macular Edema: A Pilot Study
Abstract
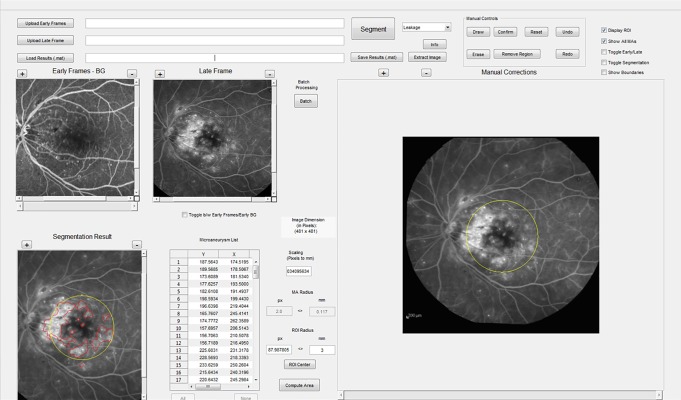
Purpose: We use semiautomated segmentation of fluorescein angiography (FA) to determine whether anti-vascular endothelial growth factor (VEGF) treatment for diabetic macular edema (DME) differentially affects microaneurysm (MA)-associated leakage, termed focal leakage, versus non-MA-associated leakage, termed diffuse leakage.
Methods: We performed a retrospective study of 29 subjects treated with at least three consecutive injections of anti-VEGF agents for DME (mean 4.6 injections; range, 3-10) who underwent Heidelberg FA before and after anti-VEGF therapy. Inclusion criteria were macula center involving DME and at least 3 consecutive anti-VEGF injections. Exclusion criteria were macular edema due to cause besides DME, anti-VEGF within 3 months of initial FA, concurrent treatment for DME besides anti-VEGF, and macular photocoagulation within 1 year. At each time point, total leakage was semiautomatically segmented using a modified version of our previously published software. Microaneurysms were identified by an expert grader and leakage within a 117 μm radius of each MA was classified as focal leakage. Remaining leakage was classified as diffuse leakage. The absolute and percent changes in total, diffuse, and focal leakage were calculated for each subject.
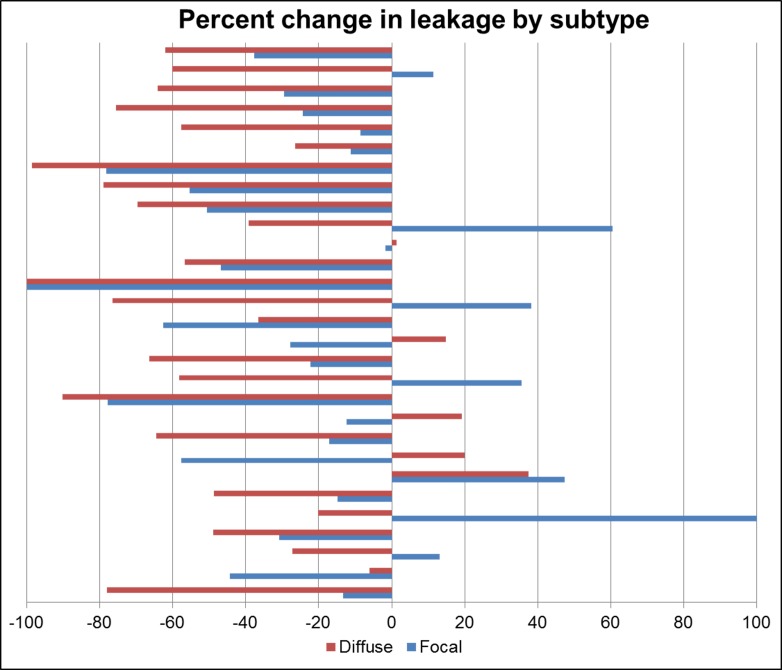
Results: Mean pretreatment total leakage was 8.2 mm2 and decreased by a mean of 40.1% (P < 0.0001; 95% confidence interval [CI], [-28.6, -52.5]) following treatment. Diffuse leakage decreased by a mean of 45.5% (P < 0.0001; 95% CI, [-31.3, -59.6]) while focal leakage decreased by 17.9% (P = 0.02; 95% CI, [-1.0, -34.8]). The difference in treatment response between focal and diffuse leakage was statistically significant (P = 0.01).
Conclusions: Anti-VEGF treatment for DME results in decreased diffuse leakage but had relatively little effect on focal leakage as assessed by FA. This suggests that diffuse leakage may be a marker of VEGF-mediated pathobiology. Patients with predominantly focal leakage may be less responsive to anti-VEGF therapy.
Translational relevance: Fluorescein angiography can define focal and diffuse subtypes of diabetic macular edema and these may respond differently to anti-VEGF treatment.
Keywords: anti-VEGF; diabetic macular edema; fluorescein angiography; image segmentation.
Figures

References
-
- Shaw JE,, Sicree RA,, Zimmet PZ. Global estimates of the prevalence of diabetes for 2010 and 2030. Diabetes Res Clin Pract. 2010. ; 87: 4–14. - PubMed
-
- Klein BEK. Overview of epidemiologic studies of diabetic retinopathy. Ophthalmic Epidemiol. 14: 179–183. - PubMed
-
- Stitt AW,, Curtis TM,, Chen M,, et al. The progress in understanding and treatment of diabetic retinopathy. Prog Retin Eye Res. 2016. ; 51: 156–186. - PubMed
-
- Reichenbach A,, Wurm A,, Pannicke T,, Iandiev I,, Wiedemann P,, Bringmann A. Müller cells as players in retinal degeneration and edema. Graefes Arch Clin Exp Ophthalmol. 2007. ; 245: 627–636. - PubMed
Grants and funding
LinkOut - more resources
Full Text Sources
Other Literature Sources
