

Automatic determination of cardiovascular risk by CT attenuation correction maps in Rb-82 PET/CT
- PMID: 28378112
- PMCID: PMC5628109
- DOI: 10.1007/s12350-017-0866-3
Automatic determination of cardiovascular risk by CT attenuation correction maps in Rb-82 PET/CT
Erratum in
-
Erratum to: Automatic determination of cardiovascular risk by CT attenuation correction maps in Rb-82 PET/CT.J Nucl Cardiol. 2018 Dec;25(6):2143. doi: 10.1007/s12350-017-0946-4. J Nucl Cardiol. 2018. PMID: 28589378 Free PMC article.
Abstract
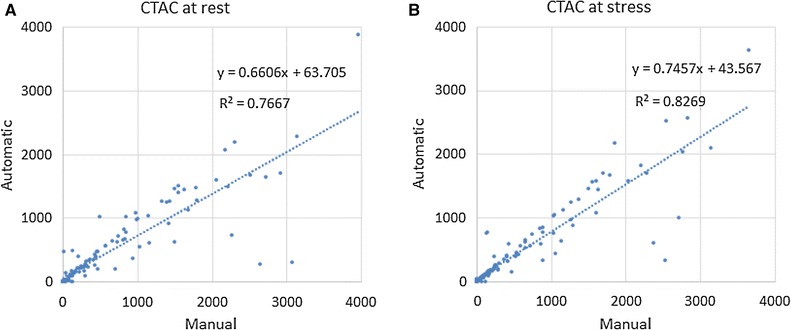
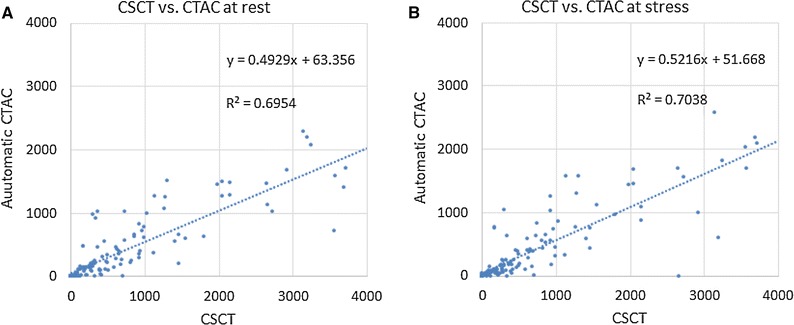
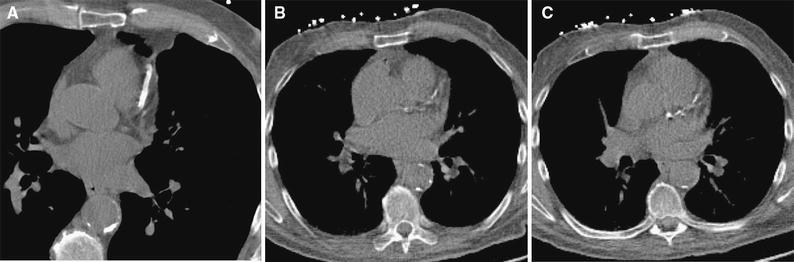
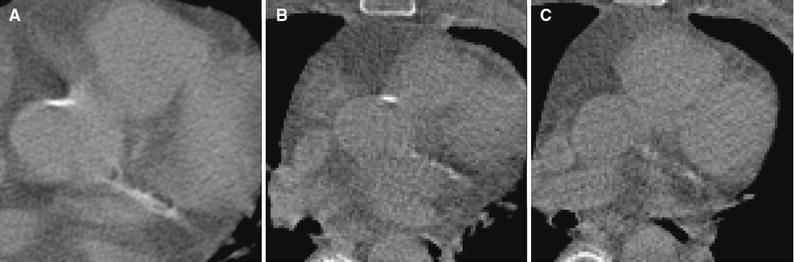
Background: We investigated fully automatic coronary artery calcium (CAC) scoring and cardiovascular disease (CVD) risk categorization from CT attenuation correction (CTAC) acquired at rest and stress during cardiac PET/CT and compared it with manual annotations in CTAC and with dedicated calcium scoring CT (CSCT).
Methods and results: We included 133 consecutive patients undergoing myocardial perfusion 82Rb PET/CT with the acquisition of low-dose CTAC at rest and stress. Additionally, a dedicated CSCT was performed for all patients. Manual CAC annotations in CTAC and CSCT provided the reference standard. In CTAC, CAC was scored automatically using a previously developed machine learning algorithm. Patients were assigned to a CVD risk category based on their Agatston score (0, 1-10, 11-100, 101-400, >400). Agreement in CVD risk categorization between manual and automatic scoring in CTAC at rest and stress resulted in Cohen's linearly weighted κ of 0.85 and 0.89, respectively. The agreement between CSCT and CTAC at rest resulted in κ of 0.82 and 0.74, using manual and automatic scoring, respectively. For CTAC at stress, these were 0.79 and 0.70, respectively.
Conclusion: Automatic CAC scoring from CTAC PET/CT may allow routine CVD risk assessment from the CTAC component of PET/CT without any additional radiation dose or scan time.
Keywords: Automatic calcium scoring; CT attenuation correction map; cardiac CT; cardiovascular risk; coronary calcium.
Conflict of interest statement
I. Išgum and T. Leiner have received a research grant on cardiovascular image analysis funded by Pie Medical Imaging and research grants with participation of Pie Medical Imaging, 3Mensio Medical Imaging and Philips Healthcare.
Figures
Comment in
-
Coronary calcium scoring of CT attenuation correction scans: Automatic, manual, or visual?J Nucl Cardiol. 2018 Dec;25(6):2144-2147. doi: 10.1007/s12350-017-0995-8. Epub 2017 Jul 24. J Nucl Cardiol. 2018. PMID: 28741065 No abstract available.
Similar articles
-
Automated cardiovascular risk categorization through AI-driven coronary calcium quantification in cardiac PET acquired attenuation correction CT.J Nucl Cardiol. 2023 Jun;30(3):955-969. doi: 10.1007/s12350-022-03047-9. Epub 2022 Jul 18. J Nucl Cardiol. 2023. PMID: 35851642 Free PMC article.
-
The prognostic value of visual and automatic coronary calcium scoring from low-dose computed tomography-[15O]-water positron emission tomography.Eur Heart J Cardiovasc Imaging. 2024 Aug 26;25(9):1186-1196. doi: 10.1093/ehjci/jeae081. Eur Heart J Cardiovasc Imaging. 2024. PMID: 38525588 Free PMC article.
-
Single low-dose CT scan optimized for rest-stress PET attenuation correction and quantification of coronary artery calcium.J Nucl Cardiol. 2015 Jun;22(3):419-28. doi: 10.1007/s12350-014-0026-y. Epub 2014 Nov 20. J Nucl Cardiol. 2015. PMID: 25410469
-
Reproducibility of quantitative coronary calcium scoring from PET/CT attenuation maps: comparison to ECG-gated CT scans.Eur J Nucl Med Mol Imaging. 2022 Oct;49(12):4122-4132. doi: 10.1007/s00259-022-05866-x. Epub 2022 Jun 25. Eur J Nucl Med Mol Imaging. 2022. PMID: 35751666 Free PMC article.
-
Agreement of visual estimation of coronary artery calcium from low-dose CT attenuation correction scans in hybrid PET/CT and SPECT/CT with standard Agatston score.J Am Coll Cardiol. 2010 Nov 30;56(23):1914-21. doi: 10.1016/j.jacc.2010.05.057. J Am Coll Cardiol. 2010. PMID: 21109114 Free PMC article.
Cited by
-
Artificial Intelligence Will Transform Cardiac Imaging-Opportunities and Challenges.Front Cardiovasc Med. 2019 Sep 10;6:133. doi: 10.3389/fcvm.2019.00133. eCollection 2019. Front Cardiovasc Med. 2019. PMID: 31552275 Free PMC article. Review.
-
Automated vessel-specific coronary artery calcification quantification with deep learning in a large multi-centre registry.Eur Heart J Cardiovasc Imaging. 2024 Jun 28;25(7):976-985. doi: 10.1093/ehjci/jeae045. Eur Heart J Cardiovasc Imaging. 2024. PMID: 38376471 Free PMC article.
-
Review of cardiovascular imaging in the Journal of Nuclear Cardiology 2018. Part 1 of 2: Positron emission tomography, computed tomography, and magnetic resonance.J Nucl Cardiol. 2019 Apr;26(2):524-535. doi: 10.1007/s12350-018-01558-y. Epub 2019 Jan 2. J Nucl Cardiol. 2019. PMID: 30603892 Review.
-
Calcium scoring in low-dose ungated chest CT scans using convolutional long-short term memory networks.Proc SPIE Int Soc Opt Eng. 2022 Feb-Mar;12032:120323A. doi: 10.1117/12.2613147. Epub 2022 Apr 4. Proc SPIE Int Soc Opt Eng. 2022. PMID: 36277935 Free PMC article.
-
Artificial Intelligence in Cardiovascular Imaging for Risk Stratification in Coronary Artery Disease.Radiol Cardiothorac Imaging. 2021 Feb 25;3(1):e200512. doi: 10.1148/ryct.2021200512. eCollection 2021 Feb. Radiol Cardiothorac Imaging. 2021. PMID: 33778661 Free PMC article. Review.
References
-
- Brodov Y, Gransar H, Dey D, Shalev A, Germano G, Friedman JD, et al. Combined quantitative assessment of myocardial perfusion and coronary artery calcium score by hybrid 82Rb PET/CT improves detection of coronary artery disease. J Nucl Med. 2015;56:1345–1350. doi: 10.2967/jnumed.114.153429. - DOI - PubMed
-
- Einstein AJ, Johnson LL, Bokhari S, Son J, Thompson RC, Bateman TM, et al. Agreement of visual estimation of coronary artery calcium from low-dose CT attenuation correction scans in hybrid PET/CT and SPECT/CT with standard Agatston score. J Am Coll Cardiol. 2010;56:1914–1921. doi: 10.1016/j.jacc.2010.05.057. - DOI - PMC - PubMed
Publication types
MeSH terms
Substances
Grants and funding
LinkOut - more resources
Full Text Sources
Other Literature Sources
