

Relationship among LRP1 expression, Pyk2 phosphorylation and MMP-9 activation in left ventricular remodelling after myocardial infarction
- PMID: 28378397
- PMCID: PMC5571517
- DOI: 10.1111/jcmm.13113
Relationship among LRP1 expression, Pyk2 phosphorylation and MMP-9 activation in left ventricular remodelling after myocardial infarction
Abstract
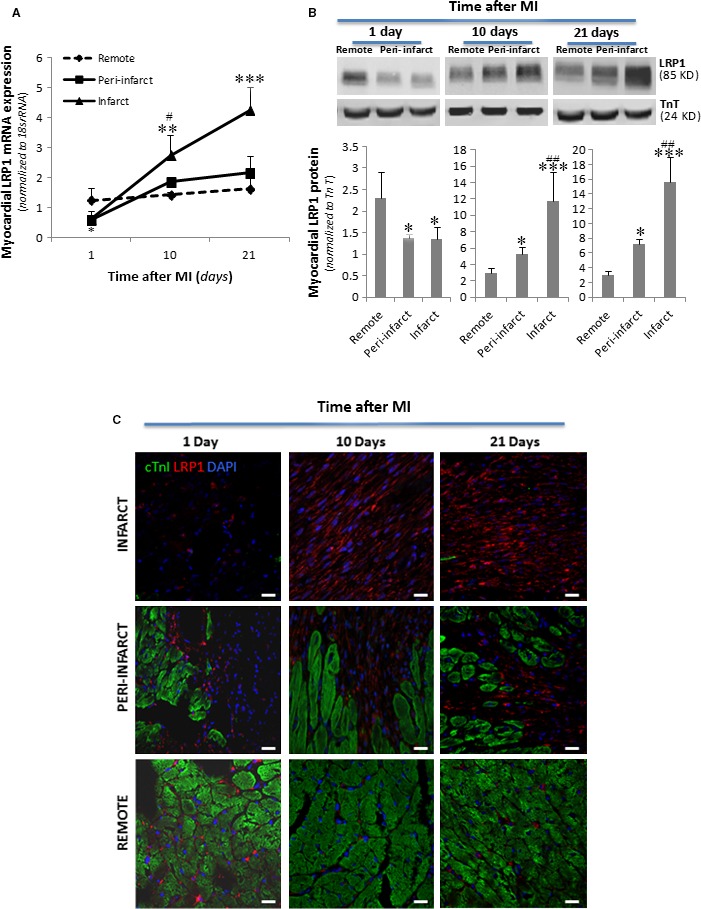
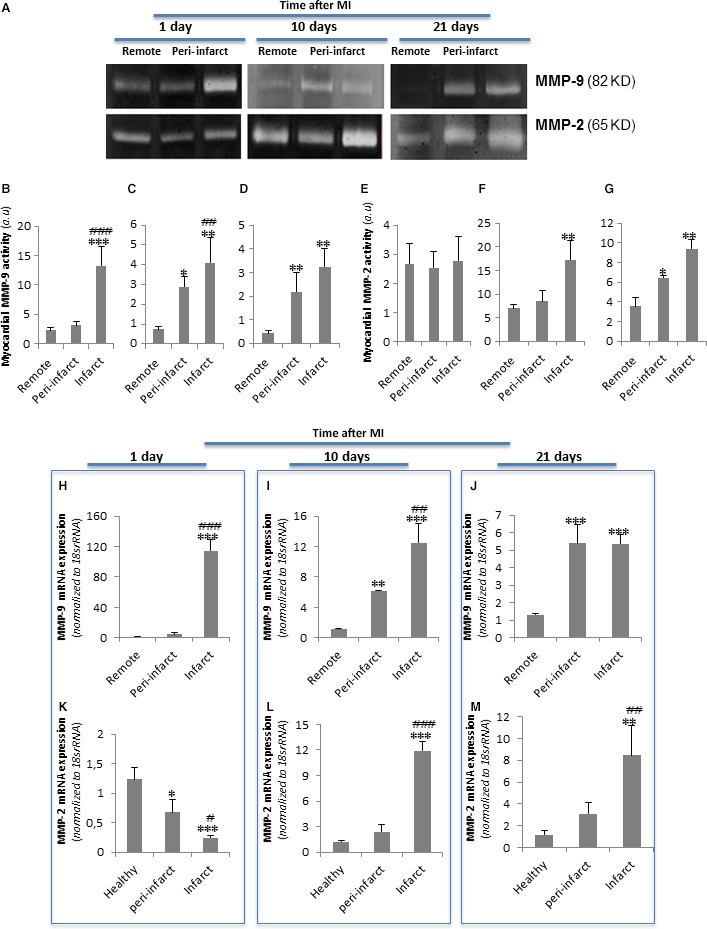
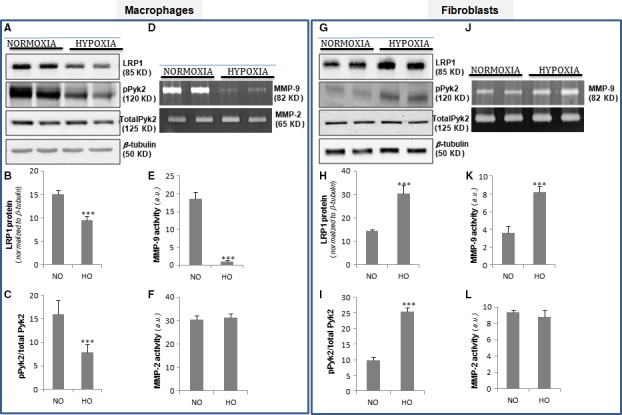
Left ventricular (LV) remodelling after myocardial infarction (MI) is a crucial determinant of the clinical course of heart failure. Matrix metalloproteinase (MMP) activation is strongly associated with LV remodelling after MI. Elucidation of plasma membrane receptors related to the activation of specific MMPs is fundamental for treating adverse cardiac remodelling after MI. The aim of current investigation was to explore the potential association between the low-density lipoprotein receptor-related protein 1 (LRP1) and MMP-9 and MMP-2 spatiotemporal expression after MI. Real-time PCR and Western blot analyses showed that LRP1 mRNA and protein expression levels, respectively, were significantly increased in peri-infarct and infarct zones at 10 and 21 days after MI. Confocal microscopy demonstrated high colocalization between LRP1 and the fibroblast marker vimentin, indicating that LRP1 is mostly expressed by cardiac fibroblasts in peri-infarct and infarct areas. LRP1 also colocalized with proline-rich tyrosine kinase 2 (pPyk2) and MMP-9 in cardiac fibroblasts in ischaemic areas at 10 and 21 days after MI. Cell culture experiments revealed that hypoxia increases LRP1, pPyk2 protein levels and MMP-9 activity in fibroblasts, without significant changes in MMP-2 activity. MMP-9 activation by hypoxia requires LRP1 and Pyk2 phosphorylation in fibroblasts. Collectively, our in vivo and in vitro data support a major role of cardiac fibroblast LRP1 levels on MMP-9 up-regulation associated with ventricular remodelling after MI.
Keywords: LRP1; MMP-9; cardiac remodelling; myocardial infarction; pPyk2.
© 2017 The Authors. Journal of Cellular and Molecular Medicine published by John Wiley & Sons Ltd and Foundation for Cellular and Molecular Medicine.
Figures


Similar articles
-
Hypoxia induces metalloproteinase-9 activation and human vascular smooth muscle cell migration through low-density lipoprotein receptor-related protein 1-mediated Pyk2 phosphorylation.Arterioscler Thromb Vasc Biol. 2013 Dec;33(12):2877-87. doi: 10.1161/ATVBAHA.113.302323. Epub 2013 Sep 26. Arterioscler Thromb Vasc Biol. 2013. PMID: 24072693
-
Hypoxia-driven sarcoplasmic/endoplasmic reticulum calcium ATPase 2 (SERCA2) downregulation depends on low-density lipoprotein receptor-related protein 1 (LRP1)-signalling in cardiomyocytes.J Mol Cell Cardiol. 2015 Aug;85:25-36. doi: 10.1016/j.yjmcc.2015.04.028. Epub 2015 May 9. J Mol Cell Cardiol. 2015. PMID: 25968337
-
Possible mechanism by which renal sympathetic denervation improves left ventricular remodelling after myocardial infarction.Exp Physiol. 2016 Feb;101(2):260-71. doi: 10.1113/EP085302. Epub 2015 Dec 16. Exp Physiol. 2016. PMID: 26556551
-
MMP-9 signaling in the left ventricle following myocardial infarction.Am J Physiol Heart Circ Physiol. 2016 Jul 1;311(1):H190-8. doi: 10.1152/ajpheart.00243.2016. Epub 2016 May 20. Am J Physiol Heart Circ Physiol. 2016. PMID: 27208160 Free PMC article. Review.
-
Infarct in the Heart: What's MMP-9 Got to Do with It?Biomolecules. 2021 Mar 25;11(4):491. doi: 10.3390/biom11040491. Biomolecules. 2021. PMID: 33805901 Free PMC article. Review.
Cited by
-
Role of the LRP1-pPyk2-MMP9 pathway in hyperoxia-induced lung injury in neonatal rats.Zhongguo Dang Dai Er Ke Za Zhi. 2021 Dec 15;23(12):1289-1294. doi: 10.7499/j.issn.1008-8830.2108125. Zhongguo Dang Dai Er Ke Za Zhi. 2021. PMID: 34911615 Free PMC article. Chinese, English.
-
Developing LRP1 Agonists into a Therapeutic Strategy in Acute Myocardial Infarction.Int J Mol Sci. 2019 Jan 28;20(3):544. doi: 10.3390/ijms20030544. Int J Mol Sci. 2019. PMID: 30696029 Free PMC article. Review.
-
Inhibition of Pyk2 Improves Cx43 Intercalated Disc Localization, Infarct Size, and Cardiac Function in Rats With Heart Failure.Circ Heart Fail. 2023 Aug;16(8):e010294. doi: 10.1161/CIRCHEARTFAILURE.122.010294. Epub 2023 Jul 19. Circ Heart Fail. 2023. PMID: 37465947 Free PMC article.
-
Functions for platelet factor 4 (PF4/CXCL4) and its receptors in fibroblast-myofibroblast transition and fibrotic failure of arteriovenous fistulas (AVFs).J Vasc Access. 2024 Nov;25(6):1911-1924. doi: 10.1177/11297298231192386. Epub 2023 Aug 17. J Vasc Access. 2024. PMID: 37589266 Free PMC article.
-
Insights of Chinese medicine on ventricular remodeling: Multiple-targets, individualized-treatment.Chin J Integr Med. 2017 Sep;23(9):643-647. doi: 10.1007/s11655-017-2415-y. Epub 2017 Sep 2. Chin J Integr Med. 2017. PMID: 28861886 Review.
References
-
- Drazner MH, Rame JE, Marino EK, et al Increased left ventricular mass is a risk factor for the development of a depressed left ventricular ejection fraction within five years: the Cardiovascular Health Study. J Am Coll Cardiol. 2004; 43: 2207–15. - PubMed
-
- Mann DL, Bristow MR. Mechanisms and models in heart failure: the biomechanical model and beyond. Circulation. 2005; 111: 2837–49. - PubMed
-
- Pfeffer MA, Braunwald E. Ventricular remodeling after myocardial infarction. Experimental observations and clinical implications. Circulation. 1990; 81: 1161–72. - PubMed
-
- Opie LH, Commerford PJ, Gersh BJ, et al Controversies in ventricular remodelling. Lancet. 2006; 367: 356–67. - PubMed
MeSH terms
Substances
LinkOut - more resources
Full Text Sources
Other Literature Sources
Medical
Research Materials
Miscellaneous
