. 2017 Apr 5:8:14802.
doi: 10.1038/ncomms14802.

A CD47-associated super-enhancer links pro-inflammatory signalling to CD47 upregulation in breast cancer

Affiliations

A CD47-associated super-enhancer links pro-inflammatory signalling to CD47 upregulation in breast cancer

Paola A Betancur et al. Nat Commun. .

Abstract

CD47 is a cell surface molecule that inhibits phagocytosis of cells that express it by binding to its receptor, SIRPα, on macrophages and other immune cells. CD47 is expressed at different levels by neoplastic and normal cells. Here, to reveal mechanisms by which different neoplastic cells generate this dominant 'don't eat me' signal, we analyse the CD47 regulatory genomic landscape. We identify two distinct super-enhancers (SEs) associated with CD47 in certain cancer cell types. We show that a set of active constituent enhancers, located within the two CD47 SEs, regulate CD47 expression in different cancer cell types and that disruption of CD47 SEs reduces CD47 gene expression. Finally we report that the TNF-NFKB1 signalling pathway directly regulates CD47 by interacting with a constituent enhancer located within a CD47-associated SE specific to breast cancer. These results suggest that cancers can evolve SE to drive CD47 overexpression to escape immune surveillance.


Conflict of interest statement

I.L.W. is co-founder, holds equity and is a Director and consultant of Forty Seven, Inc, a company developing CD47 antibody therapies. All other authors declare no competing financial interests.

Figures

Figure 1
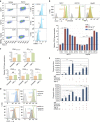
Figure 1. H3K27ac ChIP-Seq profiling reveals upstream and downstream CD47 super-enhancers.
(a) Heat map representing H3K27ac enrichment (grey to dark grey) across different cancer lines shows that T-ALL lines (RPMI-8402, Jurkat and MOLT3), the DLBCL line, LY4 and breast cancer lines (HCC1954 and MCF7) have SEs (red lines on top) associated with CD47. Green blocks: represent functional E5, E3.2 and E7 constituent enhancers from left to right respectively. (b) H3K27ac enrichment (y axis) shows that a downstream SE (red line on top) is associated with CD47 in an ER+ PR+ breast tumour sample (PDX1). Three other triple negative (TN=PR−, ER− and Her2−) breast tumour samples (PDX2-4) shown H3k27ac enrichment in the CD47 locus, but these genomic regions do not qualify as SEs. Right panel: H3K27ac ChIP-Seq binding profiles show typical enhancers at the KIT gene for size comparison between SEs and typical enhancers. Green blocks: represents the functional E5 constituent enhancer. Scale bars:10 kb.
Figure 2
Figure 2. Identification and characterization of CD47 SEs constituent enhancers.
(a) In MCF7 cells, specific EGFP reporter expression was activated by the E5 (right panel) CD47 constituent enhancer region but not by E3.2 (middle panel) or others. (b) In Jurkat cells, specific EGFP reporter expression was activated by the E3.2 constituent enhancer (middle panel) but not by E5 (right panel) or others. (c) Neither E5 (right panel) nor E3.2 (middle panel) constituent enhancers activate reporter expression in HepG2 cells. Control cells transduced with the lentiviral cassette containing the thymidine kinase (TK) minimal promoter only (left panels, ac). (d) E7 activates EGFP reporter expression in all the cancer cell lines tested, including the HepG2 negative control. Grey images (ad) are corresponding bright field micrographs. Histograms show the mean of EGFP reporter signal measured by flow cytometry. Grey histograms (ad) are the fluorescence minus one (FMO) controls. Scale bars: 100 μm.
Figure 3
Figure 3. NFKB1 candidate transcription factor regulates CD47 expression in breast cancer cells.
(a) A protein-DNA binding profiling assay reveals that transcription factors NFAT, NFKB, PPAR, SMAD, STAT3, STAT5 and STAT6 bind significantly to E5 in MCF7 (blue bars) and not in HepG2 cells (red bars). Nuclear extract from MCF7 and HepG2 were incubated with a plate array containing oligos encoding consensus sites for well-characterized transcription factors. A competition assay was performed by incubating the nuclear extract with the E5 DNA fragment and the consensus sites oligos simultaneously. Final RLU (binding of each transcription factor to CD47 E5) was calculated as follows: the average relative luminescence units (RLU) produced by the binding of each transcription factor to the consensus probes when outcompeted with the E5 DNA fragment (binding competition) was subtracted from the average RLU produced by the binding of each transcription factor to the consensus sites probes only (control). Thus, binding of transcription factors to the E5 DNA fragment and not to the consensus sites probes is represented by an increase in RLU while binding to the consensus sites probes and not to E5 is represented by a no change or decrease in RLU. The binding to E5 of each transcription factor obtained from the MCF7 nuclear extract was compared to the binding to E5 of each transcription factor obtained from HepG2 nuclear extract. N=4 samples. Values represent mean±s.d. Student's unpaired t-test for independent samples was performed. **P<0.01, *P<0.05. (b) Knocking down NFKB1 and PPARα by shRNAs reduces CD47 gene expression more than knocking down other candidate transcription factors in the breast cancer cell line MCF7. N=5 samples. Values represent mean+s.d. Student's unpaired t-test for independent samples was performed. ***P<0.005, *P<0.05. (c) Flow cytometry analyses show that CD47 cell surface protein levels are reduced after knocking down NFKB1 (red histogram) in MCF7 cells. Grey histogram is the FMO control.
Figure 4
Figure 4. Regulatory activity of CD47 E5 constituent is abolished by deleting a region containing an NFKB1 binding motif.
(a) Schematic representation showing the location for NFYA, ESRs, SPT23 and NFKB transcription factor binding sites (black bars) within CD47 SE E5 constituent (black block), predicted by PIQ. H3K4Me1 and H3K27ac ChIP-Seq data publicly available for seven different cell lines (coloured peaks) mark regions of open chromatin. (b) Deletion of a fragment containing the NFKB1 binding motif (E5Δ400 bp) within CD47 SE E5 constituent abolishes enhancer activity, while a 276 bp deletion excluding the NFKB1 motif (E5Δ276 bp) did not have any effect on E5 enhancer activity. However, a 400 bp fragment containing the NFKB1 binding motif (E5V400 bp) alone did not have enhancing activity. Scale bar: 100 μm.
Figure 5
Figure 5. NFKB1 knockdown reduces CD47 expression, decreases tumour size and increases phagocytosis of breast cancer cells.
(a) NFKB1 shRNA reduces the size of breast tumours derived from MCF7-Luc in xenotransplants (red dots). N=5 samples. Values represent mean±s.e.m. Student's unpaired t-test for independent samples was performed. **P<0.01. Black dots: Control shRNA treated breast tumours derived from MCF7-Luc in xenotransplants. (b) Upper panels: Images of tumours 6 weeks after injection of MCF7 cells that were: untreated (control; left); infected with turboRFP-control shRNA (middle); or infected with turboRFP-NFKB1 shRNA (right). NFKB1 knockdown led to smaller tumour sizes. Scale bar: 500 μm. Lower panels: flow cytometry analysis of cells from dissociated tumours that had grown for 6 weeks. Left panel: TurboRFP (reporter) expression levels are similar in cells treated with turboRFP-control shRNA (yellow) versus turboRFP-NFKB1 shRNA (pink). Orange histogram shows overlap. Right panel: CD47 protein levels are lower on cells in tumours generated from MCF7 cells with NFKB1 knockdown (red) versus those without knockdown (controls with no shRNA (turquoise) or with control shRNA (orange)). CD47 expression is slightly higher in MCF7 cells infected with control shRNA than in uninfected MCF7, because any intracellular infection leads to an increased CD47 expression. Grey histograms are the FMO controls. (c) Phagocytic index of MCF7 cells is increased over control levels (empty vector lacking shRNA) by anti-CD47 blocking antibody (CD47α), NFKB1 shRNA infection, and more so by NFKB1 shRNA infection followed by anti-CD47 treatment. N=3 samples. Values represent mean±s.d. Student's unpaired t-test for independent samples was performed. **P<0.0025 when compared to Control shRNA, ***P<0.0010, ****P<0.0005. (d) Inhibiting the binding of BRD4 to SEs by using JQ1 (1 μM) reduces CD47 expression over time in MCF7 breast cancer cells. N=3 samples. Values represent mean+s.d. Student's unpaired t-test for independent samples was performed. *P<0.05, **P<0.01.
Figure 6
Figure 6. The TNF inflammatory pathway affects phagocytosis of breast cancer cells through the regulation of CD47 expression.
(a) Flow cytometry analysis showing TNFR1 expression in the breast cancer line MCF7 (CD47Hi), non-tumorigenic breast line MCF10 (CD47Med) and HepG2 (CD47Lo) hepatoma cancer line shows that TNFR1 expression is higher in the MCF7 breast cancer cells. Mean values of TNFR1-FITC fluorescence are shown in blue to the right of each grey histogram. Grey histograms represent FMO controls. (b) Upper figure: A greater increase in CD47 expression is observed in MCF7 when compared to MCF10 or HepG2 cell lines after stimulation with TNF-α (green histogram). Mean values of CD47-APC are shown next to each histogram. Lower figure: Increase in CD47 transcript expression begins to occur after 8 h in MCF7 cells and after 24 h in HepG2 cells upon TNF-α stimulation. N=3 samples. Values represent mean+s.d. Student's unpaired t-test for independent samples was performed. ***P<0.001. (c) Treating patient-derived xenografted (PDX) and primary patient (PP) breast tumour cells with TNF-α significantly increases CD47 gene expression in four out of five breast tumour samples. Values represent mean+s.d. Student's unpaired t-test for independent samples was performed. ***P<0.001, **P<0.01, *P<0.1. NS=not significant. ER+ PR+=oestrogen and progesterone positive; TN=triple negative. (d) Upper panels: Blocking TNF-α with infliximab reduces CD47 expression regardless of TNF-α stimulation. Lower panels: Blocking TNF-α with infliximab while knocking down NFKB1 causes a greater reduction on CD47 expression regardless of TNF-α stimulation. (e) Treating MCF7 with infliximab increases phagocytosis of the cancer cells, and, to a greater extent, if infliximab is combined with CD47 blocking antibody. A more pronounced increase in phagocytosis of the cancer cells was observed for MCF7 cells that have NFKB1 knockdown and were treated with the infliximab and CD47 antibodies combined. N=6 samples. Values represent mean+s.d. ****P<0.0005, ***P<0.001, **P<0.05, *P=0.15 (upper figure), *P=0.20 (bottom figure).
Figure 7
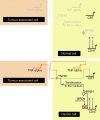
Figure 7. Schematic model representing how CD47 transcriptional expression is regulated during inflammation in cancer.
The TNF pathway activates the translocation to the nucleus of NFKB1. Upstream unknown factors, bind to closed DNA, making SE constituents accessible to NFKB1 binding, which in turn activate SEs and recruit BRD4 to these SEs promoting the interaction between the distal SE(s) and the promoter of the gene to initiate transcription. Dotted lines indicate indirect interactions while solid lines indicate direct interactions.

Comment in

References

    1. Oldenborg P. A. CD47: a cell surface glycoprotein which regulates multiple functions of hematopoietic cells in health and disease. ISRN Hematol. 2013, 614619 (2013). - PMC - PubMed
    1. Jaiswal S. et al.. CD47 is upregulated on circulating hematopoietic stem cells and leukemia cells to avoid phagocytosis. Cell 138, 271–285 (2009). - PMC - PubMed
    1. Willingham S. B. et al.. The CD47-signal regulatory protein alpha (SIRPa) interaction is a therapeutic target for human solid tumors. Proc. Natl Acad. Sci. USA 109, 6662–6667 (2012). - PMC - PubMed
    1. Davidson E. H. Emerging properties of animal gene regulatory networks. Nature 468, 911–920 (2010). - PMC - PubMed
    1. Hnisz D. et al.. Convergence of developmental and oncogenic signaling pathways at transcriptional super-enhancers. Mol. Cell 58, 362–370 (2015). - PMC - PubMed

Publication types