. 2017 Apr 5:7:45505.
doi: 10.1038/srep45505.

Global evolutionary history and spatio-temporal dynamics of dengue virus type 2

Affiliations

Global evolutionary history and spatio-temporal dynamics of dengue virus type 2

Kaifa Wei et al. Sci Rep. .

Abstract

DENV-2 spread throughout the tropical and subtropical regions globally, which is implicated in deadly outbreaks of DHF and DSS. Since dengue cases have grown dramatically in recent years, about half of the world's population is now at risk. Our timescale analysis indicated that the most recent common ancestor existed about 100 years ago. The rate of nucleotide substitution was estimated to be 8.94 × 10⁻⁴ subs/site/year. Selection pressure analysis showed that two sites 160 and 403 were under positive selection, while E gene is mainly shaped by stronger purifying selection. BSP analysis showed that estimating effective population size from samples of sequences has undergone three obvious increases, additionally, Caribbean and Puerto Rico maintained higher levels of genetic diversity relative to other 6 representative geographical populations using GMRF method. The phylogeographic analysis indicated that two major transmission routes are from South America to Caribbean and East&SouthAsia to Puerto Rico. The trunk reconstruction confirmed that the viral evolution spanned 50 years occurred primarily in Southeast Asia and East&South Asia. In addition, phylogeographic association-trait analysis indicated that the viral phenotypes are highly correlated with phylogeny in Nicaragua and Puerto Rico (P < 0.05).


Conflict of interest statement

The authors declare no competing financial interests.

Figures

Figure 1
Figure 1. Maximum clade credibility tree from Bayesian analysis of Dengue type 2 viruses.
Maximum clade credibility (MCC) tree was constructed using BEAST program. Each branch is colour coded to indicate the posterior probability (PP) value, Blue bars at nodes indicate 95% highest probability density (HPD). The mean time to the most recent common ancestor (TMRCA) is shown in each principal node (mean and 95% HPD). Genotypes are indicated on the right. The part of pink shows the posterior probability densities for the estimated age of the most recent common ancestor. An identical MCC tree with strain names is shown in Fig. S3.
Figure 2
Figure 2. Mapping of positively selected and glycosylation sites on the E protein and TMRCA comparison and Root-to-tip regression of ML tree.
(a) Three-dimensional structure of E protein. Red indicates N-linked glycosylation sites; Orange indicates the O-linked glycosylation sites; Yellow indicates the positively selected amino-acid sites identified; Blue indicates the positive selected sites which is the same as previously reported. (b) Robustness of key parameter estimates to the choice of coalescent and molecular clock priors in Bayesian inference framework. Vertical boxes show mean parameter estimates and vertical bars represent the corresponding 95% confidence interval (CI). The red dashed lines represent the mean and 95% CIs of the parameter estimates. Horizontal axis shows the Tree Prior-Clock model. BSP, Bayesian skyline plot; EXPG, Exponential Growth; CON, Constant Size; ST, Strict Clock; EXP, Exponential relaxed clock; LOG, Lognormal relaxed clock. (c) Linear regression analysis of the root-to-tip regression of genetic distance against sampling dates for the E gene sequences.
Figure 3
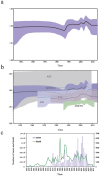
Figure 3. Evolutionary dynamics of dengue virus type 2.
(a) Bayesian skyline plot (BSP) shows the changes in effective population size of DENV-2 over time. The thick solid line indicates the median estimates, and the purple area displays the 95% HPD. (b) Comparison of Bayesian skyline plot between DENV-2 and each genotype. The median estimates are represented by the solid lines and 95% high posterior densities are shown in the color regions. AS1, Asian 1; AS2, Asian 2; AM/AS, American/Asian; Cos, Cosmopolitan. (c) The number of confirmed dengue cases (purple bars), and the number of human death (green lines) of DENV in global during 1955–2011.
Figure 4
Figure 4. Comparative phylogenetic analyses and population dynamics of Dengue virus type 2 circulating in different geographical regions, 1964–2013.
Phylogenies were inferred using the uncorrelated exponential relaxed clock model, and relative genetic diversity was estimated using the Gaussian Markov Random Field (GMRF) model. The x-axis is in units of year, and the y-axis represents the logarithmic scale of Neτ (where Ne is the effective population size and τ is the generation time).
Figure 5
Figure 5
Spatial-temporal diffusion of Dengue type 2 virus. Distributions of temporal-spatial diffusion pathways and histograms of total number of state transitions using “Markov Jump” model for (a,b) 1964–2013, (c,d) 1964–1990, (e,f) 1991–2000, (g,h) 2001–2013. Significant pathways from one location to another are indicated on the maps. Pink arrow represents very strongly supported rate with BF ≥ 1,000; Blue arrow represents strongly supported rate with 100 ≤ BF < 1,000; Dark green arrow, supported rate with 3 ≤ BF < 100; Orange arrow represents the support with BF > 3. BR, Brazil; ESA, East&South Asia; NI, Nicaragua; CA, Caribbean; SA, South America; SEA, Southeast Asia; PR, Puerto Rico; VN, Viet Nam. The map source is downloaded freely from FREE WORLD MAPS (http://www.freeworldmaps.net/pdf/world/miller-world.pdf).
Figure 6
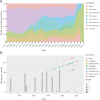
Figure 6. The geographic location of the trunk estimated for each location over time.
(a) The trunk reward proportion for each geographic location from 1964 to 2013. Shaded areas represent the trunk proportions over time for the eight geographical locations. (b) Distance to the trunk measured in terms of years. Scatter plot represents the distance to trunk of the tree. With the sample size increasing, the dot size becomes larger. The height of each point on the y-axis shows the mean distance to the trunk and the bars identify the closest strain to the trunk every three years. Bars are colored according to eight sampled regions.

References

    1. Mustafa M. S., Rasotgi V., Jain S. & Gupta V. Discovery of fifth serotype of dengue virus (DENV-5): A new public health dilemma in dengue control. Medical journal, Armed Forces India 71, 67–70 (2015). - PMC - PubMed
    1. Kumar S. R. et al.. Evolution, dispersal and replacement of American genotype dengue type 2 viruses in India (1956–2005): selection pressure and molecular clock analyses. Journal of General Virology 91, 707–720 (2010). - PubMed
    1. Fatima Z. et al.. Serotype and genotype analysis of dengue virus by sequencing followed by phylogenetic analysis using samples from three mini outbreaks-2007–2009 in Pakistan. BMC microbiology 11, 200 (2011). - PMC - PubMed
    1. Guzman M. G., Alvarez M. & Halstead S. B. Secondary infection as a risk factor for dengue hemorrhagic fever/dengue shock syndrome: an historical perspective and role of antibody-dependent enhancement of infection. Archives of virology 158, 1445–1459 (2013). - PubMed
    1. Bhoomiboonchoo P. et al.. Sequential dengue virus infections detected in active and passive surveillance programs in Thailand, 1994-2010. BMC public health 15, 1 (2015). - PMC - PubMed

Publication types