. 2017 Apr 5:8:14805.
doi: 10.1038/ncomms14805.

Constitutive smooth muscle tumour necrosis factor regulates microvascular myogenic responsiveness and systemic blood pressure

Affiliations

Constitutive smooth muscle tumour necrosis factor regulates microvascular myogenic responsiveness and systemic blood pressure

Jeffrey T Kroetsch et al. Nat Commun. .

Abstract

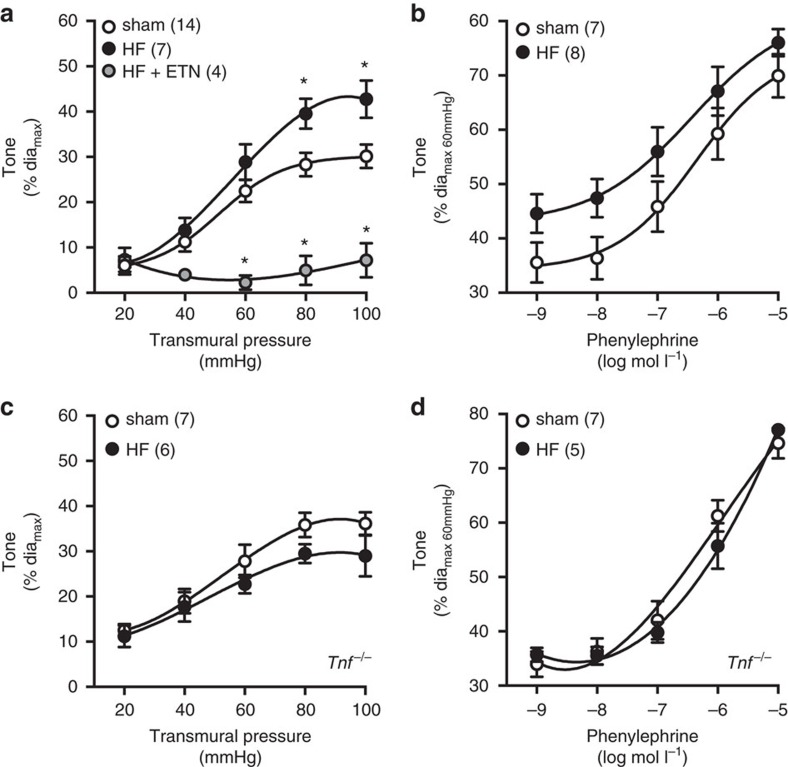
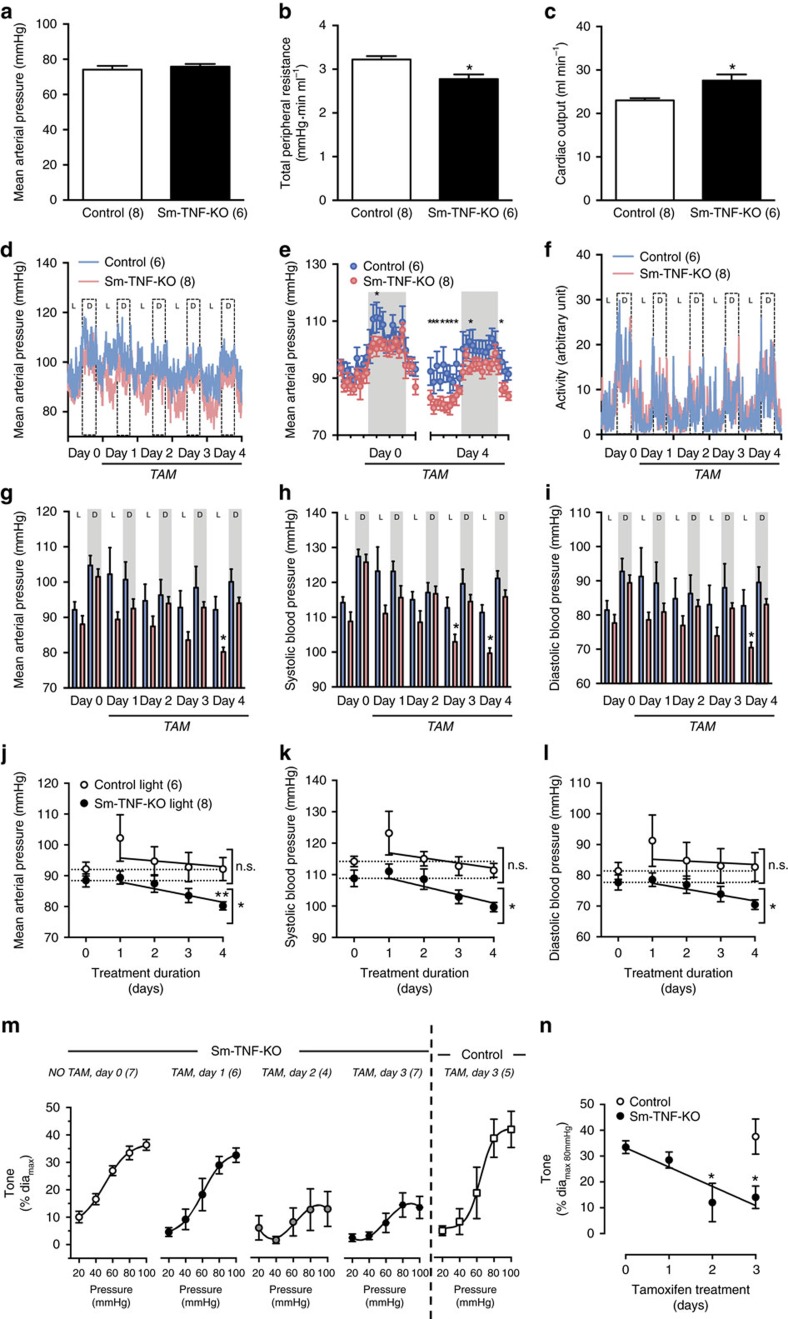
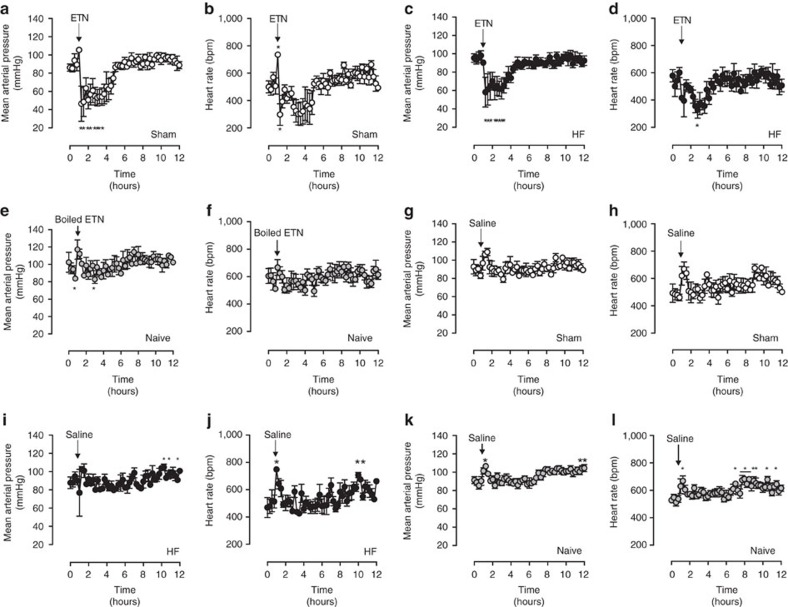
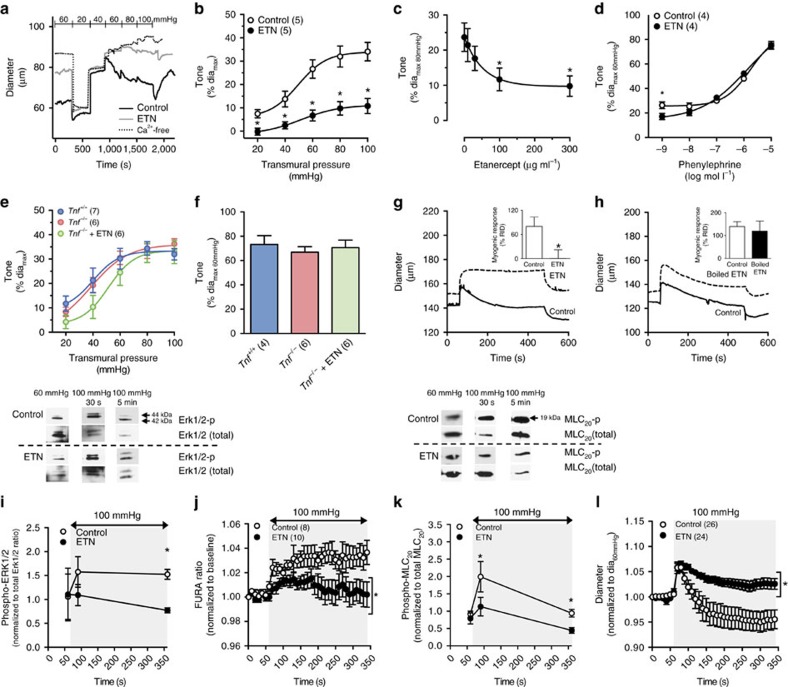
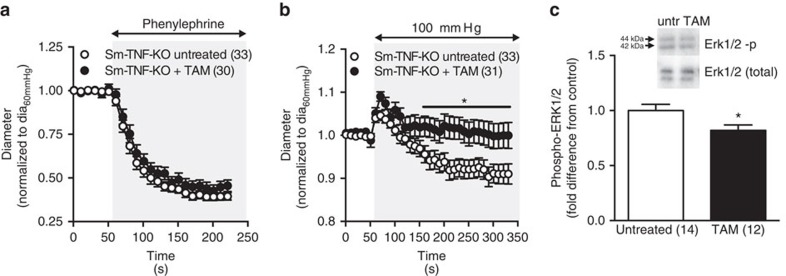
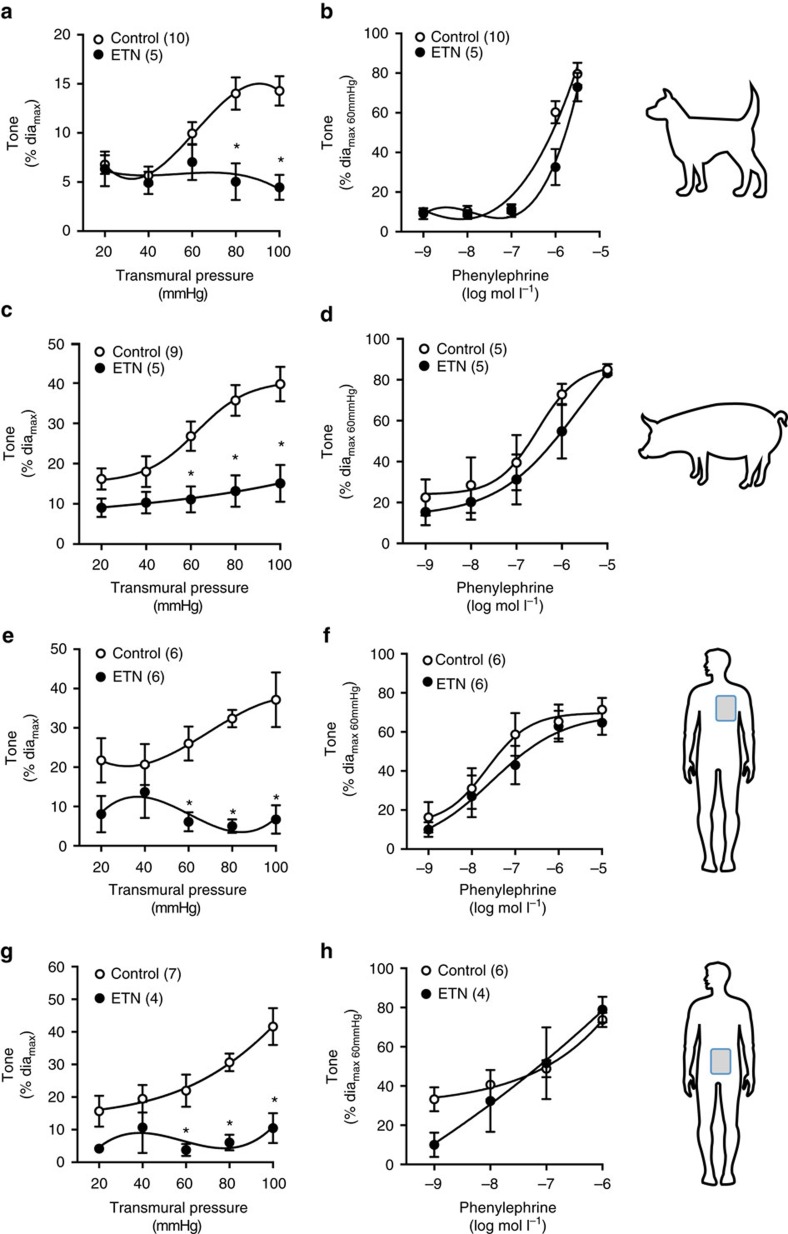
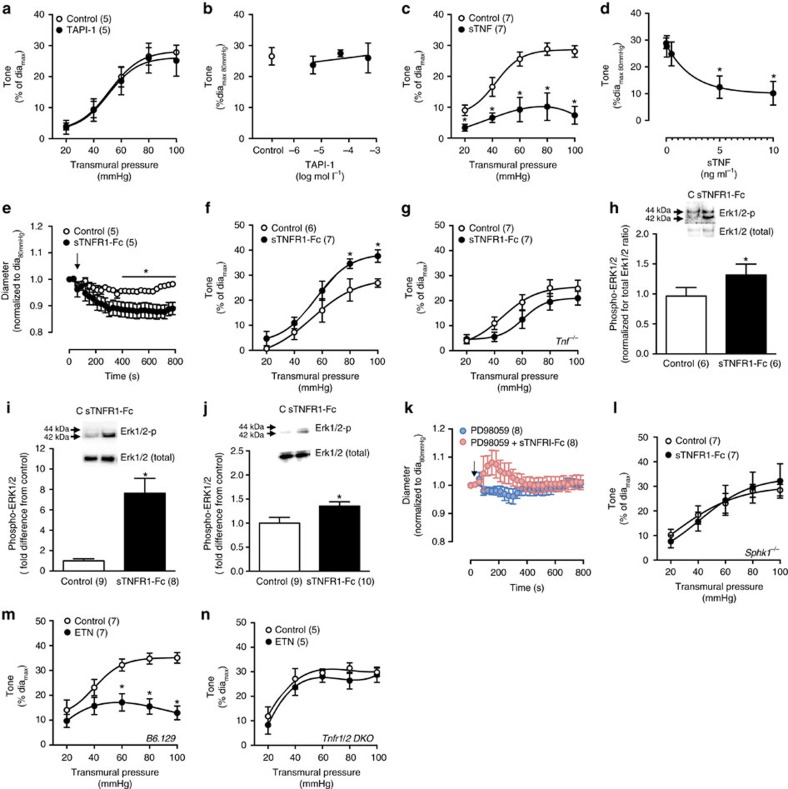
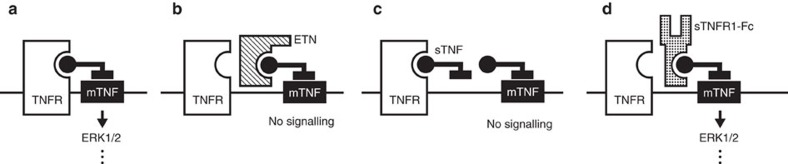
Tumour necrosis factor (TNF) is a ubiquitously expressed cytokine with functions beyond the immune system. In several diseases, the induction of TNF expression in resistance artery smooth muscle cells enhances microvascular myogenic vasoconstriction and perturbs blood flow. This pathological role prompted our hypothesis that constitutively expressed TNF regulates myogenic signalling and systemic haemodynamics under non-pathological settings. Here we show that acutely deleting the TNF gene in smooth muscle cells or pharmacologically scavenging TNF with etanercept (ETN) reduces blood pressure and resistance artery myogenic responsiveness; the latter effect is conserved across five species, including humans. Changes in transmural pressure are transduced into intracellular signals by membrane-bound TNF (mTNF) that connect to a canonical myogenic signalling pathway. Our data positions mTNF 'reverse signalling' as an integral element of a microvascular mechanosensor; pathologic or therapeutic perturbations of TNF signalling, therefore, necessarily affect microvascular tone and systemic haemodynamics.


Conflict of interest statement

The authors declare no competing financial interests.

Figures

Figure 1
Figure 1. Effects of TNF disruption on myogenic responsiveness and in HF.
HF was induced by left anterior descending coronary artery ligation. Sham-operated mice served as controls. Pressure myography of cremaster skeletal muscle resistance arteries isolated from wild type and Tnf−/− mice. (a) Myogenic responsiveness and (b) phenylephrine-induced vasoconstriction was assessed in arteries from wild-type mice in the absence and presence of etanercept (ETN, 300 μg ml−1 in vitro). (c) Myogenic responsiveness and (d) phenylephrine-induced vasoconstriction was assessed in arteries from Tnf−/− mice. Numbers in parentheses indicate the number of arteries in each group. All data are mean±s.e.m. *P<0.05 for one-way ANOVA and Dunnett's post hoc test relative to sham (a). An unpaired Student's t-test at each pressure and drug dose was nonsignificant (bd). ANOVA, analysis of variance.
Figure 2
Figure 2. Haemodynamic and vascular responses after smooth muscle Tnf deletion.
Mice expressing inducible Cre recombinase within their smooth muscle (SMMHC-CreERT2) and carrying either the wild-type Tnf gene (Tnfwt/wt, control) or a floxed Tnf gene (Tnffl/fl) were treated with tamoxifen (TAM, 1 mg day−1), resulting in smooth muscle cell-specific Tnf gene knockout (Sm-TNF-KO). Day 0 represents the untreated control condition (NO TAM). (a) MAP, (b) TPR and (c) cardiac output assessed by invasive catheterization and echocardiography. (d) Average raw radiotelemetric measurements of MAP in non-anaesthetized mice. Light and dark phases are indicated as ‘L' and ‘D', respectively. (e) Statistical analysis of MAP at each hour on day 0 and day 4. Grey shading indicates dark phase. (f) Average raw radiotelemetric measurements of ambulatory activity. Statistical analysis of (g) MAP, (h) systolic blood pressure, and (i) diastolic blood pressure binned over light and dark phases. White bars indicate control, black bars indicate Sm-TNF-KO, and grey shading indicates dark phase. Change in light phase measurements of (j) MAP, (k) systolic blood pressure, and (l) diastolic blood pressure during TAM treatment. (m) Pressure myography in isolated cremaster muscle resistance arteries from Sm-TNF-KO and control mice. (n) Statistical comparison of myogenic tone developed at 80 mm Hg. Numbers in parentheses indicate the number of mice in each group (al) or the numbers of arteries in each group (m,n). All data are mean±s.e.m.; *P<0.05; **P<0.05 relative to untreated Sm-TNF-KO following Dunnett's post hoc test; n.s., nonsignificant. Student's unpaired t-test (ai); repeated-measures one-way ANOVA and Dunnett's post hoc test compared with day 0 (jl,n). ANOVA, analysis of variance.
Figure 3
Figure 3. Effects of acute TNF scavenging on systemic haemodynamics.
Radiotelemetric haemodynamic measurements of sham-operated mice. (a) MAP and (b) heart rate in sham-operated mice injected with etanercept (ETN, 20 mg kg−1 i.p., arrow, n=4 sham mice). (c) MAP and (d) heart rate measurements of mice with HF induced by left anterior descending coronary artery ligation and injected with ETN (20 mg kg−1 i.p., arrow, n=4 mice). (e) MAP and (f) heart rate measurements of naive (non-operated) wild-type mice injected with boiled etanercept (boiled ETN, 20 mg kg−1 i.p., arrow, n=4 mice). (g) MAP and (h) heart rate of sham-operated mice injected with saline (100 ul, arrow, n=4 mice). (i) MAP and (j) heart rate of HF mice injected with saline (100 ul, arrow, n=4 mice). (k) MAP and (l) heart rate of naive (non-operated) wild-type mice injected with saline (100 ul, arrow, n=8 mice). All data are mean±s.e.m. *P<0.05 for one-way repeated-measures ANOVA and Dunnett's post hoc test relative to 0 h. ANOVA, analysis of variance.
Figure 4
Figure 4. Acute TNF scavenging attenuates myogenic vasoconstriction.
(a) Representative traces of myogenic vasoconstriction in mouse cremaster arteries in the presence of ETN (300 μg ml−1 in vitro) and (b) statistical comparison. (c) Dose-dependency of ETN's effect at 80 mm Hg (n=5 arteries at 0, 7 at 10, 6 at 30, 6 at 100 and 5 at 300 μg ml−1). (d) Phenylephrine-stimulated vasoconstriction (ETN, 300 μg ml−1). (e) Myogenic and (f) 10 μmol l−1 phenylephrine-stimulated vasoconstriction in cremaster arteries from Tnf+/+ and Tnf−/− with and without ETN (300 μg ml−1). (g,h) Representative traces shown of myogenic vasoconstriction (45–100 mm Hg pressure step) in hamster gracilis arteries with (g) native ETN (10 μg ml−1; inset: comparison in n=6 arteries per group) and (h) heat-denatured ETN (10 μg ml−1; inset: comparison in n=6 arteries per group). Myogenic responses displayed as reversal of initial distension (RID). (i) Western blot assessments of ERK1/2 phosphorylation (60–100 mm Hg pressure step; control: n=4 at 60, 5 at 90 and 4 at 360 s; ETN: n=3 at 60, 5 at 90 and 4 at 360 s). Representative images above and uncropped images in Supplementary Fig. 3a–h. (j) Intracellular Ca2+ (60–100 mm Hg pressure step). (k) Western blot assessments of MLC20 phosphorylation (60–100 mm Hg pressure step; control: n=11 at 60, 6 at 90 and 7 at 360 s; ETN: n=4 at 60, 6 at 90, and 5 at 360 s). Representative images above and uncropped images in Supplementary Fig. 3i–n. (l) Myogenic response (60–100 mm Hg pressure step; normalized to 10 s average baseline diameter; control: 62±2, ETN: 68±2 μm). Shading denotes 100 mm Hg. Parentheses indicate number of arteries per group. Data are mean±s.e.m.; *P<0.05 in Student's unpaired t-test (b,d,il), in Dunnett's post hoc comparison to concentration 0 following a one-way ANOVA (c), and Student's paired t-test (g,h, insets). In (e,f), the one-way ANOVAs are nonsignificant. ANOVA, analysis of variance.
Figure 5
Figure 5. Pressure-induced ERK phosphorylation after smooth muscle Tnf deletion.
Cremaster muscle arteries were excised from tamoxifen treatment (TAM, 1 mg day−1 for 3 days) in Sm-TNF-KO mice and untreated controls. (a) Phenylephrine-induced (10 μmol l−1, grey shading) vasoconstriction in cremaster arteries isolated from untreated and TAM-treated Sm-TNF-KO mice. (b) Diameter changes in response to a single-step increase in transmural pressure (60–100 mm Hg, grey shading). (c) phospho-ERK1/2 levels in cremaster arteries isolated from untreated and TAM-treated Sm-TNF KO mice (normalized to total ERK1/2, expressed as fold-difference from untreated controls on same blot). Inset: representative western blot. Two arteries were pooled for each sample, and densitometry reflects 12–14 samples per group on five separate blots. Uncropped western blot images are shown in Supplementary Fig. 5. Numbers in parentheses indicate number of arteries per group (a,b) and number of replicates per group (c). Data are mean±s.e.m. *P<0.05 in an unpaired Student's t-test. ANOVA, analysis of variance.
Figure 6
Figure 6. TNF scavenging in skeletal muscle arteries from animals and humans.
Myogenic and phenylephrine-stimulated vasoconstriction following treatment with etanercept (ETN, 300 μg ml−1 in vitro). (a,b) Dog gracilis skeletal muscle resistance arteries. (c,d) Pig gracilis skeletal muscle resistance arteries. (e,f) Human thoracic wall skeletal muscle resistance arteries. (g,h) Human lumbar skeletal muscle resistance arteries. Numbers in parentheses indicate arteries per group. All data are mean±s.e.m. *P<0.05 for unpaired Student's t-test comparison at each pressure.
Figure 7
Figure 7. TNF reverse signalling in the myogenic response.
(a) Myogenic responses in the presence of the TNF converting enzyme inhibitor TAPI-1 (500 μmol l−1 in vitro) and (b) dose-dependency assessment at 80 mm Hg (control: n=5 arteries; 5 at −5.3, 4 at −4.3, 5 at −3.3 log mol l−1 TAPI-1). (c) Myogenic responses in the presence of recombinant soluble TNF (sTNF, 10 ng ml−1 in vitro) and (d) dose-dependency assessment at 80 mm Hg (n=7 arteries at 0, 5 at 0.05, 7 at 0.5, 6 at 5 and 6 at 10 ng ml−1 sTNF). (e) Wild-type cremaster artery diameter measurements at 80 mm Hg transmural pressure following application of an intrinsically active soluble TNFR1 fragment (sTNFR1-Fc; 100 ng ml−1, arrow); data are normalized to baseline diameter (10 s average control: 51±5, sTNFR1-Fc: 51±5). (f,g) Myogenic responses conducted in the presence of sTNFR1-Fc in vitro (100 ng ml−1) in (f) wild-type and (g) Tnf−/− cremaster arteries. (hj) Representative western blot assessments and statistical analysis of ERK1/2 phosphorylation under control condition (C) and following sTNFR1-Fc (100 ng ml−1) application to (h) cremaster arteries at 80 mm Hg transmural pressure, (i) cultured mouse mesenteric vascular smooth muscle cells, and (j) cultured human coronary artery smooth muscle cells. Uncropped western blot images are shown in Supplementary Fig. 10. (k) Wild-type cremaster artery diameter measurements at 80 mm Hg transmural pressure following application of sTNFR1-Fc (100 ng ml−1, arrow) in the presence of 10 μmol l−1 PD98059; data are normalized to baseline diameter (10 s average control: 51±4, sTNFR1-Fc: 51±4). (l) Myogenic responses in the presence of sTNFR1-Fc in vitro (100 ng ml−1) in cremaster arteries isolated from Sphk1−/− mice. (m,n) Myogenic responses in cremaster arteries isolated from (m) B6.129 wild-type controls and (n) Tnfr1/2 DKO mice in the presence and absence of etanercept (ETN, 300 μg ml−1 in vitro). Numbers in parentheses indicate the number of arteries per experimental group (a,c,eg,kn) or the number of replicates per experimental group (hj) All data are mean±s.e.m. *P<0.05 for unpaired Student's t-test (a,c,eg,in), paired Student's t-test (h, paired within blot), and one-way ANOVA with Dunnett's post hoc comparison to concentration 0 (b,d). ANOVA, analysis of variance.
Figure 8
Figure 8. Proposed scheme for TNF as a mechanosensor.
(a) In the control setting, tethering between mTNF and TNF receptors (TNFR) provides the structural basis for strain to elicit a reverse signal through mTNF that links to ERK1/2. (b) Etanercept (ETN) which lacks intrinsic activity, interferes with mTNF/TNFR tethering and hence, reverse signalling. (c) Soluble TNF (sTNF) competes with mTNF for TNFR binding, which also interferes with mTNF/TNFR tethering and hence, reverse signalling. (d) The soluble TNFR1 fragment (sTNFR1-Fc) interferes with mTNF/TNFR tethering, but stimulates a reverse signal through its intrinsic activity.

References

    1. Wajant H., Pfizenmaier K. & Scheurich P. Tumor necrosis factor signaling. Cell Death Differ. 10, 45–65 (2003). - PubMed
    1. Vassalli P. The pathophysiology of tumor necrosis factors. Annu. Rev. Immunol. 10, 411–452 (1992). - PubMed
    1. Yang J. et al. Proximal cerebral arteries develop myogenic responsiveness in heart failure via tumor necrosis factor-α-dependent activation of sphingosine-1-phosphate signaling. Circulation 126, 196–206 (2012). - PubMed
    1. Yagi K. et al. Therapeutically targeting tumor necrosis factor-α/sphingosine-1-phosphate signaling corrects myogenic reactivity in subarachnoid hemorrhage. Stroke 46, 2260–2270 (2015). - PubMed
    1. Sauvé M. et al. Tumor necrosis factor/sphingosine-1-phosphate signaling augments resistance artery myogenic tone in diabetes. Diabetes 65, 1916–1928 (2016). - PubMed

Publication types

MeSH terms