Comparative Study
. 2017 Aug;66(2):498-509.
doi: 10.1002/hep.29199. Epub 2017 Jun 26.

Hepatic FXR/SHP axis modulates systemic glucose and fatty acid homeostasis in aged mice

Affiliations
Comparative Study

Hepatic FXR/SHP axis modulates systemic glucose and fatty acid homeostasis in aged mice

Kang Ho Kim et al. Hepatology. 2017 Aug.

Abstract

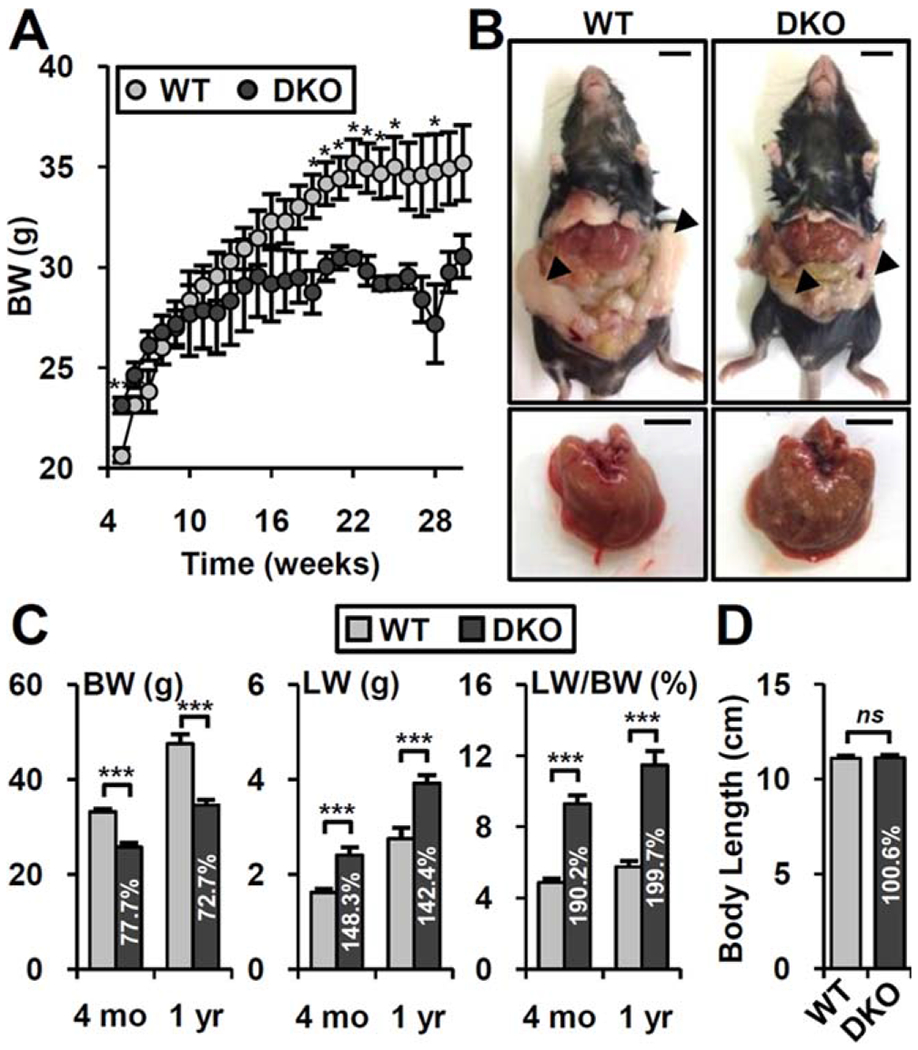
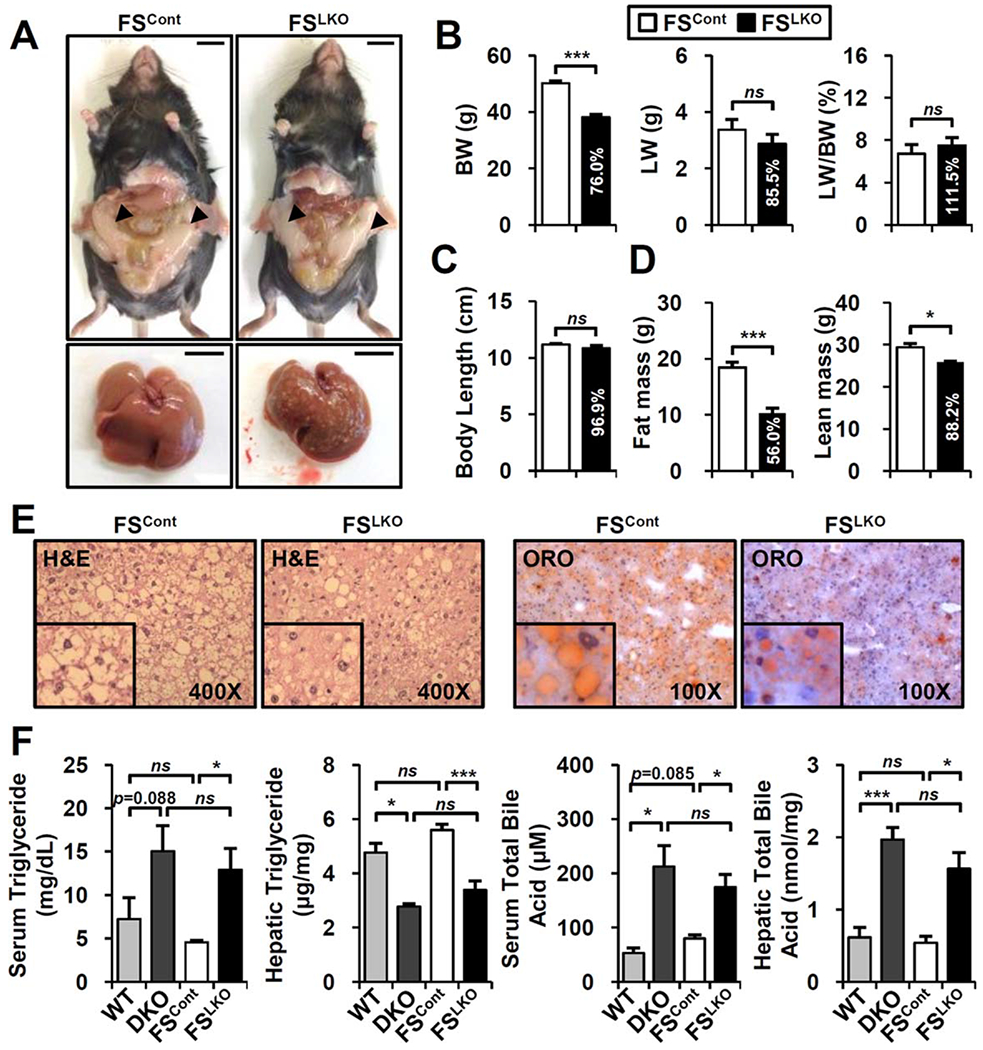
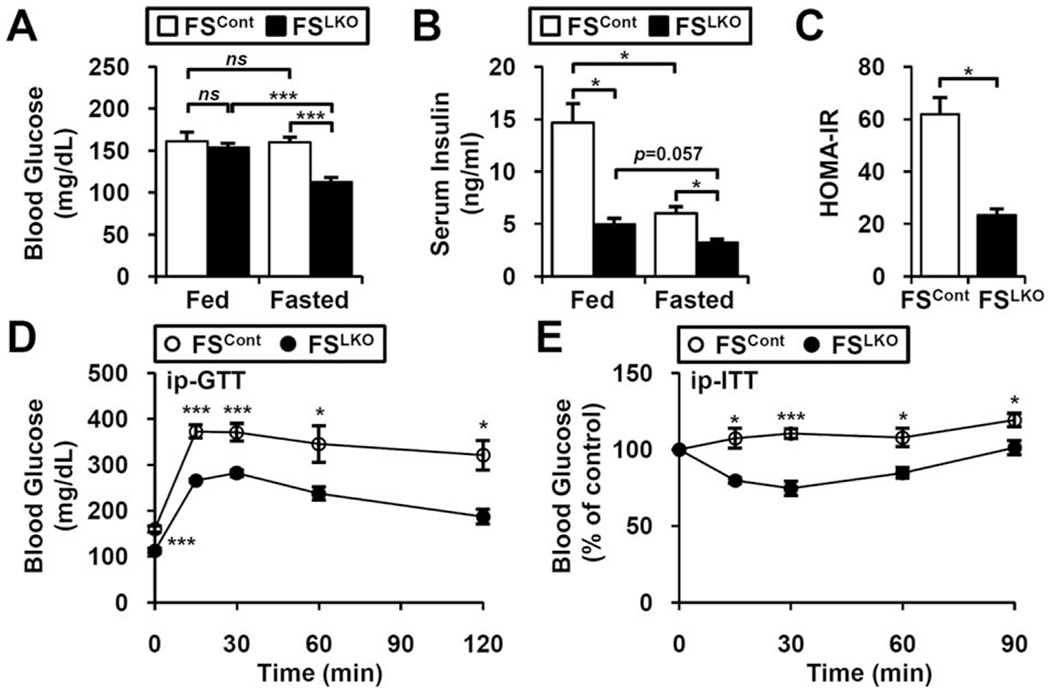
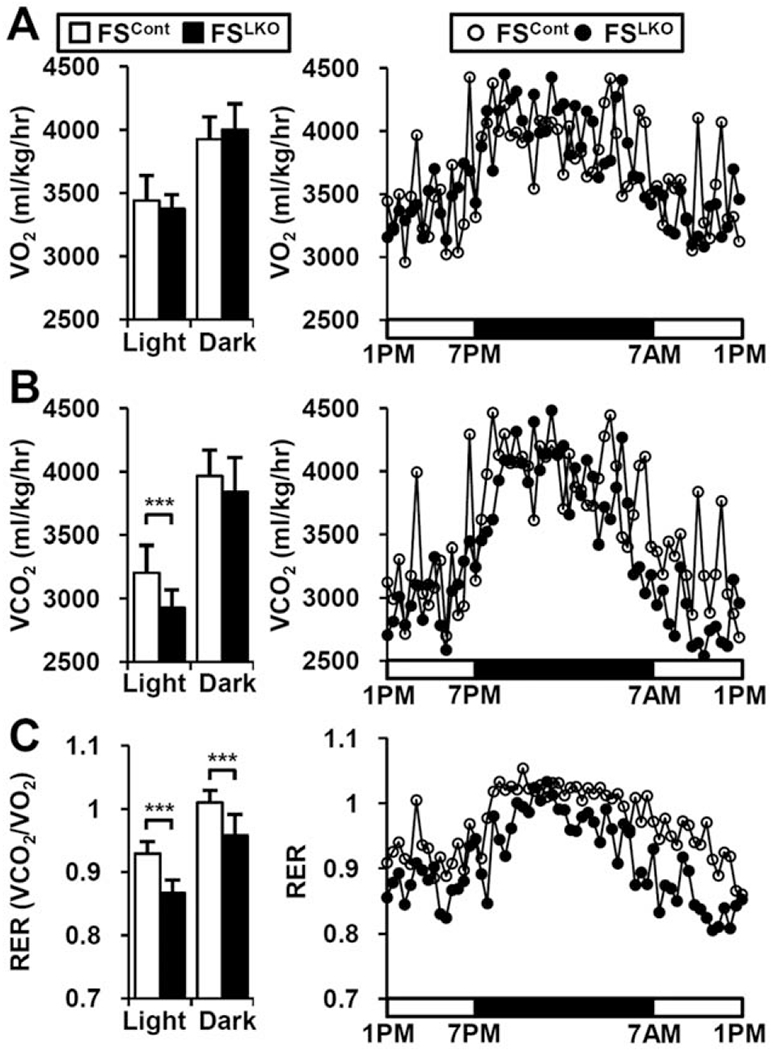
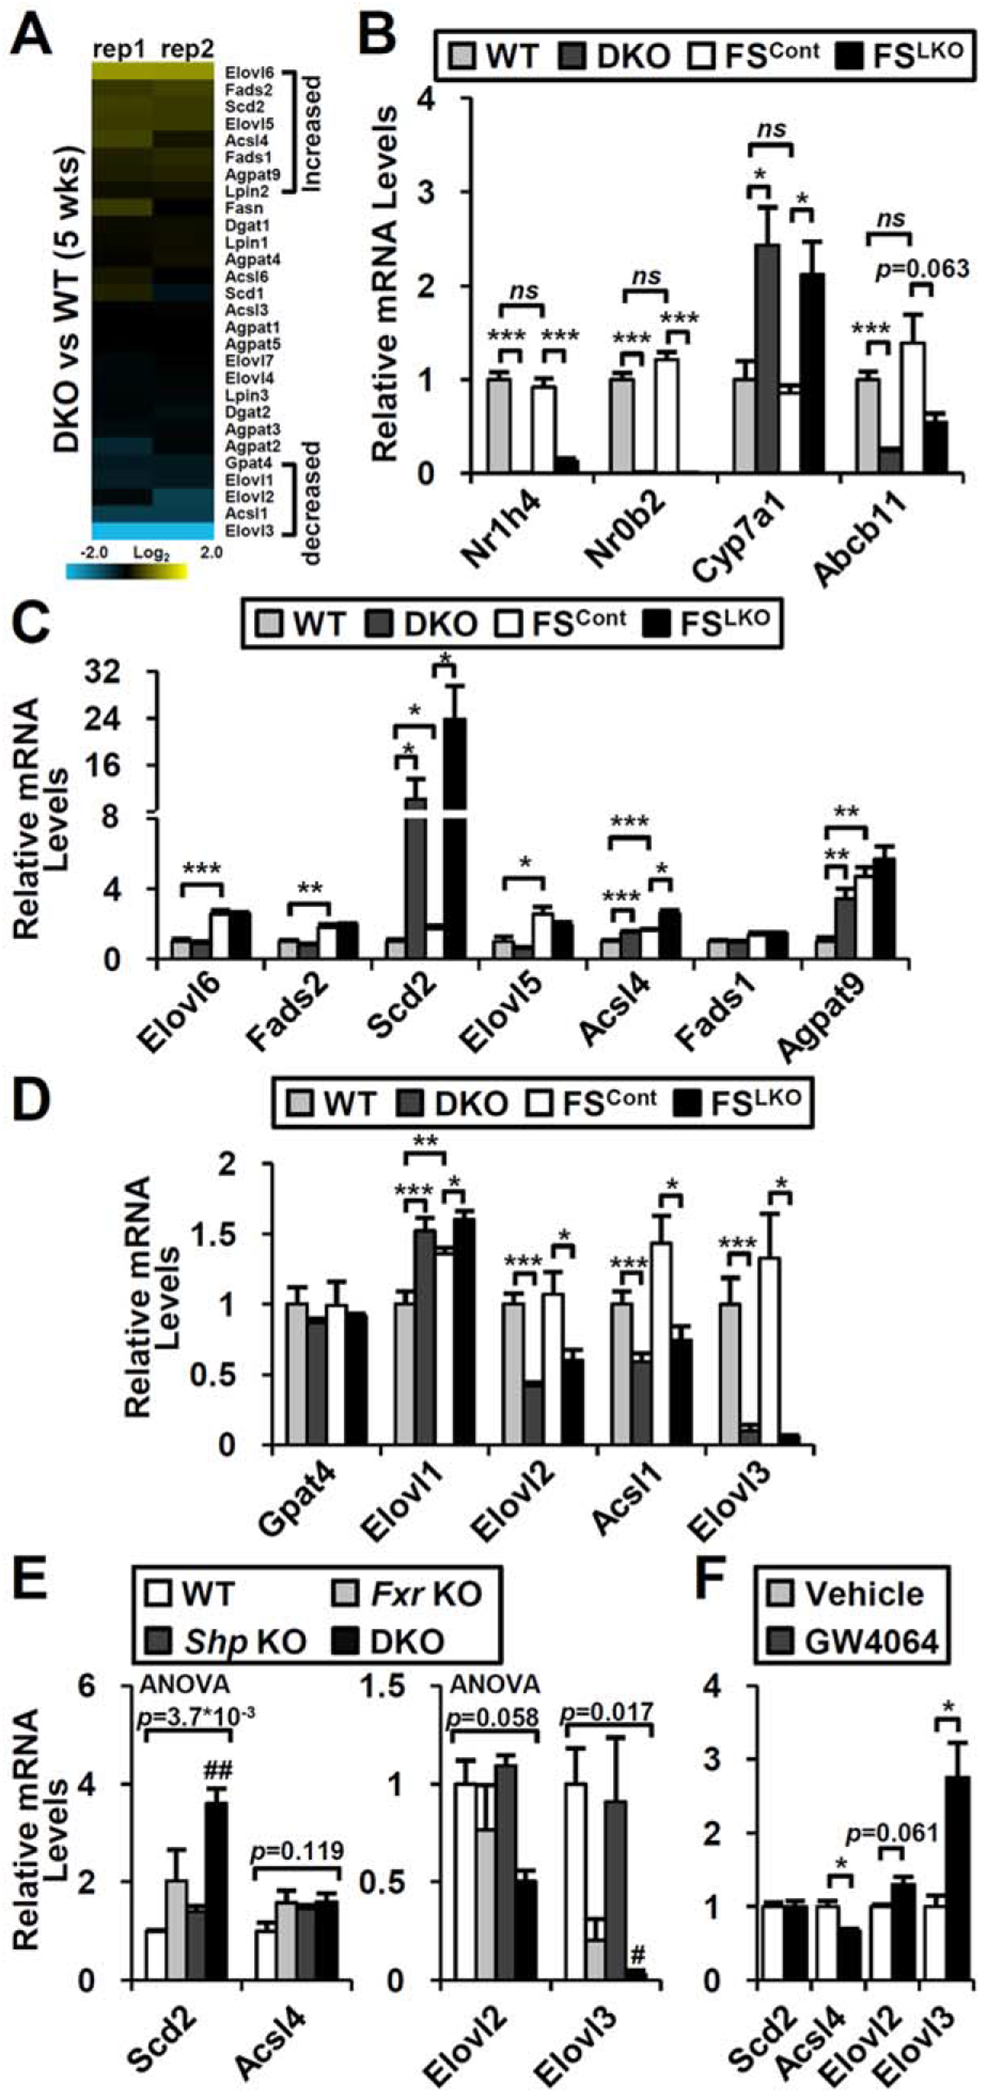
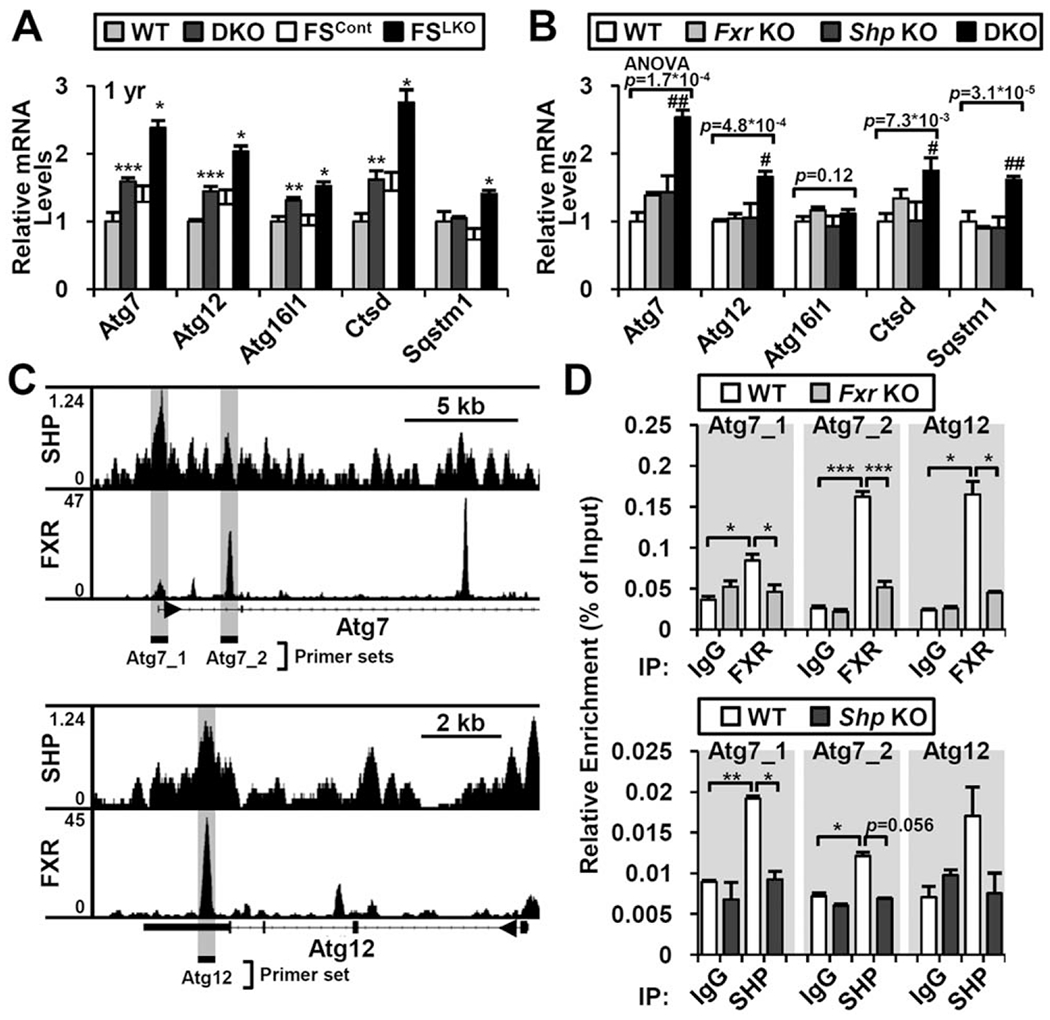
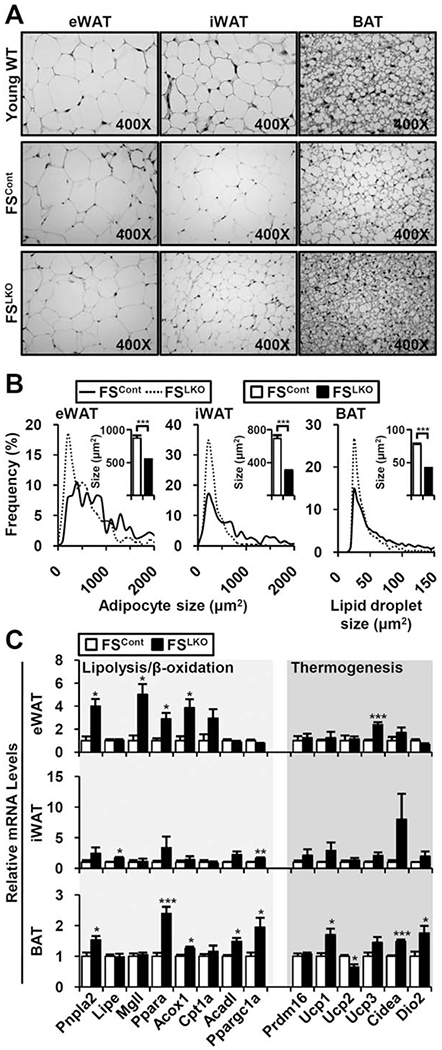
The nuclear receptors farnesoid X receptor (FXR; NR1H4) and small heterodimer partner (SHP; NR0B2) play crucial roles in bile acid homeostasis. Global double knockout of FXR and SHP signaling (DKO) causes severe cholestasis and liver injury at early ages. Here, we report an unexpected beneficial impact on glucose and fatty acid metabolism in aged DKO mice, which show suppressed body weight gain and adiposity when maintained on normal chow. This phenotype was not observed in single Fxr or Shp knockouts. Liver-specific Fxr/Shp double knockout mice fully phenocopied the DKO mice, with lower hepatic triglyceride accumulation, improved glucose/insulin tolerance, and accelerated fatty acid use. In both DKO and liver-specific Fxr/Shp double knockout livers, these metabolic phenotypes were associated with altered expression of fatty acid metabolism and autophagy-machinery genes. Loss of the hepatic FXR/SHP axis reprogrammed white and brown adipose tissue gene expression to boost fatty acid usage.

Conclusion: Combined deletion of the hepatic FXR/SHP axis improves glucose/fatty acid homeostasis in aged mice, reversing the aging phenotype of body weight gain, increased adiposity, and glucose/insulin tolerance, suggesting a central role of this axis in whole-body energy homeostasis. (Hepatology 2017;66:498-509).


Conflict of interest statement

Potential conflict of interest: Nothing to report.

Figures

FIG. 1.
FIG. 1.
DKO mice prevent age-induced obesity. (A) Body weight changes of WT (n = 8) and DKO (n = 10) mice fed normal chow. (B) Representative picture of whole body and liver at 1 year of age. Arrowhead, epididymal adipose tissues. Scale bar, 10 mm. (C) Body weight, liver weight, and liver/body weight ratio at 4 months and 1 year of age. Values in the DKO bar graph indicated relative percentage compared to WT (percentage). (D) Body length (anal to nasal length) at 1 year of age (n = 5-8). Student t test: *P< 0.05, **P< 0.01, ***P< 0.005. Abbreviations: BW, body weight; LW, liver weight; ns, not significant.
FIG. 2.
FIG. 2.
Aged FSLKO mice also show a lean phenotype and have lower hepatic lipid accumulation. (A) Whole-body and liver images of normal chow-fed FSLKO mice at 1 year of age. Arrowhead, epididymal adipose tissues. Scale bar, 10 mm. (B) Body weight, liver weight, and liver/body weight ratio at 1 year of age (n = 4). (C) Anal to nasal body length (n = 4). (D) Body composition of 1-year-old FSCont and FSLKO mice (n = 4). (E) Hematoxylin and eosin and oil-red O staining of liver. (F) Serum and hepatic triglyceride levels and total bile acid levels in DKO and FSLKO mice (n = 3-5). Student t test: *P< 0.05, ***P< 0.005. Abbreviations: BW, body weight; H&E, hematoxylin and eosin; LW, liver weight; ns, not significant; ORO, oil-red O.
FIG. 3.
FIG. 3.
Ameliorated glucose intolerance and insulin resistance in FSLKO mice. In fed and fasted conditions, (A) blood glucose and (B) serum insulin concentrations were examined at 1 year of age (n = 3-4). (C) Homeostasis model assessment of insulin resistance index of FSLKO mice. (D) Glucose tolerance tests and (E) insulin tolerance tests of FSLKO mice at 1 year of age (n = 4). Student t test: *P< 0.05, ***p< 0.005. Abbreviations: HOMAIR, homeostasis model assessment of insulin resistance; ip-GTT, intraperitoneal glucose tolerance test; ip-ITT, intraperitoneal insulin tolerance test; ns, not significant.
FIG. 4.
FIG. 4.
FSLKO mice exhibit lower RER. Indirect calorimetry analysis of (A) oxygen consumption rate (VO2) and (B) CO2 production rate (VCO2) in normal chow-fed FSLKO mice (n = 3). (C) RER (VCO2/CO2) of FSLKO mice. Data are mean of each time period ± standard error of the mean Student t test: ***P< 0.005.
FIG. 5.
FIG. 5.
Changes of hepatic gene expression in DKO and FSLKO mice. (A) Expression of fatty acid metabolism genes in DKO microarray. (B) Fxr (Nr1h4), Shp (Nr0b2), and representative FXR/SHP target gene (Cyp7a1 and Bsep/Abcb11) expression in 1-year-old DKO and FSLKO mice (n = 4). Genes showing (C) increased or (D) decreased tendency in DKO microarray were selected, and their expression was measured in 1-year-old DKO and FSLKO liver (n = 4). (E) Representative gene expression in Fxr and Shp single knockouts compared to DKO (n = 4). (F) Representative gene expression in response to FXR agonist (GW4064, 100 mg/kg) treatment (n = 4). (A-D, F) Student t test: *P< 0.05, **P< 0.01, ***P< 0.005. (E) One-way ANOVA, followed by post hoc t test: #P< 0.0083, ##P< 0.0017 compared to WT. Abbreviation: ns, not significant.
FIG. 6.
FIG. 6.
Increased autophagy-related gene expression in DKO and FSLKO liver. Representative autophagy-related gene expression in (A) DKO and FSLKO or (B) Fxr and Shp single knockouts (n = 3-4). (C) FXR and SHP binding at Atg7 and Atg12 gene loci in ChIP-seq data. Genomic loci for ChIP-PCR analysis are denoted by gray background. (D) Confirmation of FXR and SHP recruitment by ChIP-PCR analysis (n = 2-3). (A,D) Student t test: *P< 0.05, **P< 0.01, ***P< 0.005. (B) One-way ANOVA, followed by post hoc t test: #P< 0.0083, ##P< 0.0017 compared to WT. Abbreviations: IgG, immunoglobulin G; IP, immunoprecipitation.
FIG. 7.
FIG. 7.
Enhanced fatty acid usage and thermogenesis gene expression in FSLKO adipose tissues. (A) Hematoxylin and eosin staining of eWAT, iWAT, and BAT from young WT and old WT/DKO mice. (B) Quantification of adipocyte (eWAT and iWAT) or lipid droplet size (BAT). Inset bar graph indicates average size in square micrometers. (C) Gene expression profiles involved in lipolysis, βoxidation, and thermogenesis (n = 4). Student t test: *P< 0.05, **P< 0.01, ***P< 0.005.

References

    1. Fuchs CD, Traussnigg SA, Trauner M. Nuclear receptor modulation for the treatment of nonalcoholic fatty liver disease. Semin Liver Dis 2016;36:69–86. - PubMed
    1. Modica S, Gadaleta RM, Moschetta A. Deciphering the nuclear bile acid receptor FXR paradigm. Nucl Recept Signal 2010;8:e005. - PMC - PubMed
    1. Zhang Y, Hagedorn CH, Wang L. Role of nuclear receptor SHP in metabolism and cancer. Biochim Biophys Acta 2011; 1812:893–908. - PMC - PubMed
    1. Anakk S, Watanabe M, Ochsner SA, McKenna NJ, Finegold MJ, Moore DD. Combined deletion of Fxr and Shp in mice induces Cyp17a1 and results in juvenile onset cholestasis. J Clin Invest 2011;121:86–95. - PMC - PubMed
    1. Cariou B, van Harmelen K, Duran-Sandoval D, van Dijk TH, Grefhorst A, Abdelkarim M, et al. The farnesoid X receptor modulates adiposity and peripheral insulin sensitivity in mice. J Biol Chem 2006;281:11039–11049. - PubMed

Publication types

MeSH terms

Substances