

The Tomato Expression Atlas
- PMID: 28379331
- PMCID: PMC5860121
- DOI: 10.1093/bioinformatics/btx190
The Tomato Expression Atlas
Abstract
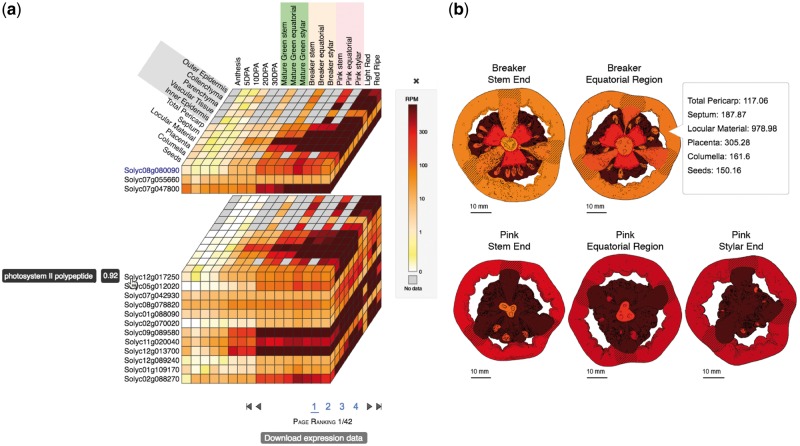
Summary: With the development of new high-throughput DNA sequencing technologies and decreasing costs, large gene expression datasets are being generated at an accelerating rate, but can be complex to visualize. New, more interactive and intuitive tools are needed to visualize the spatiotemporal context of expression data and help elucidate gene function. Using tomato fruit as a model, we have developed the Tomato Expression Atlas to facilitate effective data analysis, allowing the simultaneous visualization of groups of genes at a cell/tissue level of resolution within an organ, enhancing hypothesis development and testing in addition to candidate gene identification. This atlas can be adapted to different types of expression data from diverse multicellular species.
Availability and implementation: The Tomato Expression Atlas is available at http://tea.solgenomics.net/ . Source code is available at https://github.com/solgenomics/Tea .
Contact: jr286@cornell.edu or lam87@cornell.edu.
Supplementary information: Supplementary data are available at Bioinformatics online.
© The Author(s) 2017. Published by Oxford University Press.
Figures
References
-
- Altschul S.F. et al. (1990) Basic local alignment search tool. J. Mol. Biol., 215, 403–410. - PubMed
-
- Martin L.B.B. et al. (2016) Laser microdissection of tomato fruit cell and tissue types for transcriptome profiling. Nat. Protoc., 11, 2376–2388. - PubMed
-
- Thimm O. et al. (2004) MAPMAN: a user-driven tool to display genomics data sets onto diagrams of metabolic pathways and other biological processes. Plant J., 37, 914–939. - PubMed
MeSH terms
LinkOut - more resources
Full Text Sources
Other Literature Sources
