

A penalized regression approach to haplotype reconstruction of viral populations arising in early HIV/SIV infection
- PMID: 28379346
- PMCID: PMC5870767
- DOI: 10.1093/bioinformatics/btx187
A penalized regression approach to haplotype reconstruction of viral populations arising in early HIV/SIV infection
Abstract
Motivation: Next generation sequencing (NGS) has been increasingly applied to characterize viral evolution during HIV and SIV infections. In particular, NGS datasets sampled during the initial months of infection are characterized by relatively low levels of diversity as well as convergent evolution at multiple loci dispersed across the viral genome. Consequently, fully characterizing viral evolution from NGS datasets requires haplotype reconstruction across large regions of the viral genome. Existing haplotype reconstruction algorithms have not been developed with the particular characteristics of early HIV/SIV infection in mind, raising the possibility that better performance could be achieved through a specifically designed algorithm.
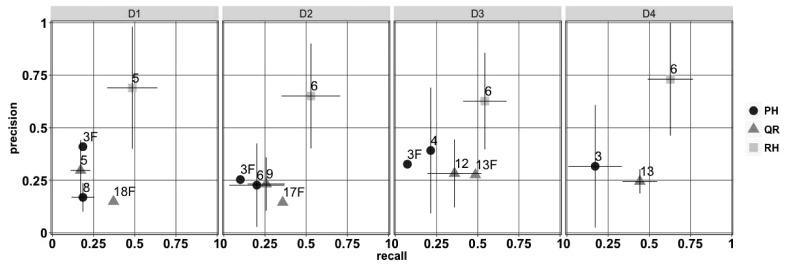
Results: Here, we introduce a haplotype reconstruction algorithm, RegressHaplo, specifically designed for low diversity and convergent evolution regimes. The algorithm uses a penalized regression that balances a data fitting term with a penalty term that encourages solutions with few haplotypes. The regression covariates are a large set of potential haplotypes and fitting the regression is made computationally feasible by the low diversity setting. Using simulated and in vivo datasets, we compare RegressHaplo to PredictHaplo and QuRe, two existing haplotype reconstruction algorithms. RegressHaplo performs better than these algorithms on simulated datasets with relatively low diversity levels. We suggest RegressHaplo as a novel tool for the investigation of early infection HIV/SIV datasets and, more generally, low diversity viral NGS datasets.
Contact: sr286@georgetown.edu.
Availability and implementation: https://github.com/SLeviyang/RegressHaplo.
© The Author(s) 2017. Published by Oxford University Press.
Figures


Similar articles
-
Evaluation of haplotype callers for next-generation sequencing of viruses.Infect Genet Evol. 2020 Aug;82:104277. doi: 10.1016/j.meegid.2020.104277. Epub 2020 Mar 6. Infect Genet Evol. 2020. PMID: 32151775 Free PMC article.
-
A binning tool to reconstruct viral haplotypes from assembled contigs.BMC Bioinformatics. 2019 Nov 4;20(1):544. doi: 10.1186/s12859-019-3138-1. BMC Bioinformatics. 2019. PMID: 31684876 Free PMC article.
-
Validation of Variant Assembly Using HAPHPIPE with Next-Generation Sequence Data from Viruses.Viruses. 2020 Jul 14;12(7):758. doi: 10.3390/v12070758. Viruses. 2020. PMID: 32674515 Free PMC article.
-
Benchmarking of viral haplotype reconstruction programmes: an overview of the capacities and limitations of currently available programmes.Brief Bioinform. 2014 May;15(3):431-42. doi: 10.1093/bib/bbs081. Epub 2012 Dec 19. Brief Bioinform. 2014. PMID: 23257116 Review.
-
Recent advances in inferring viral diversity from high-throughput sequencing data.Virus Res. 2017 Jul 15;239:17-32. doi: 10.1016/j.virusres.2016.09.016. Epub 2016 Sep 28. Virus Res. 2017. PMID: 27693290 Review.
Cited by
-
Reconstruction of Microbial Haplotypes by Integration of Statistical and Physical Linkage in Scaffolding.Mol Biol Evol. 2021 May 19;38(6):2660-2672. doi: 10.1093/molbev/msab037. Mol Biol Evol. 2021. PMID: 33547786 Free PMC article.
-
Epidemiological data analysis of viral quasispecies in the next-generation sequencing era.Brief Bioinform. 2021 Jan 18;22(1):96-108. doi: 10.1093/bib/bbaa101. Brief Bioinform. 2021. PMID: 32568371 Free PMC article. Review.
-
V-pipe 3.0: a sustainable pipeline for within-sample viral genetic diversity estimation.Gigascience. 2024 Jan 2;13:giae065. doi: 10.1093/gigascience/giae065. Gigascience. 2024. PMID: 39347649 Free PMC article.
-
The effects of genetic drift and genomic selection on differentiation and local adaptation of the introduced populations of Aedes albopictus in southern Russia.PeerJ. 2021 Jul 21;9:e11776. doi: 10.7717/peerj.11776. eCollection 2021. PeerJ. 2021. PMID: 34327056 Free PMC article.
-
An integrated software for virus community sequencing data analysis.BMC Genomics. 2020 May 15;21(1):363. doi: 10.1186/s12864-020-6744-4. BMC Genomics. 2020. PMID: 32414327 Free PMC article.
References
MeSH terms
Grants and funding
LinkOut - more resources
Full Text Sources
Other Literature Sources
