. 2017 May 1;6(5):1-9.
doi: 10.1093/gigascience/gix024.

A reference human genome dataset of the BGISEQ-500 sequencer

Affiliations

A reference human genome dataset of the BGISEQ-500 sequencer

Jie Huang et al. Gigascience. .

Erratum in

  • Erratum to: A reference human genome dataset of the BGISEQ-500 sequencer.
    Huang J, Liang X, Xuan Y, Geng C, Li Y, Lu H, Qu S, Mei X, Chen H, Yu T, Sun N, Rao J, Wang J, Zhang W, Chen Y, Liao S, Jiang H, Liu X, Yang Z, Mu F, Gao S. Huang J, et al. Gigascience. 2018 Dec 1;7(12):giy144. doi: 10.1093/gigascience/giy144. Gigascience. 2018. PMID: 30500904 Free PMC article. No abstract available.

Abstract

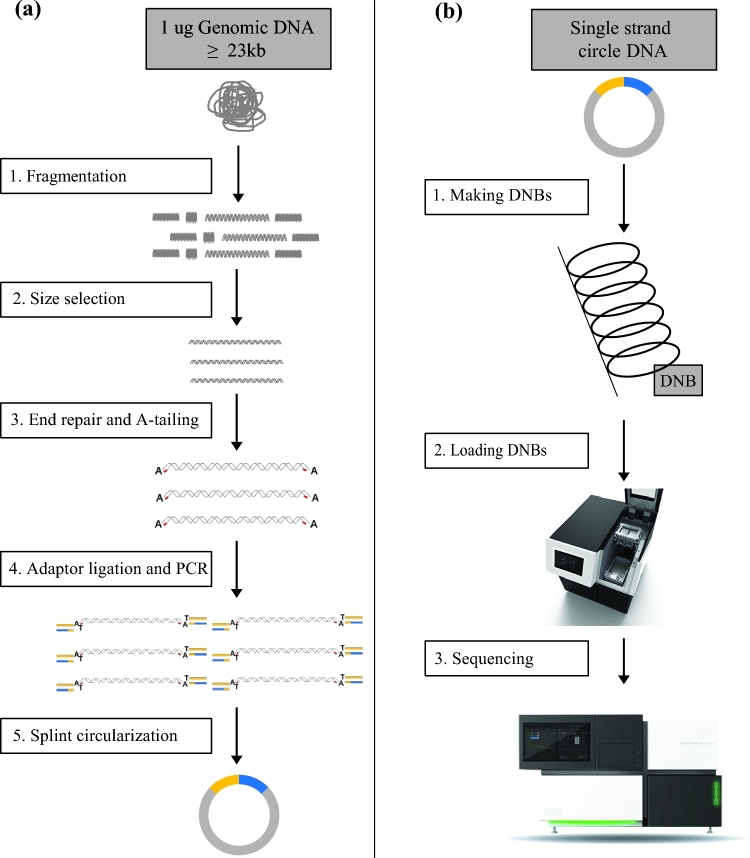
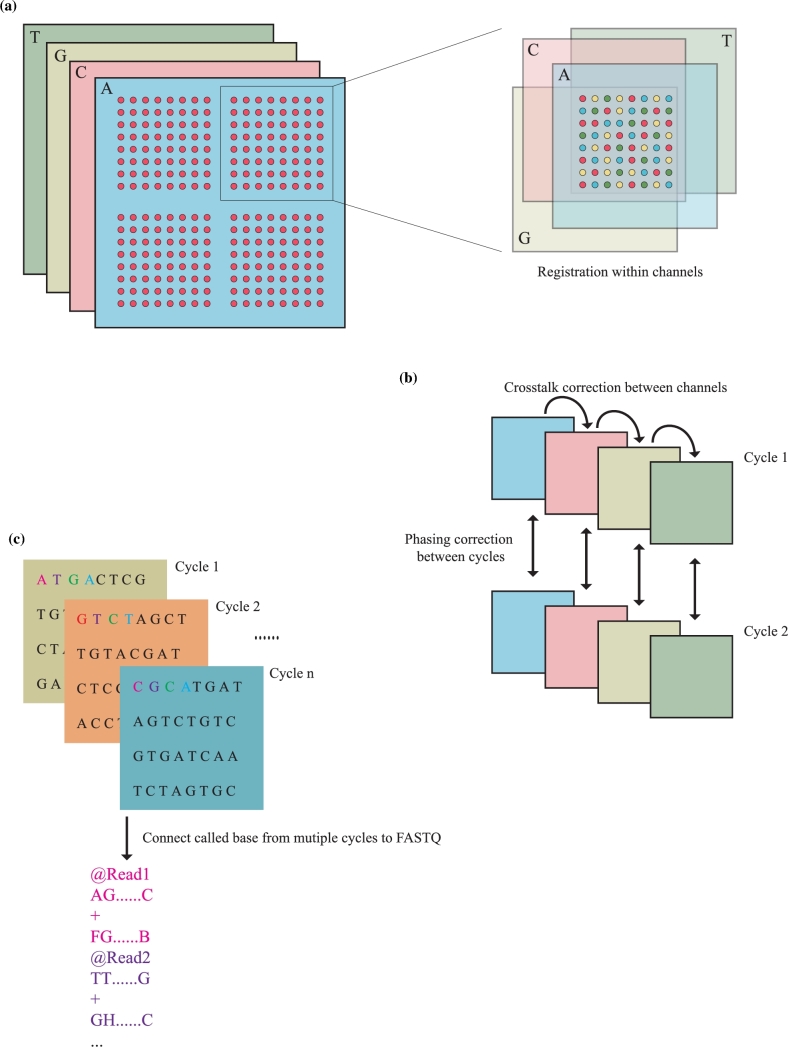
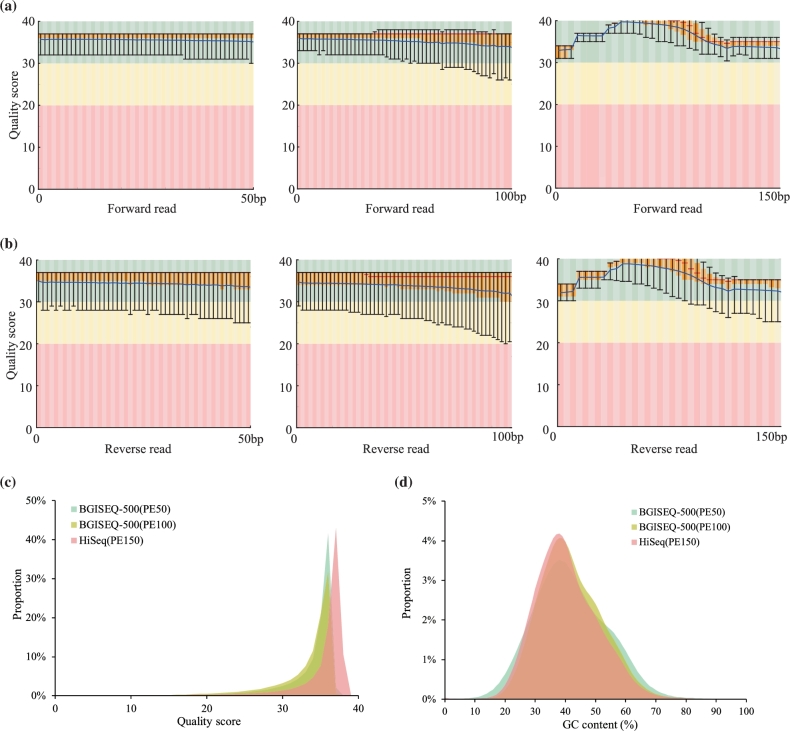
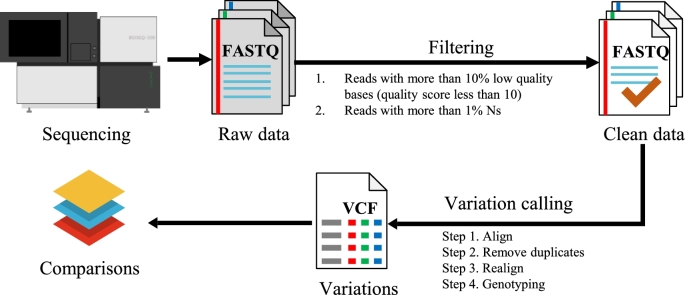
BGISEQ-500 is a new desktop sequencer developed by BGI. Using DNA nanoball and combinational probe anchor synthesis developed from Complete Genomics™ sequencing technologies, it generates short reads at a large scale. Here, we present the first human whole-genome sequencing dataset of BGISEQ-500. The dataset was generated by sequencing the widely used cell line HG001 (NA12878) in two sequencing runs of paired-end 50 bp (PE50) and two sequencing runs of paired-end 100 bp (PE100). We also include examples of the raw images from the sequencer for reference. Finally, we identified variations using this dataset, estimated the accuracy of the variations, and compared to that of the variations identified from similar amounts of publicly available HiSeq2500 data. We found similar single nucleotide polymorphism (SNP) detection accuracy for the BGISEQ-500 PE100 data (false positive rate [FPR] = 0.00020%, sensitivity = 96.20%) compared to the PE150 HiSeq2500 data (FPR = 0.00017%, sensitivity = 96.60%) better SNP detection accuracy than the PE50 data (FPR = 0.0006%, sensitivity = 94.15%). But for insertions and deletions (indels), we found lower accuracy for BGISEQ-500 data (FPR = 0.00069% and 0.00067% for PE100 and PE50 respectively, sensitivity = 88.52% and 70.93%) than the HiSeq2500 data (FPR = 0.00032%, sensitivity = 96.28%). Our dataset can serve as the reference dataset, providing basic information not just for future development, but also for all research and applications based on the new sequencing platform.

Keywords: BGISEQ-500; genomics; next-generation sequencing; sequencing.


Figures

Figure 1:
Figure 1:
Flowchart of library construction and sequencing. The library construction includes fragmentation, size selection, end repair and A-tailing, adaptor ligation, PCR amplification, and splint circularization (a). The sequencing includes making DNBs, loading DNBs and sequencing (b).
Figure 2:
Figure 2:
Raw image data processing on the BGISEQ-500 platform. (a) Registration of images from different channels. Relative coordinates will be calculated according to the pattern layout of DNBs. (b) Intensity correction between channels and cycles. Correction of the optical and chemical interferences on different channels and the neighbor cycles was applied. (c) Connecting called bases to FASTQ. Bases from all cycles will be collected and converted to FASTQ format. Phred score calculation and statistics will be applied during the conversion.
Figure 3:
Figure 3:
Quality control of the dataset after data filtering. Base-wise quality score distributions of the first read (a) from left to right (BGISEQ-500 PE50, BGISEQ-500 PE100, and HiSeq2500 PE150) and the second read (b) from left to right (BGISEQ-500 PE50, BGISEQ-500 PE100, and HiSeq2500 PE150). For each position along the reads, the quality scores of all reads were used to calculate the mean, median, and quantile values; thus the box plot can be shown. The overall quality score distribution of BGISEQ-500 and HiSeq2500 data (c). GC content distribution of the BGISEQ-500 and HiSeq2500 data (d). FastQC [18] was used for the calculation (FastQC, RRID:SCR_014583).
Figure 4:
Figure 4:
Variation calling based on the dataset. The major steps included data filtering, alignment, and variation calling, and the major parameters are also indicated.

Similar articles

Cited by

References

    1. Metzker ML. Sequencing technologies - the next generation. Nat Rev Genet 2010;11(1):31–46. - PubMed
    1. Wang J, Wang W, Li R et al. . The diploid genome sequence of an Asian individual. Nature 2008;456(7218):60–5. - PMC - PubMed
    1. Goodwin S, McPherson JD, McCombie WR. Coming of age: ten years of next-generation sequencing technologies. Nat Rev Genet 2016;17(6):333–51. - PMC - PubMed
    1. Mardis ER. Next-generation sequencing platforms. Annu Rev Anal Chem (Palo Alto Calif) 2013;6:287–303. - PubMed
    1. Quail MA, Smith M, Coupland P et al. . A tale of three next generation sequencing platforms: comparison of Ion Torrent, Pacific Biosciences and Illumina MiSeq sequencers. BMC Genomics 2012;13:341. - PMC - PubMed

Publication types