. 2017 May 19;45(9):5309-5322.
doi: 10.1093/nar/gkx231.

Intra-endosomal trafficking mediated by lysobisphosphatidic acid contributes to intracellular release of phosphorothioate-modified antisense oligonucleotides

Affiliations

Intra-endosomal trafficking mediated by lysobisphosphatidic acid contributes to intracellular release of phosphorothioate-modified antisense oligonucleotides

Shiyu Wang et al. Nucleic Acids Res. .

Abstract

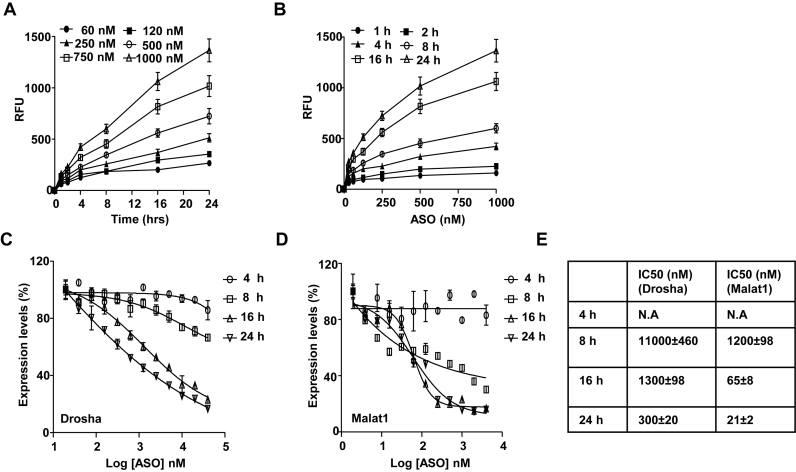
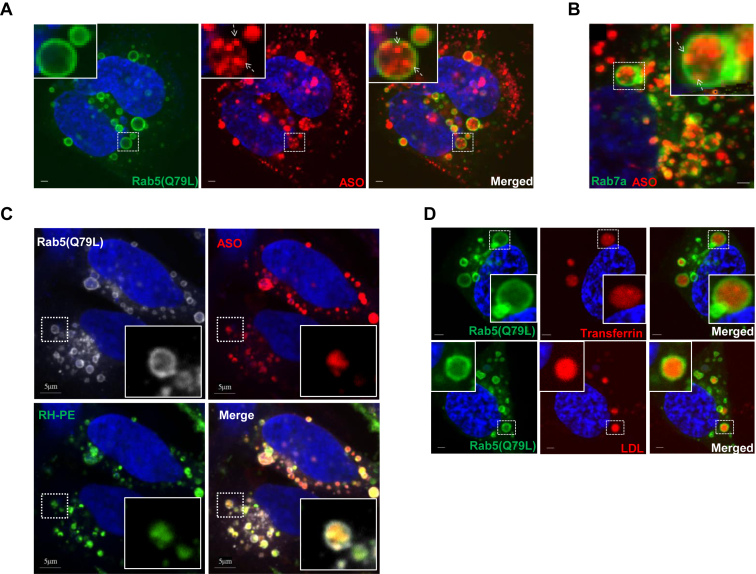
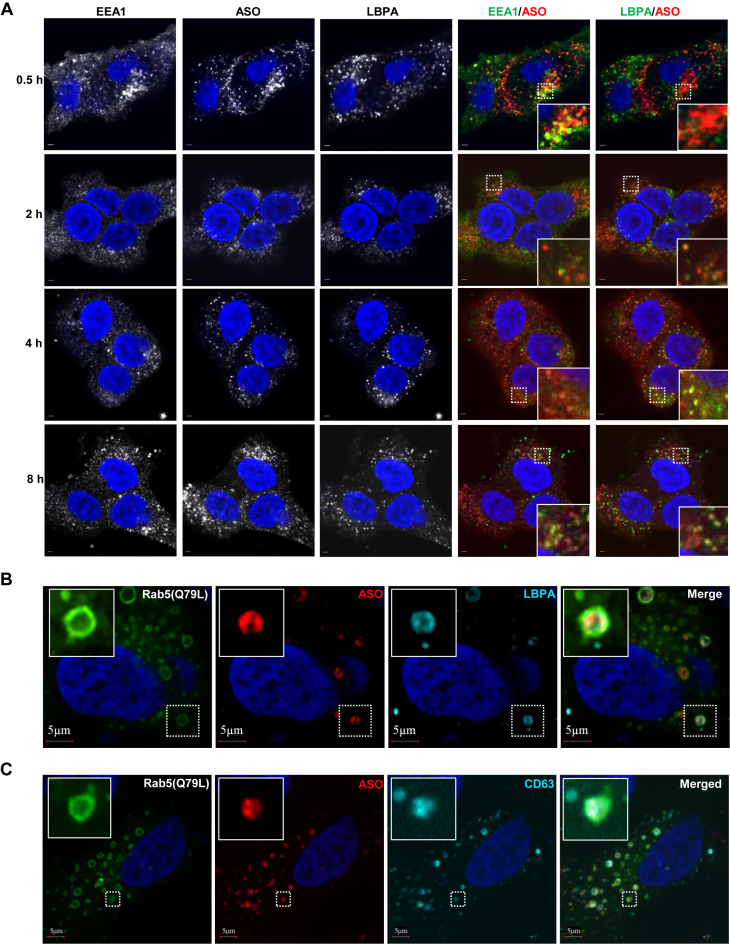
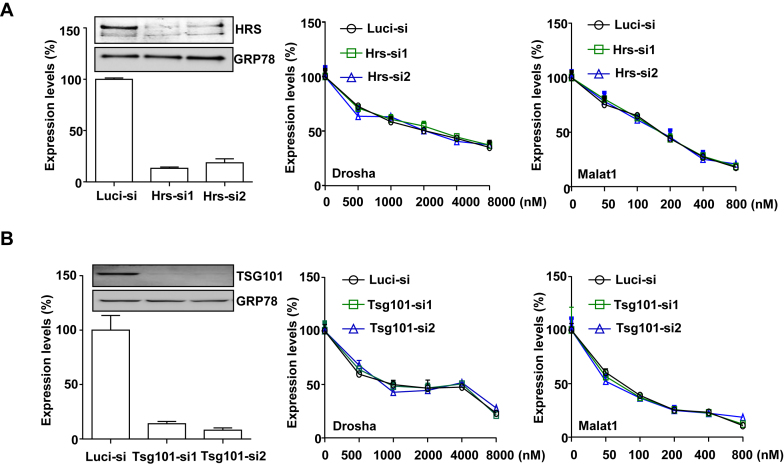
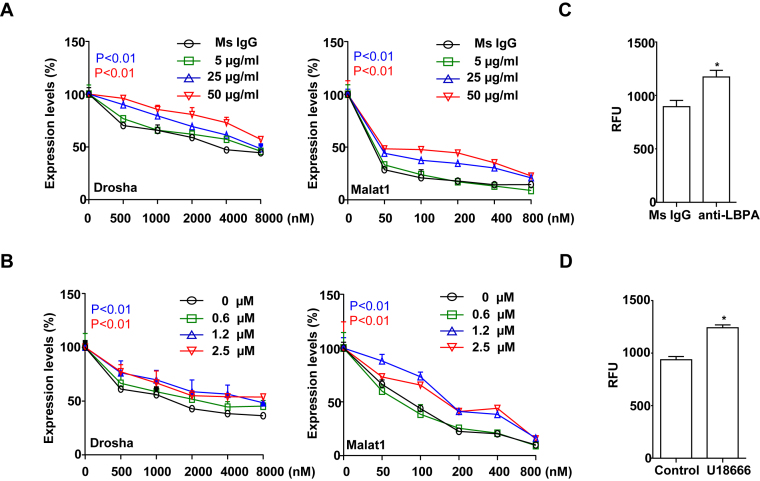
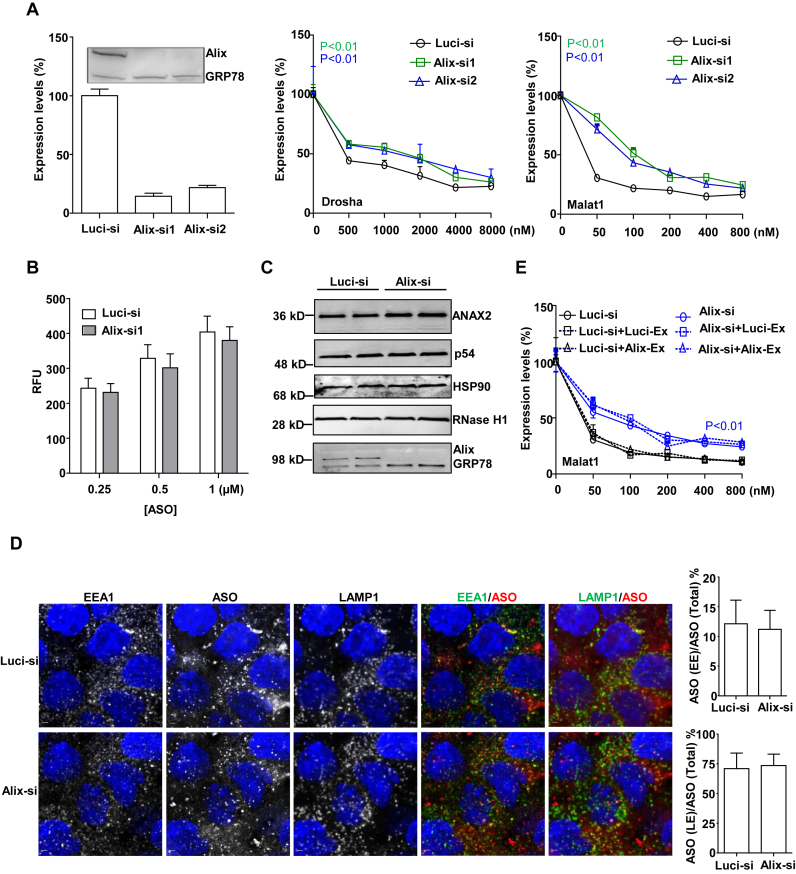
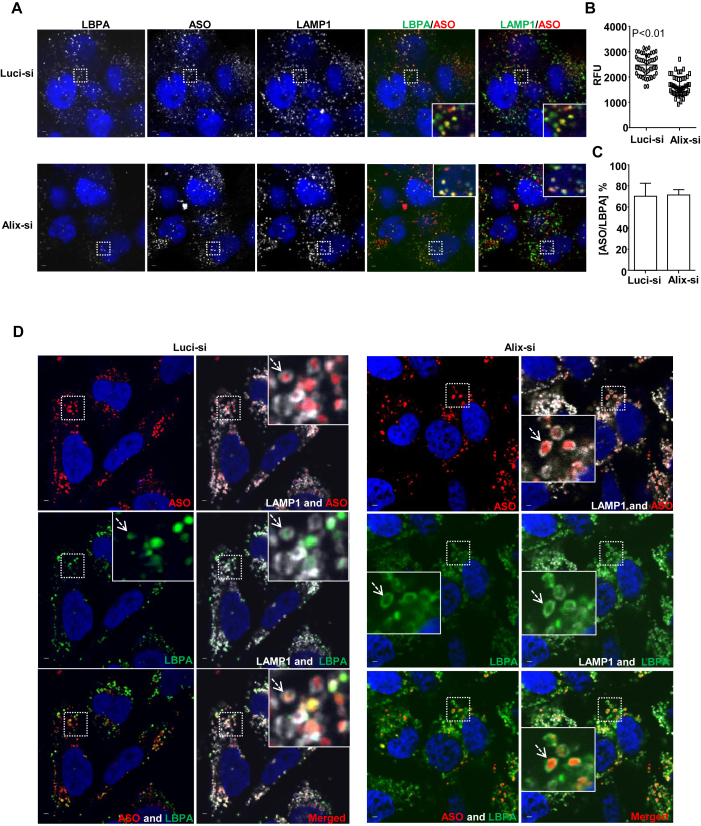
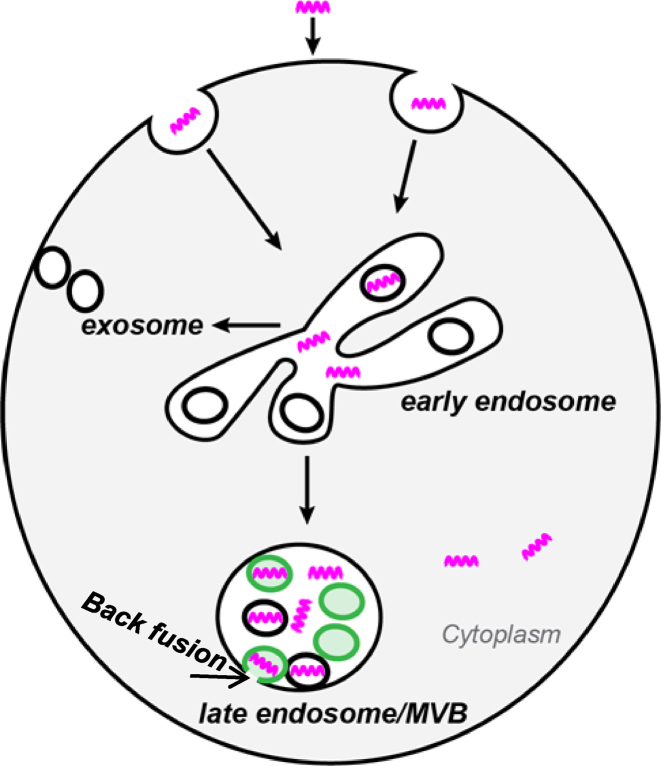
Antisense oligonucleotides (ASOs) with phosphorothioate (PS) linkages are broadly used as research tools and therapeutic agents. Chemically modified PS-ASOs can mediate efficient target reduction by site-specific cleavage of RNA through RNase H1. PS-ASOs are known to be internalized via a number of endocytotic pathways and are released from membrane-enclosed endocytotic organelles, mainly late endosomes (LEs). This study was focused on the details of PS-ASO trafficking through endocytic pathways. It was found that lysobisphosphatidic acid (LBPA) is required for release of PS-ASOs from LEs. PS-ASOs exited early endosomes (EEs) rapidly after internalization and became co-localized with LBPA by 2 hours in LEs. Inside LEs, PS-ASOs and LBPA were co-localized in punctate, dot-like structures, likely intraluminal vesicles (ILVs). Deactivation of LBPA using anti-LBPA antibody significantly decreased PS-ASO activities without affecting total PS-ASO uptake. Reduction of Alix also substantially decreased PS-ASO activities without affecting total PS-ASO uptake. Furthermore, Alix reduction decreased LBPA levels and limited co-localization of LBPA with PS-ASOs at ILVs inside LEs. Thus, the fusion properties of ILVs, which are supported by LBPA, contribute to PS-ASO intracellular release from LEs.


Figures

Figure 1.
Figure 1.
Activity of PS-ASOs through free uptake is mainly determined by intracellular release. (A and B) Intracellular fluorescence of Cy3-PS-ASO was quantified by flow cytometry to determine uptake (RFU) as a function of time at indicated given PS-ASO concentrations (A) and uptake (RFU) as a function of PS-ASO concentration at indicated time points (B). (C and D) Expression of Drosha (C) and Malat1 (D) RNAs as a function of PS-ASO concentration at indicated time points quantified by qRT-PCR. Data are relative to no PS-ASO control. The error bars represent standard deviations from three independent experiments. (E) Values of IC50 were calculated from data plotted in panels based on a non-liner regression model.
Figure 2.
Figure 2.
PS-ASO cargos bud as ILVs inside LEs in live cells. (A) Representative images of cells overexpressing RAB5(Q79L)-GFP (green) treated with 2 μM Cy3-labeled PS-ASO (red) for 4 h. The nuclei were stained with Hoechst 33342 (blue). Scale bar, 5 μm. (B) Representative merged images of cells overexpressing RAB7a-GFP (green) incubated with 2 μM Cy3-labeled PS-ASO (red) for 4 h followed by treatment with YM201636 for an additional 8 h. The nuclei were stained with Hoechst 33342 (blue). Scale bar, 5 μm. (C) Representative images of cells overexpressing RAB5(Q79L)-GFP (gray) and treated with Cy5-labeled PS-ASO (red) and N-Rh-PE (green) for 4 h. The nuclei were stained with Hoechst 33342 (blue). Scale bar, 5 μm. (D) Representative images of cells overexpressing RAB5(Q79L)-GFP (green) treated with Cy5-labeled-transferrin (red) or Alexa Fluor® 594-LDL (red) for 4 h. The nuclei were stained with Hoechst 33342 (blue). Scale bar, 5 μm.
Figure 3.
Figure 3.
PS-ASOs are predominantly co-localized with LBPA-containing ILVs inside LEs. (A) Representative images of immunofluorescent staining for EEA1 (green) and LBPA (green) in HeLa cells incubated with Cy3-labeled PS-ASO (red) for the indicated times. The nuclei were stained with DAPI (blue). Enlarged images showed co-localization between PS-ASOs and EEA1 or LBPA in yellow, Scale bar, 5 μm. (B) Representative images of immunofluorescent staining for LBPA (cyan) in cells overexpressing RAB5(Q79L)-GFP (green) and treated with Cy3-PS-ASO (red). The nuclei were stained with DAPI (blue). Scale bar, 5 μm. (C) Representative images of immunofluorescent staining for CD63 (cyan) in cells overexpressing RAB5(Q79L)-GFP (green) and treated with Cy3-PS-ASO (red). The nuclei were stained with DAPI (blue). Scale bar, 5 μm.
Figure 4.
Figure 4.
ESCRT proteins do not regulate PS-ASO activity. (A) A431 cells were treated with control siRNA targeting luciferase (Luc-si) or siRNAs targeting HRS as indicated. Left panel shows RNA and protein levels of HRS determined by qRT-PCR and Western analyses, respectively. RNA levels are relative to Luc-siRNA treated samples. GRP78 served as a Western loading control. Middle and right panels show data from cells treated with indicated siRNAs for 48 h and then incubated with PS-ASOs targeting either Drosha or Malat1 for 16 h. Drosha and Malat1 RNA levels were quantified using qRT-PCR. The error bars represent standard deviations from three independent experiments. (B) A431 cells were treated with control siRNA targeting luciferase (Luc-si) or siRNAs targeting TSG101 as indicated. Left panel shows RNA and protein levels of TSG101 determined by qRT-PCR and western analyses. RNA levels are relative to control siRNA treated samples. GRP78 served as a western loading control. Middle and right panels show data from cells treated with indicated siRNAs for 48 h and then incubated with PS-ASOs targeting either Drosha or Malat1 for 16 h. RNA levels were quantified using qRT-PCR. The error bars represent standard deviations from three independent experiments.
Figure 5.
Figure 5.
LBPA plays an indispensable role in regulating PS-ASO activity. (A) A431 cells were pre-treated with different concentrations of anti-LBPA antibody or an mouse IgG (Ms IgG) as control for 6 h, followed by incubation with PS-ASOs targeting Drosha or Malat1 RNA for 16 h. The levels of Drosha and Malat1 RNAs were determined by qRT-PCR. The error bars represent standard deviations from three independent experiments. P (in blue, 25 μg/ml) <0.01 versus Ms IgG; P (in red, 50 μg/ml) <0.01 versus Ms IgG. (B) A431 cells were pre-treated with different concentrations of U18666A or control for 6 h, followed by incubation with PS-ASOs targeting Drosha or Malat1 RNA for 16 h. The levels of Drosha and Malat1 RNAs were determined by qRT-PCR. The error bars represent standard errors from three independent experiments. P (in blue, 1.2 μM) <0.01 versus Ms IgG; P (in red, 2.5 μM) <0.01 versus 0 μM. (C) A431 cells were pre-treated with 50 μg/ml anti-LBPA antibody or an IgG control for 6 h, followed by incubation with 1 μM Cy3-labeled PS-ASO for 3 h. PS-ASO uptake was analyzed by flow cytometry. The error bars represent standard errors from three independent experiments. *P < 0.01 versus Ms IgG. (D) A431 cells were pre-treated with 2.5 μM U18666A or ethanol as control for 6 h, followed by incubation with 1 μM Cy3-labeled PS-ASO for 3 h. PS-ASO uptake was analyzed by flow cytometry. The error bars represent standard deviations from 3 independent experiments. *P < 0.01 versus control.
Figure 6.
Figure 6.
Alix is important for PS-ASO activity. (A) A431 cells were treated with control (Luc-si) or siRNAs targeting Alix as indicated. Left panel shows RNA and protein levels of Alix determined by qRT-PCR and western analyses. RNA levels are relative to Luc-siRNA treated samples. GRP78 served as a loading control. Middle and right panels show data from cells treated with siRNAs targeted Alix for 48 h and then incubated with PS-ASOs targeting either Drosha or Malat1 for 16 h. RNA levels were quantified using qRT-PCR. The error bars represent standard deviations from three independent experiments. P < 0.01 (in green, Alix-si1) versus Luci-si; P < 0.01 (in blue, Alix-si2) versus Luci-si; (B) A431 cells treated with control siRNA or siRNA targeting Alix (Alix-si1) were incubated with Cy3-PS-ASOs for 3 h. PS-ASO uptake was analyzed by flow cytometry. The error bars represent standard deviations from three independent experiments. (C) Western analyses for ANXA2, P54nrb, HSP90, RNase H1 and Alix proteins in cells treated with control or Alix siRNAs for 48 h. GRP78 served as a loading control. (D) Representative images of immunofluorescent staining for EEA1 (green), and LAMP1 (green) in A431 cells incubated with Cy3-labeled PS-ASOs (red) for 2 h. Scale bar, 5 μm. The PS-ASO-positive EEs or LEs were counted in 20 cells, and the percentage of the PS-ASO-positive EEs or LEs was calculated relative to the total numbers of the PS-ASO-positive organelles. (E) A431 cells treated with control (Luc-si) or siRNA targeting Alix (Alix-si1) were incubated with PS-ASOs targeting Malat1 for 12 h, followed by the replacement of fresh media without PS-ASOs for another 12 h to allow exosome secretion. Exosomes from either control or Alix-si1-treated cells were added to cells, which were co-treated with Malat1-specific PS-ASOs at different doses. The RNA levels were quantified using qRT-PCR. The error bars represent standard deviations from three independent experiments. P < 0.01 (in blue, either of Alix-si curves) versus either of Luci-si curves.
Figure 7.
Figure 7.
Alix reduction decreases LBPA levels and diminishes co-localization of LBPA with PS-ASOs at ILVs. (A) Representative images of immunofluorescent staining for LBPA (green) and LAMP1 (green) in control- or Alix-siRNA treated A431 cells, which were further incubated with Cy3-labeled PS-ASOs (red) for 2 h. The nuclei were stained with DAPI (blue). Scale bar, 5 μm. (B) Intensities of LBPA in 20 LEs from each of 15 cells were quantified and normalized to intensities of LAMP1 using FV10-ASW 3.0 viewer. P < 0.01, Alix-si versus Luci-si. (C)The PS-ASO-positive organelles co-stained with LBPA were also counted in 20 Luci- or Alix-siRNA treated A431 cells. The percentage of the organelles positive for both PS-ASOs and LBPA was calculated relative to the total numbers of the PS-ASO-positive organelles. (D) Representative images of immunofluorescent staining for LBPA (green) and LAMP1 (gray) in Luci- or Alix-siRNA treated HeLa cells, which were further treated with YM201636 after the incubation with Cy3-labeled PS-ASOs (red) for 4 h. The nuclei were stained with DAPI (blue). Scale bar, 5 μm.
Figure 8.
Figure 8.
Proposed model of LBPA-mediated PS-ASO trafficking and release. PS-ASOs (purple twists) traffic along endocytic pathways from EEs to LEs. In EEs, PS-ASOs begin to be sorted into ILVs. In LEs, PS-ASOs are further sorted into ILVs containing LBPA (green). The deformation potential of LBPA drives the fusion between ILVs and limiting membranes to promote the productive PS-ASO release from LEs into the cytoplasm.

References

    1. Bennett C.F., Swayze E.E.. RNA targeting therapeutics: molecular mechanisms of antisense oligonucleotides as a therapeutic platform. Annu. Rev. Pharmacol. Toxicol. 50:259–293. - PubMed
    1. Beltinger C., Saragovi H.U., Smith R.M., LeSauteur L., Shah N., DeDionisio L., Christensen L., Raible A., Jarett L., Gewirtz A.M.. Binding, uptake, and intracellular trafficking of phosphorothioate-modified oligodeoxynucleotides. J. Clin. Invest. 1995; 95:1814–1823. - PMC - PubMed
    1. Crooke S.T. Progress in antisense technology. Annu. Rev. Med. 2004; 55:61–95. - PubMed
    1. Juliano R.L., Carver K.. Cellular uptake and intracellular trafficking of oligonucleotides. Adv. Drug Deliv. Rev. 2015; 87:35–45. - PMC - PubMed
    1. Juliano R.L., Ming X., Nakagawa O.. Cellular uptake and intracellular trafficking of antisense and siRNA oligonucleotides. Bioconjug. Chem. 2012; 23:147–157. - PMC - PubMed

MeSH terms