

Fusing Biodiversity Metrics into Investigations of Daily Life: Illustrations and Recommendations With Emodiversity
- PMID: 28379556
- PMCID: PMC5939690
- DOI: 10.1093/geronb/gbx025
Fusing Biodiversity Metrics into Investigations of Daily Life: Illustrations and Recommendations With Emodiversity
Abstract
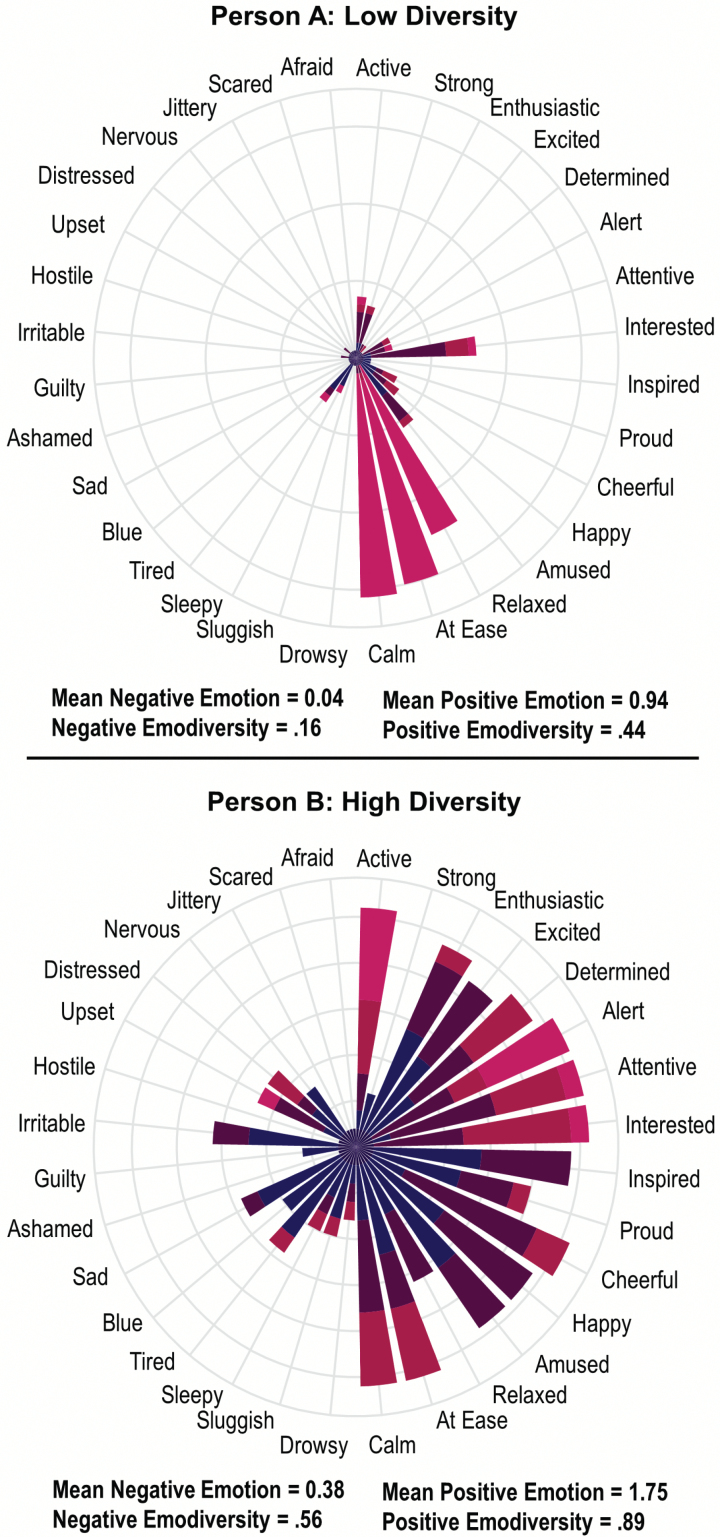
Objectives: Functionalist emotion and ecological systems theories suggest emodiversity-the variety and relative abundance of individuals' emotion experiences-is beneficial for psychological and physical health and may change with age. This paper examines and provides recommendations for operationalization of diversity-type intraindividual variability (IIV) constructs using intensive longitudinal data, and demonstrates the utility of emodiversity by examining its links to physical health moderated by mean levels of emotion and age.
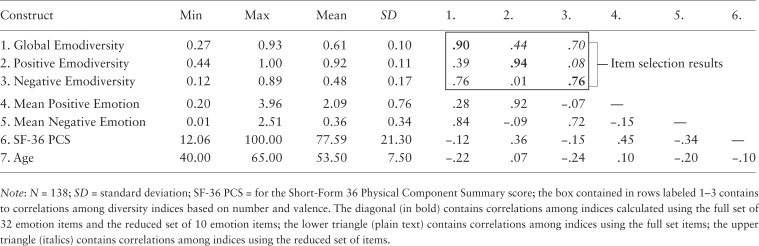
Method: Using data from a daily diary study of 138 adults (age 40 to 65 years), we consider how item selection, response scale, choice of diversity index, and number of occasions enable/constrain mapping to theory, measurement reliability, and empirical inquiry.
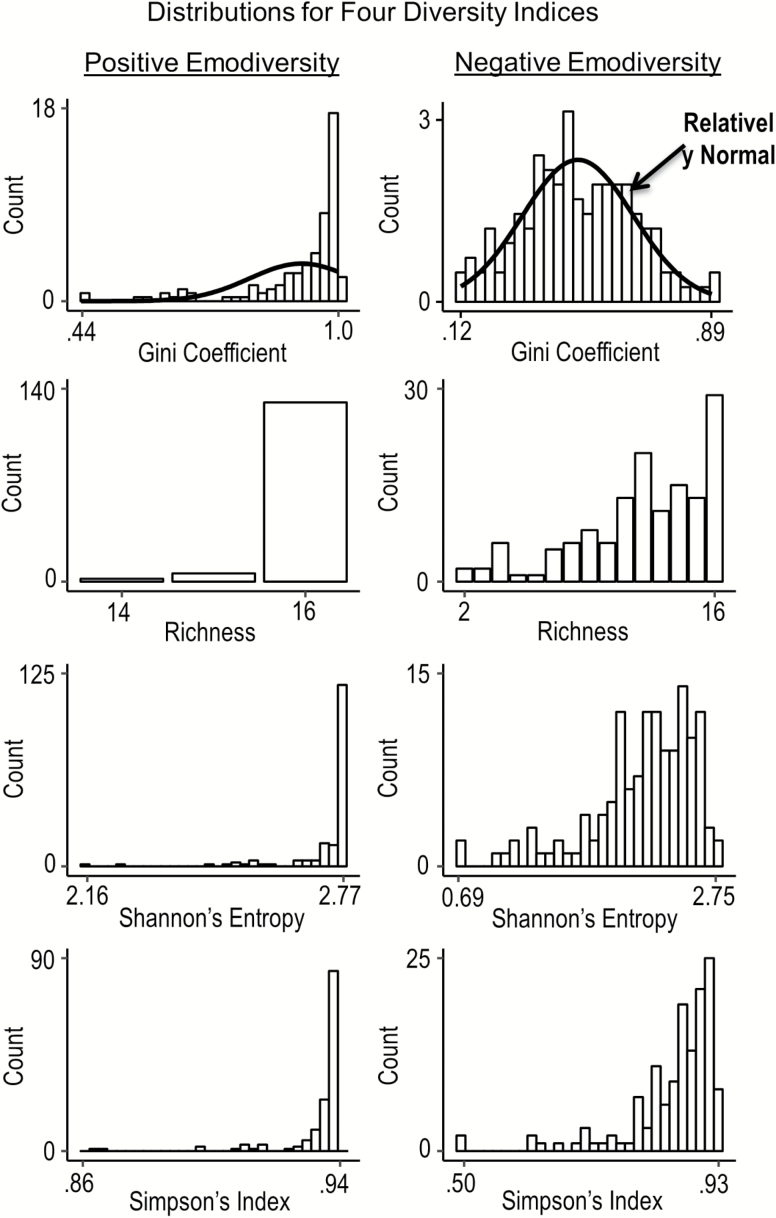
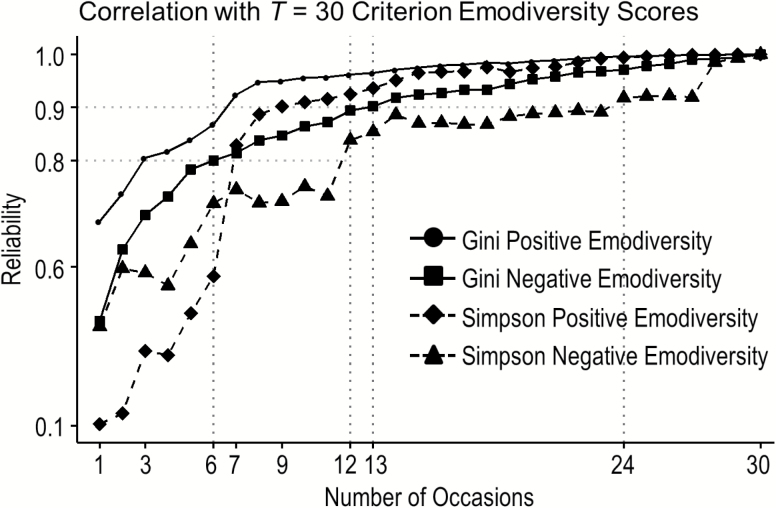
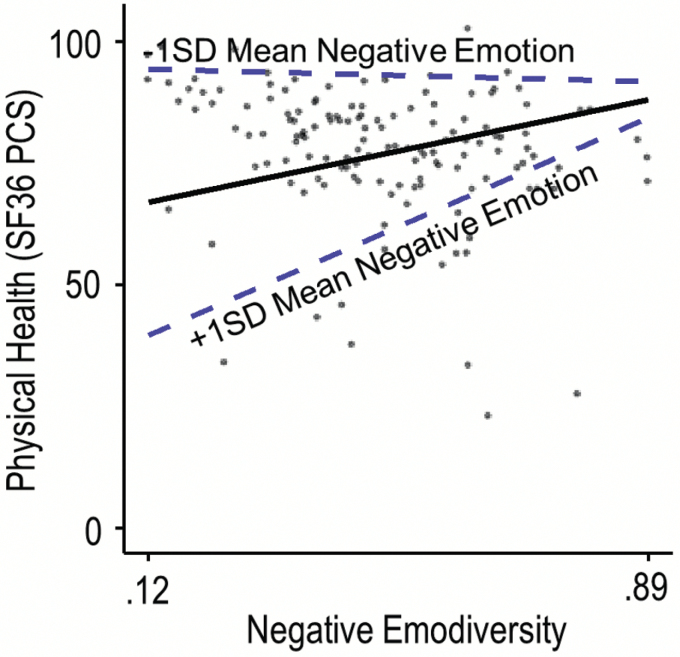
Results: Item selection and response scale had limited influence on rank-order differences in diversity. Reliable measurement (r ≥ .8) required a minimum of 6 to 12 occasions depending on choice of index, theoretical conception, study design, and distribution of diversity scores. The empirical findings suggest mean level of negative affect, rather than age, moderates the relation between negative emodiversity and health.
Discussion: This study provides recommendations for the calculation of diversity-type IIV constructs and illustrates the potential for study of emodiversity to contribute to understanding of successful aging.
Keywords: Diversity; Emotion; Intraindividual variability; Longitudinal analysis.
© The Author 2017. Published by Oxford University Press on behalf of The Gerontological Society of America. All rights reserved. For permissions, please e-mail: journals.permissions@oup.com.
Figures
References
-
- Barrett L. F. (1998). Discrete emotions or dimensions? The role of valence focus and arousal focus. Cognition & Emotion, 12, 579–599. doi:10.1080/026999398379574
-
- Barrett K., & Campos J (1987). Perspectives on emotional development: II. A functionalist approach to emotion. In Osofsky J. (Ed.), Handbook of infant development (2nd ed., pp. 555–578). New York, NY: Wiley.
-
- Barrett L. F. GrossJ.Christensen T. C., & Benvenuto M (2001). Knowing what you’re feeling and knowing what to do about it: Mapping the relation between emotion differentiation and emotion regulation. Cognition & Emotion, 15, 713–724. doi:10.1080/02699930143000239
-
- Brose A., Lindenberger U., Schmiedek F. (2013). Affective states contribute to trait reports of affective well-being. Emotion, 13, 940–948. doi:10.1037/a0032401 - PubMed
-
- Budescu D. V., Budescu M. (2012). How to measure diversity when you must. Psychological Methods, 17, 215–227. doi:10.1037/a0027129 - PubMed
Publication types
MeSH terms
Grants and funding
LinkOut - more resources
Full Text Sources
Other Literature Sources
Medical
Molecular Biology Databases
