. 2017 Apr 13;544(7649):245-249.
doi: 10.1038/nature21722. Epub 2017 Apr 5.

Myt1l safeguards neuronal identity by actively repressing many non-neuronal fates

Affiliations

Myt1l safeguards neuronal identity by actively repressing many non-neuronal fates

Moritz Mall et al. Nature. .

Erratum in

Abstract

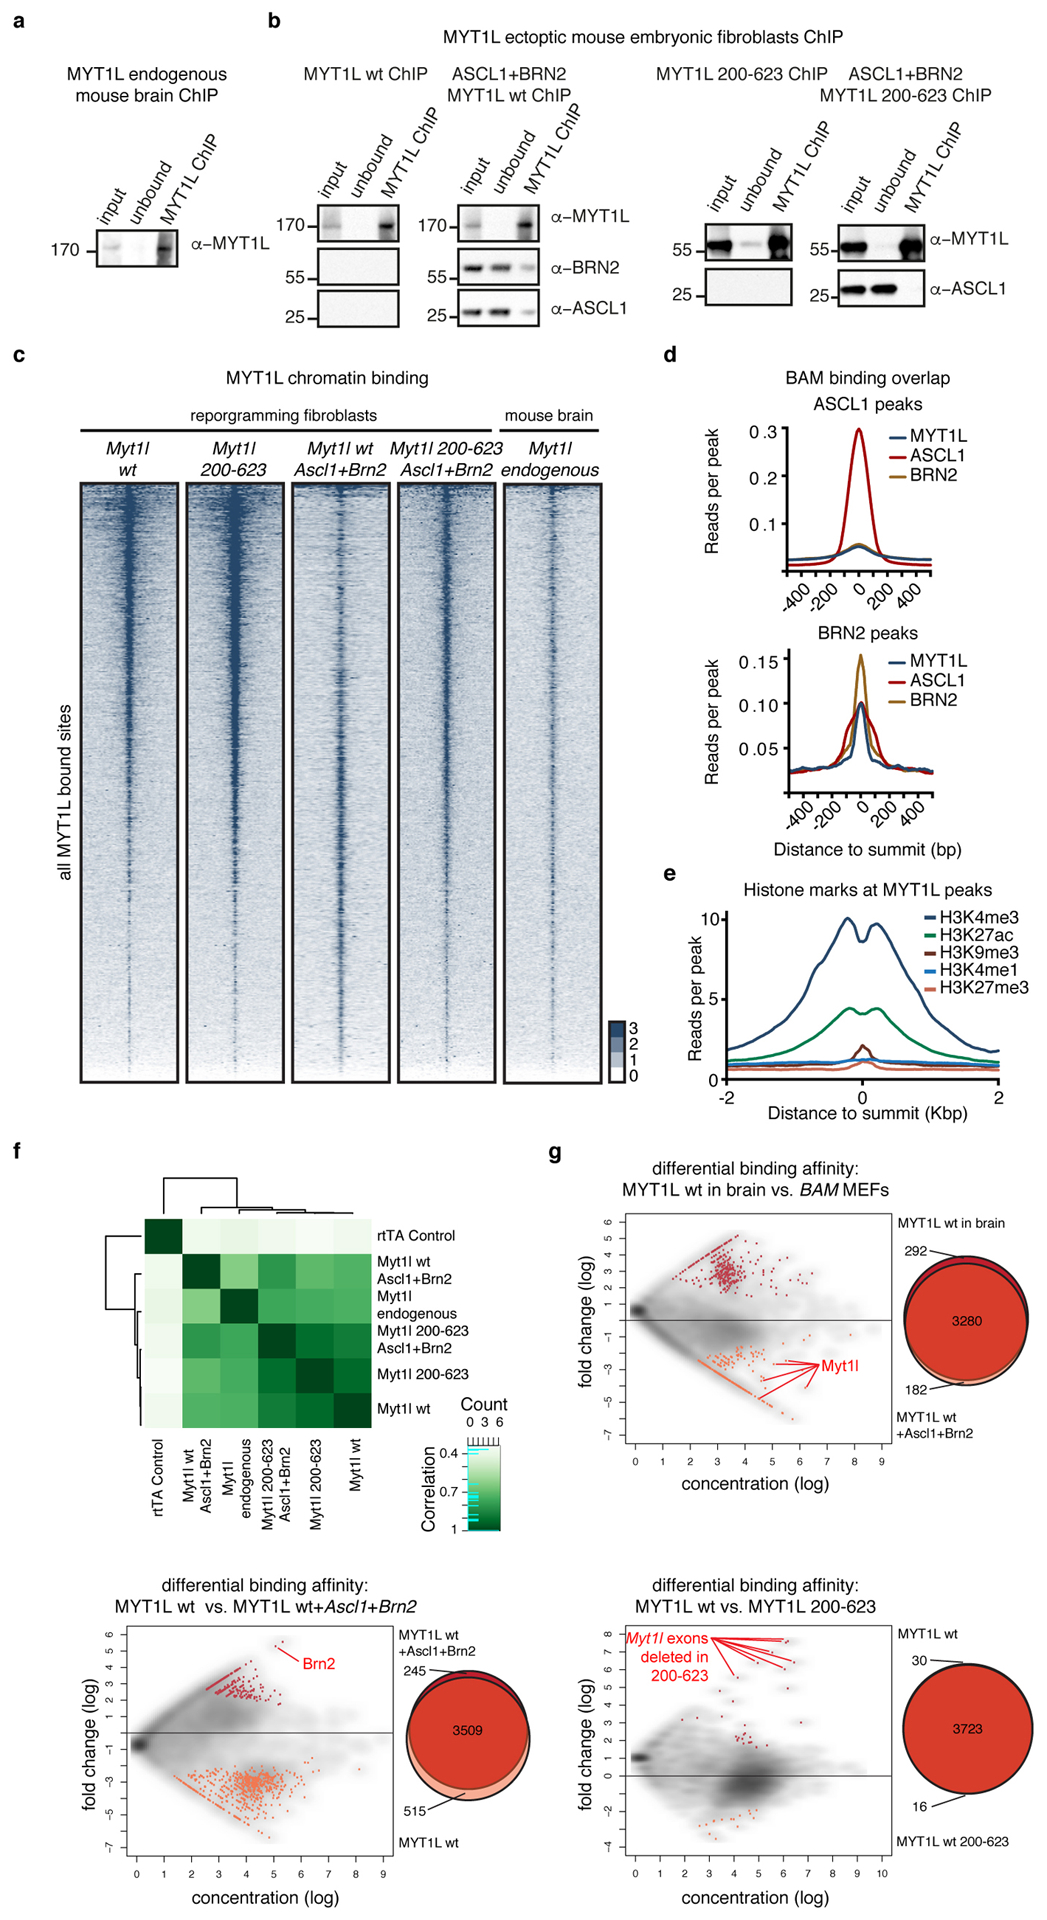
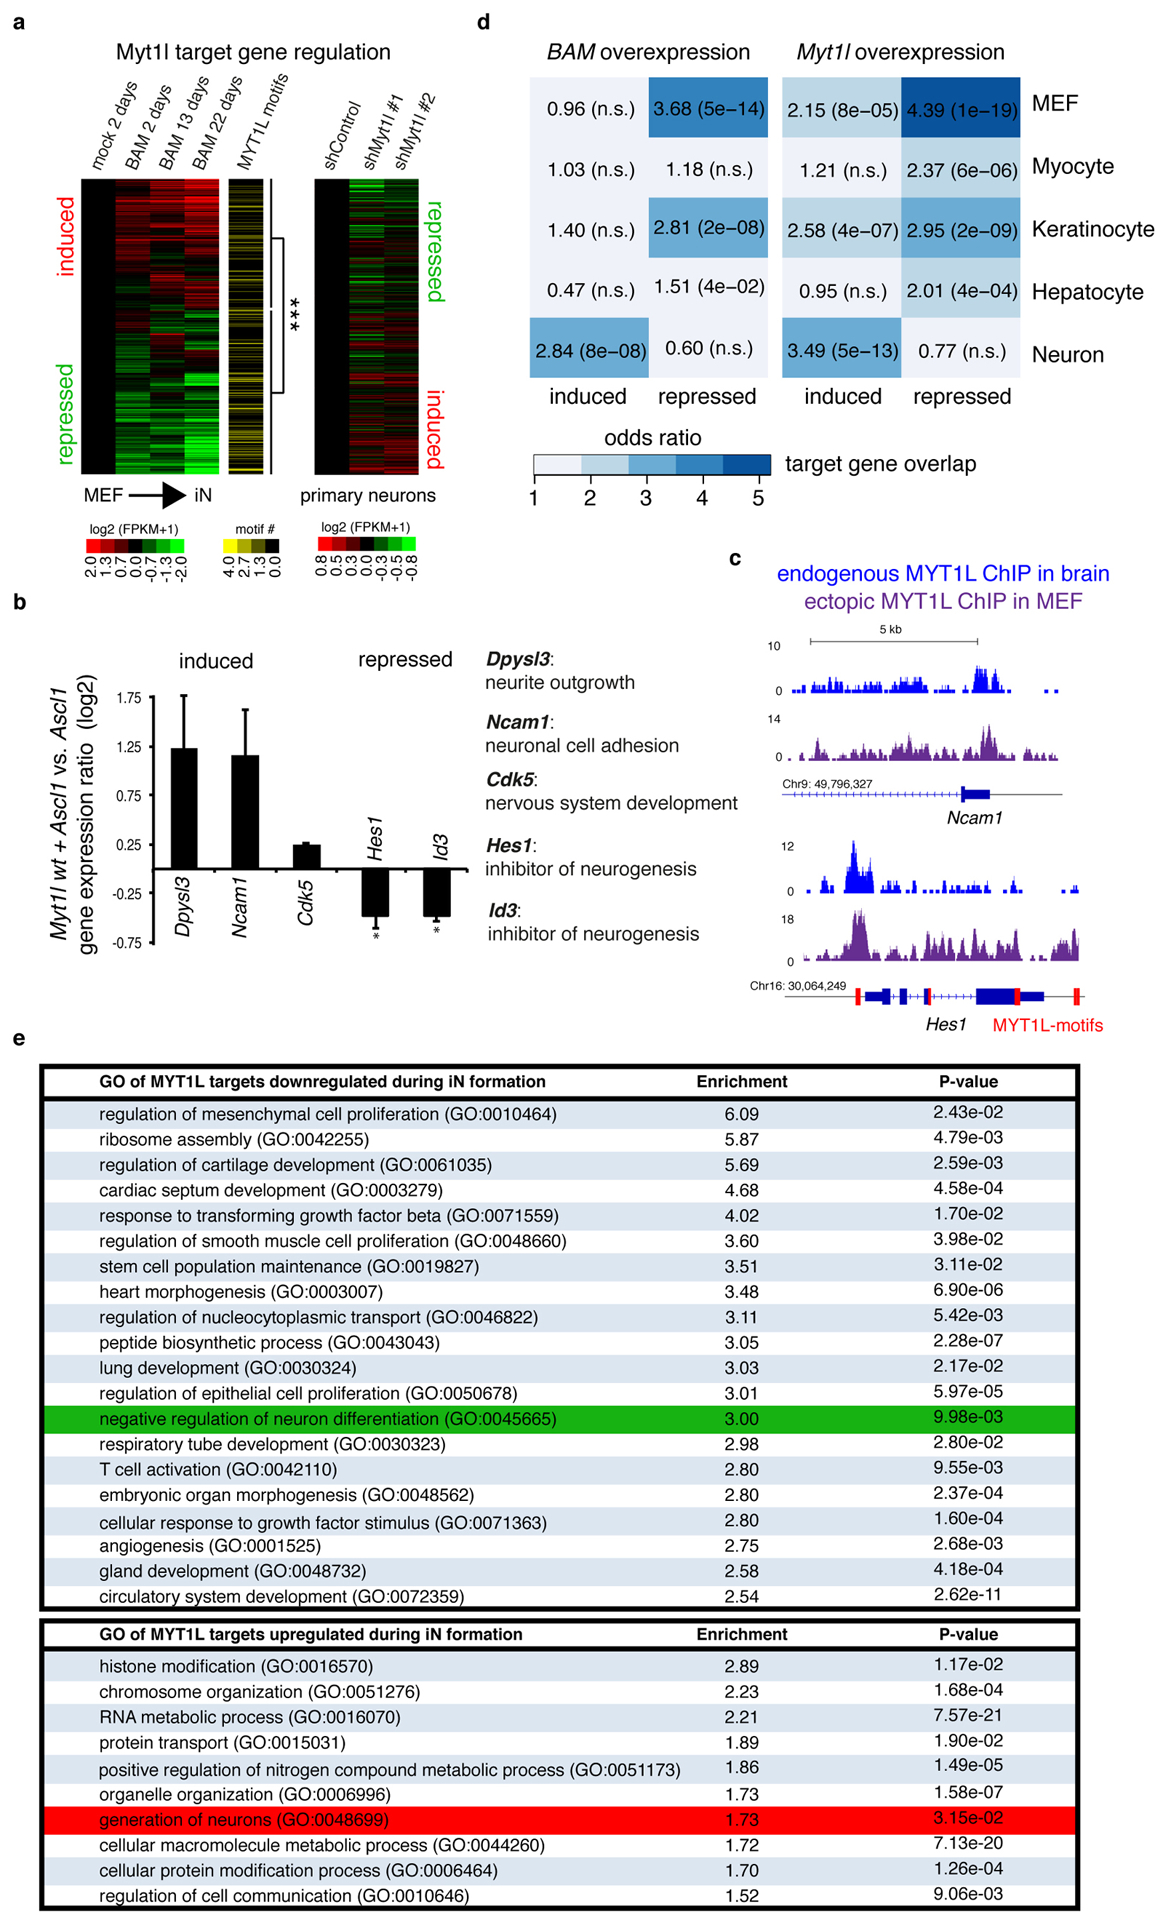
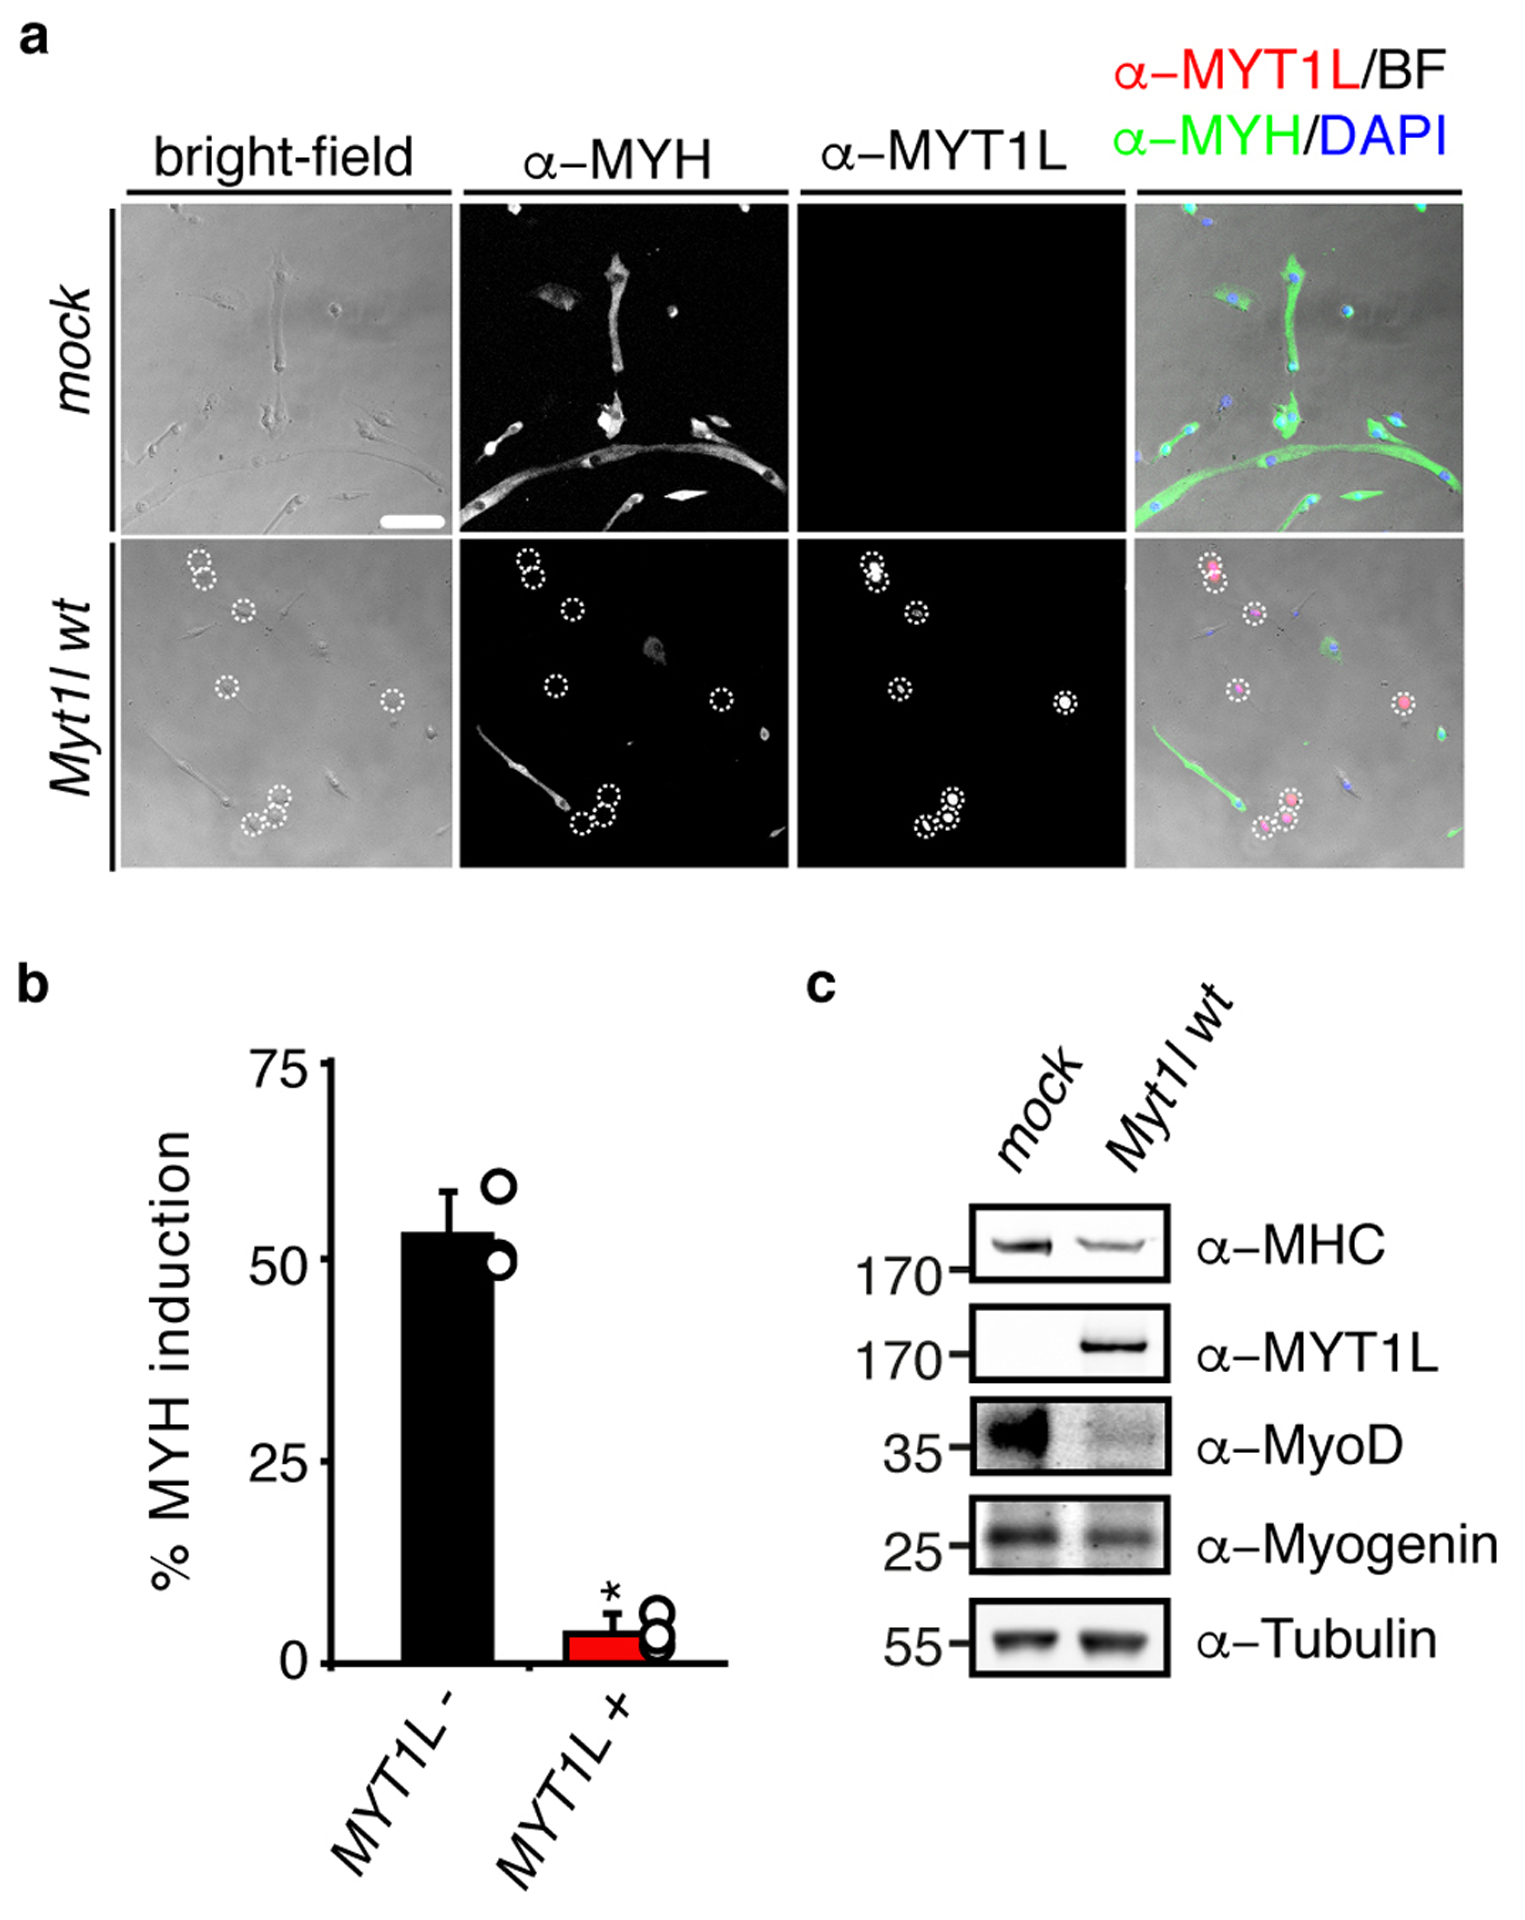
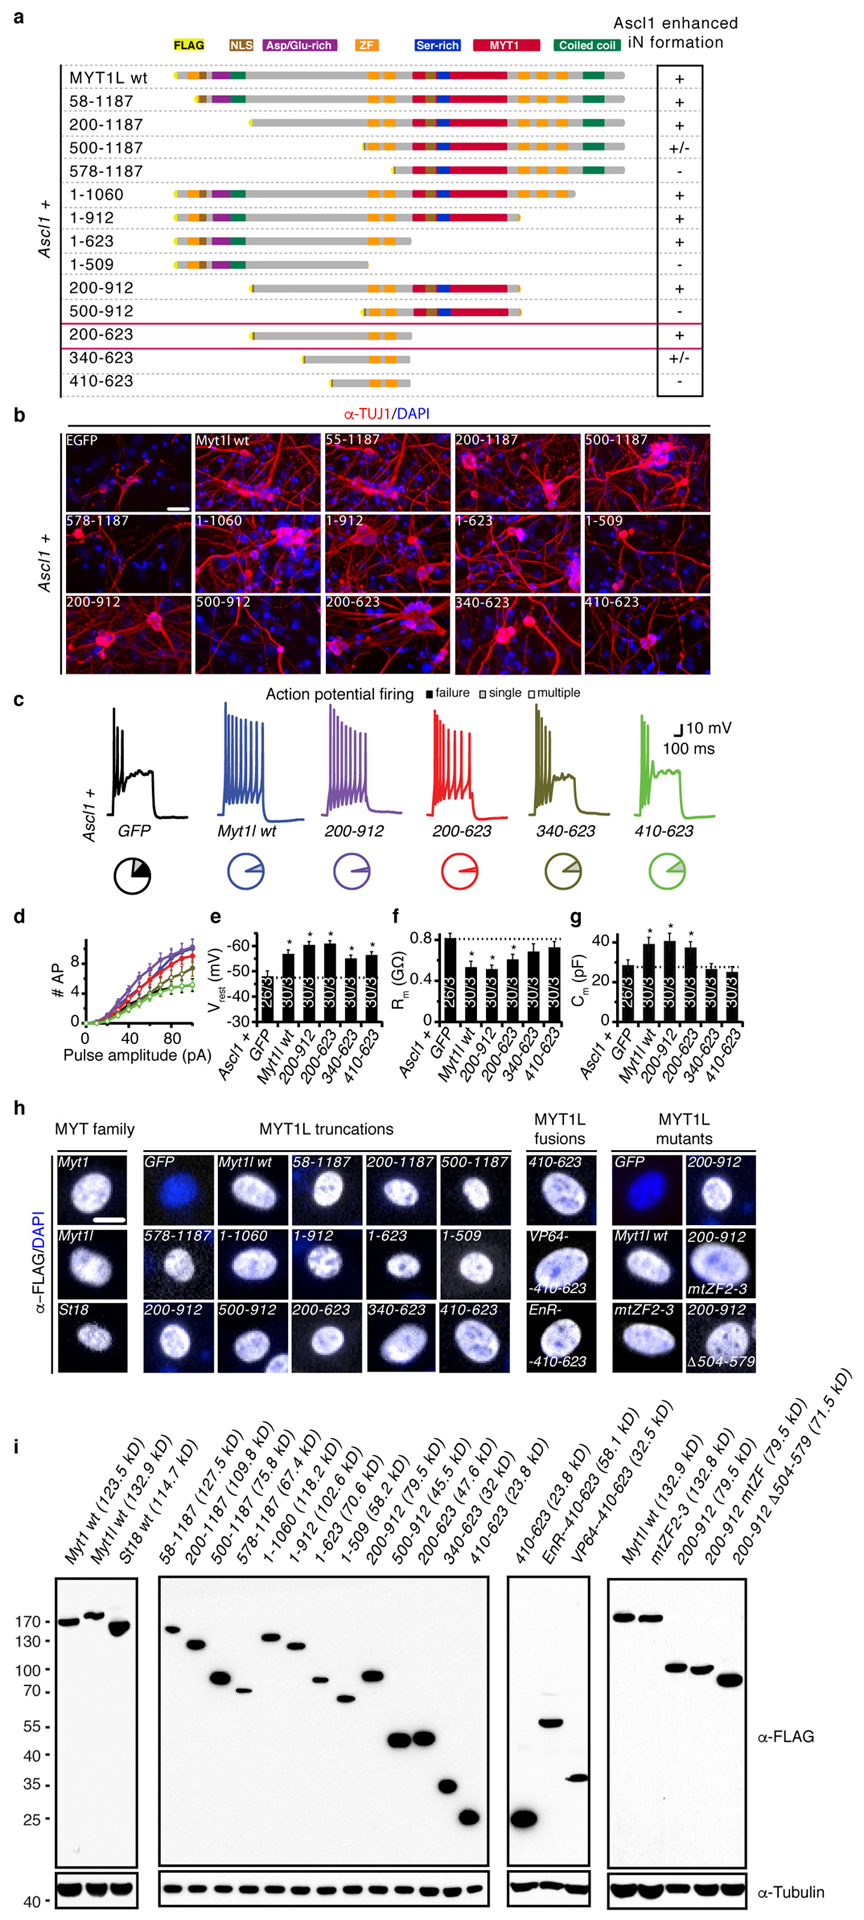
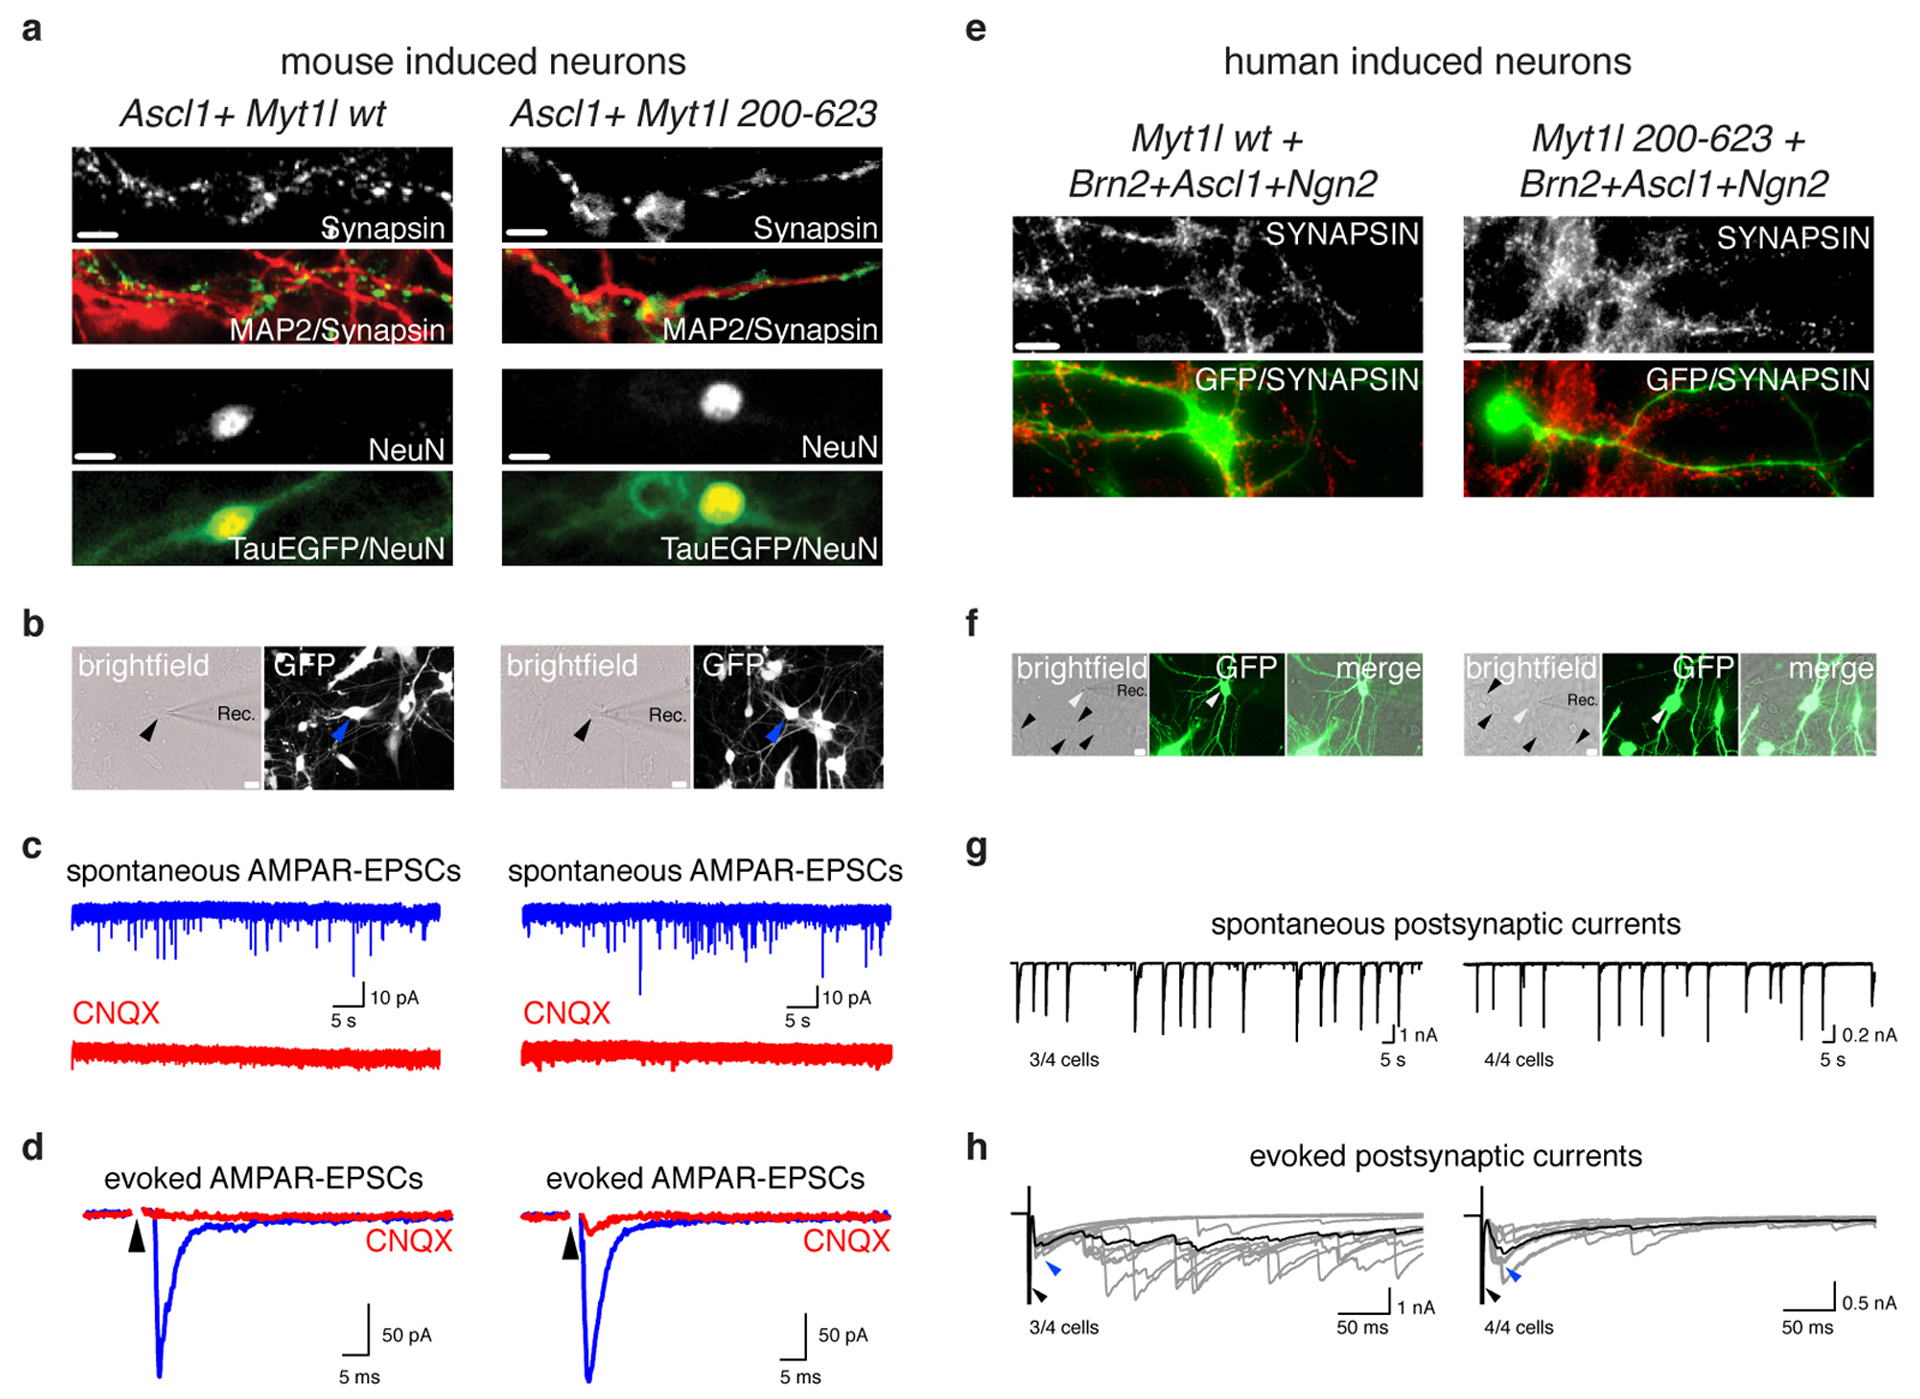
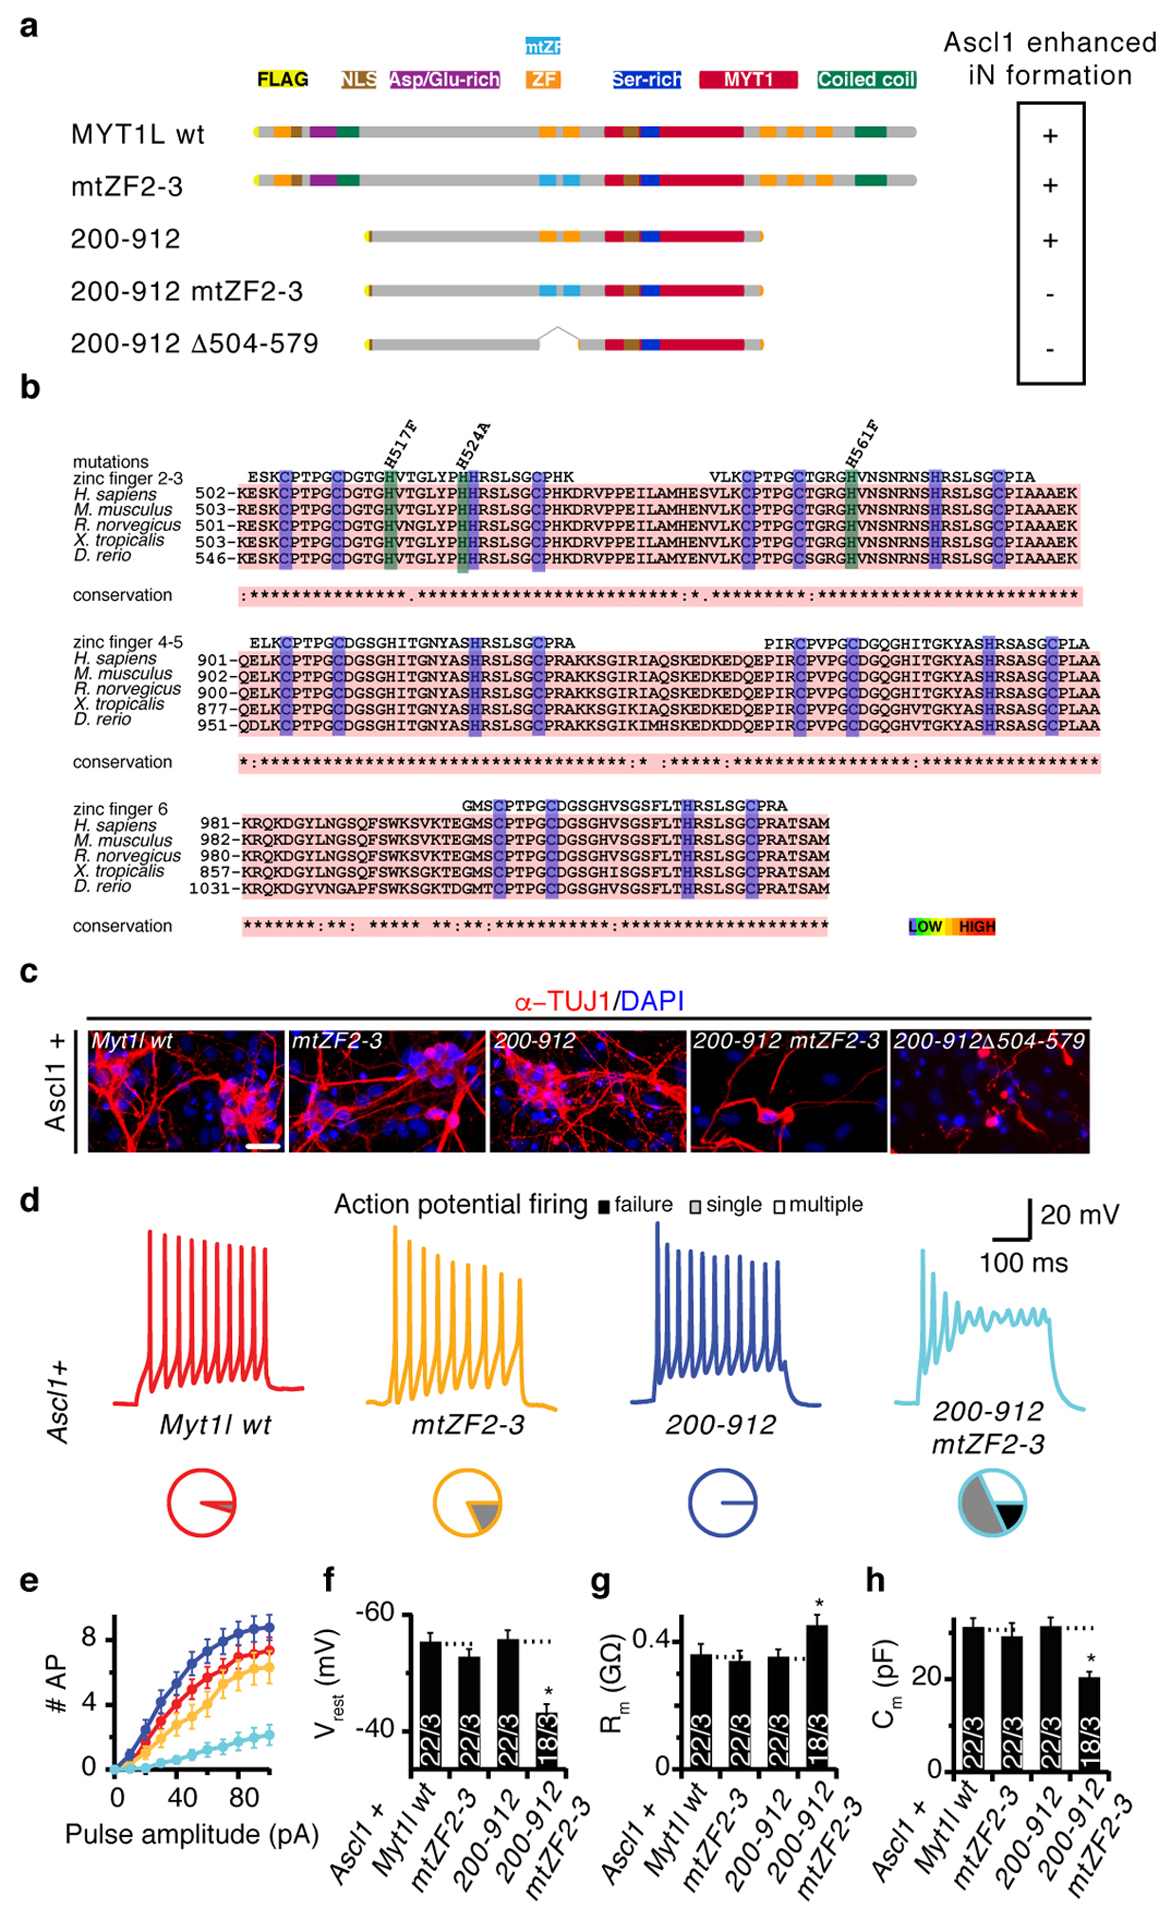
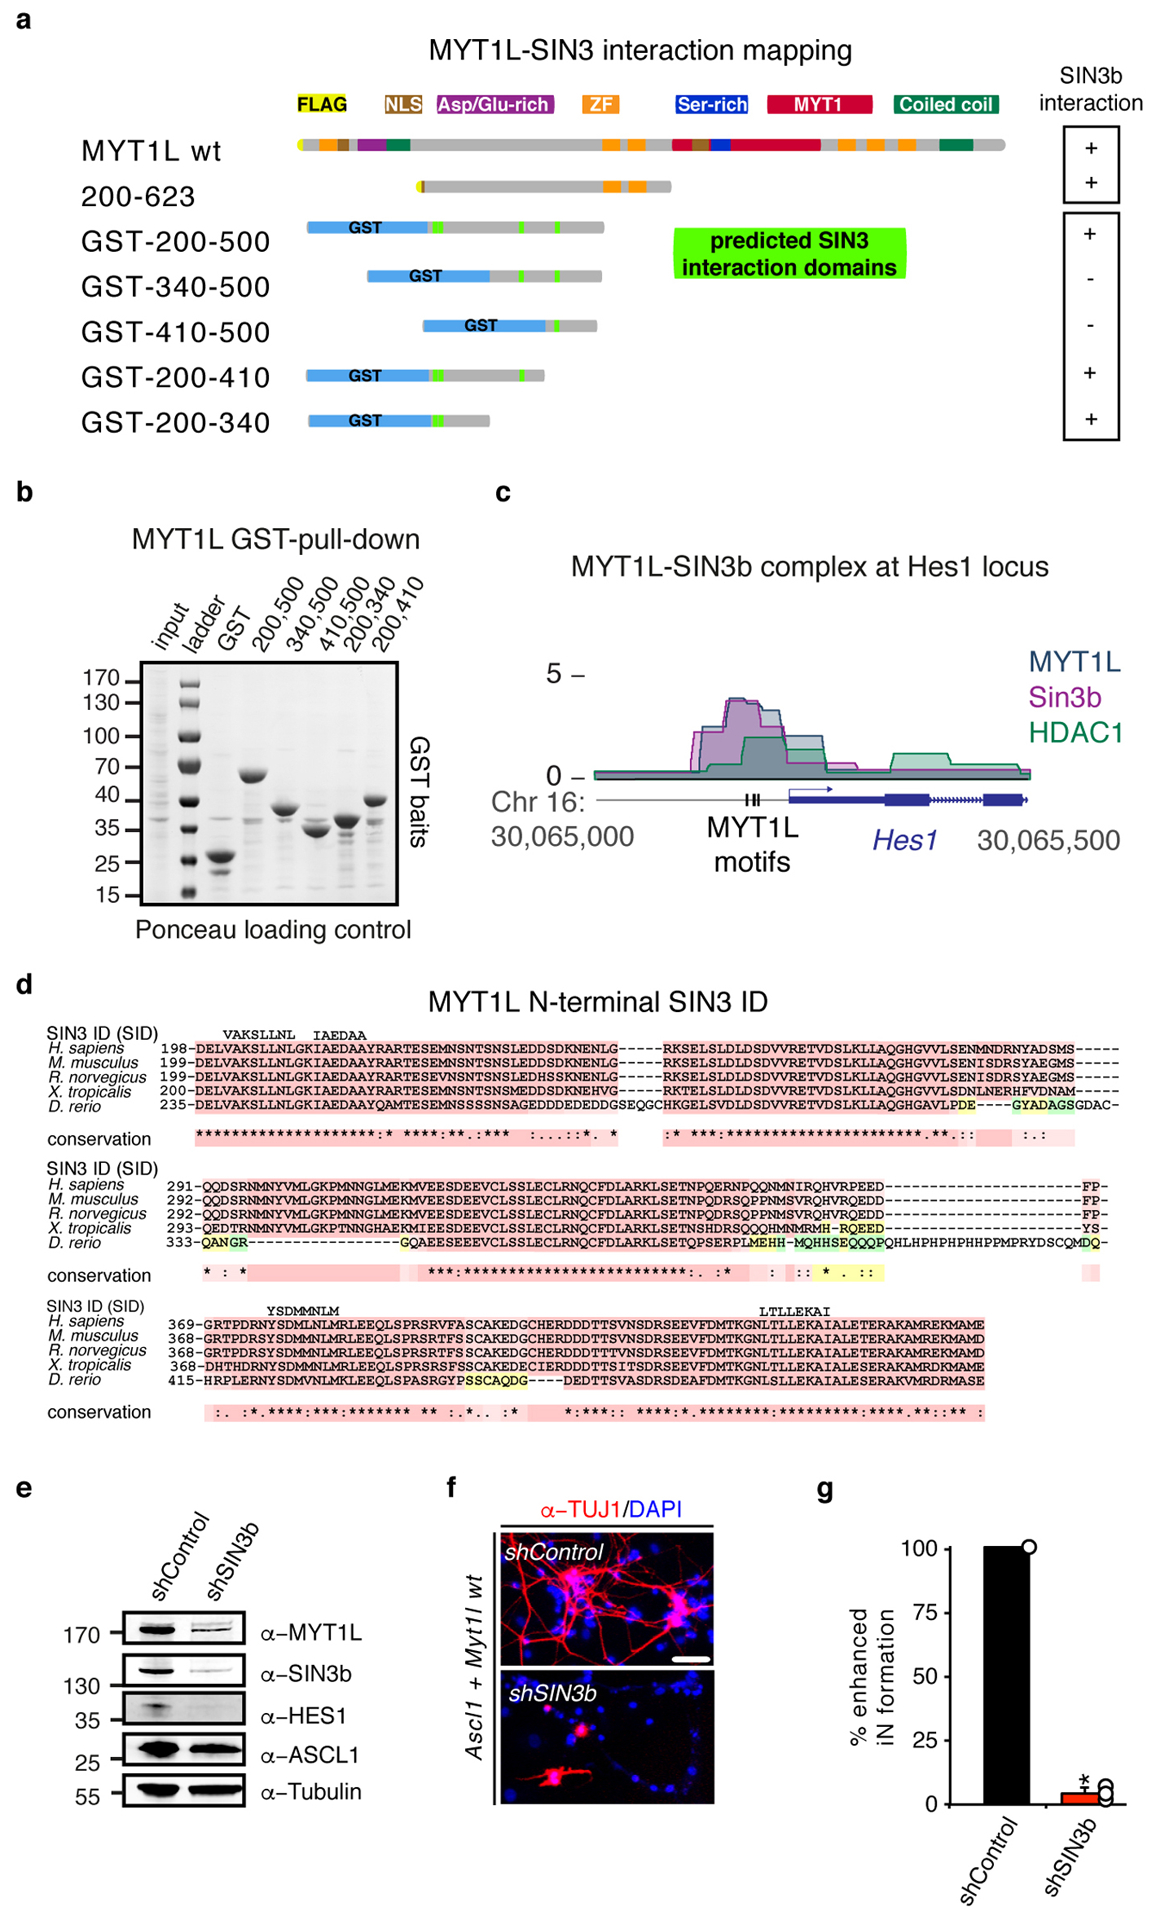
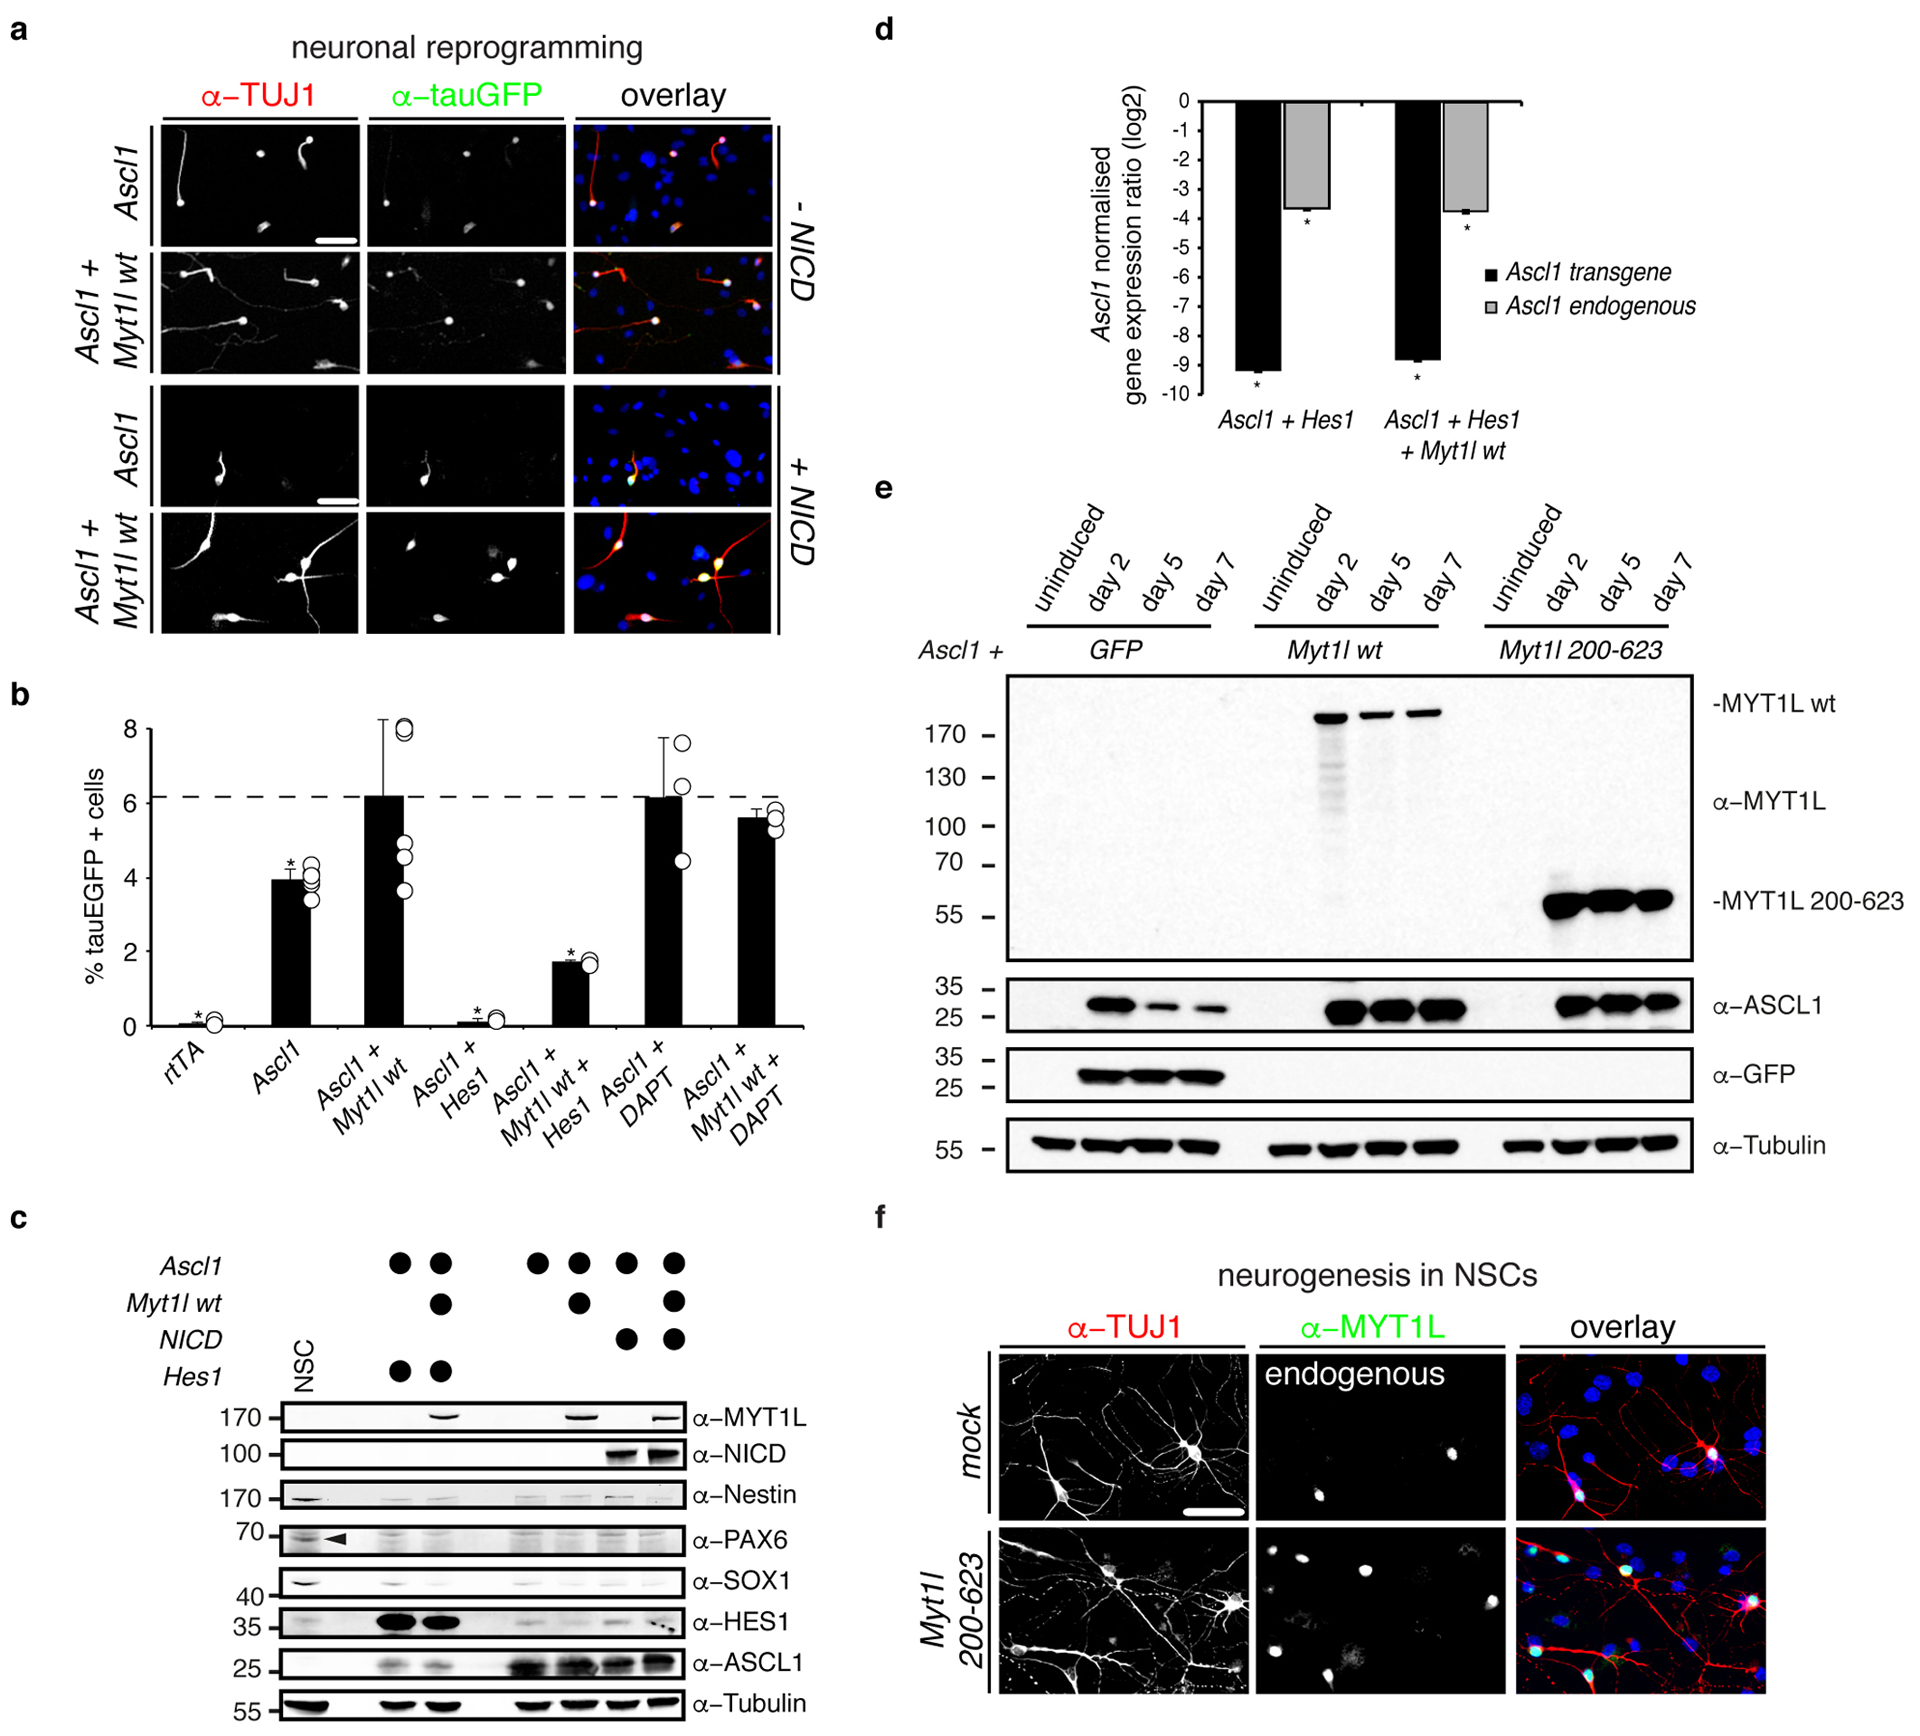
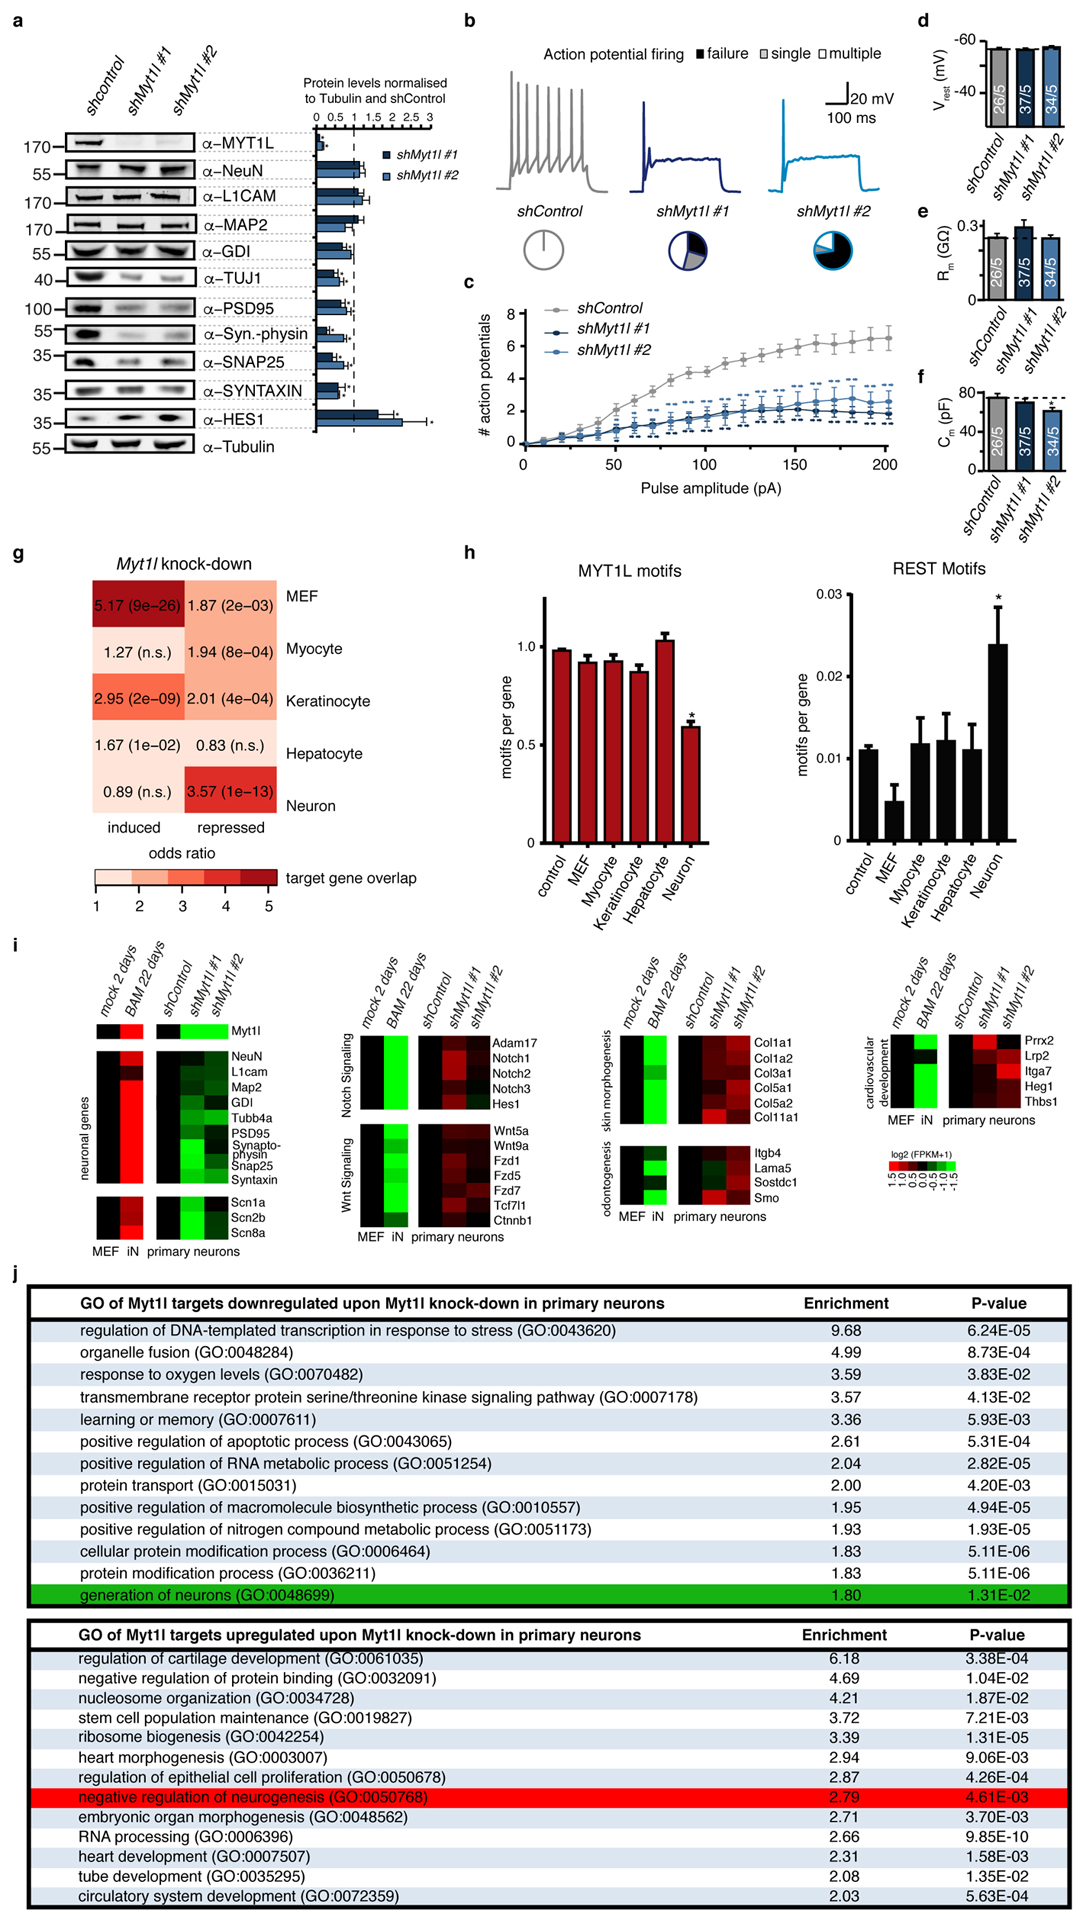
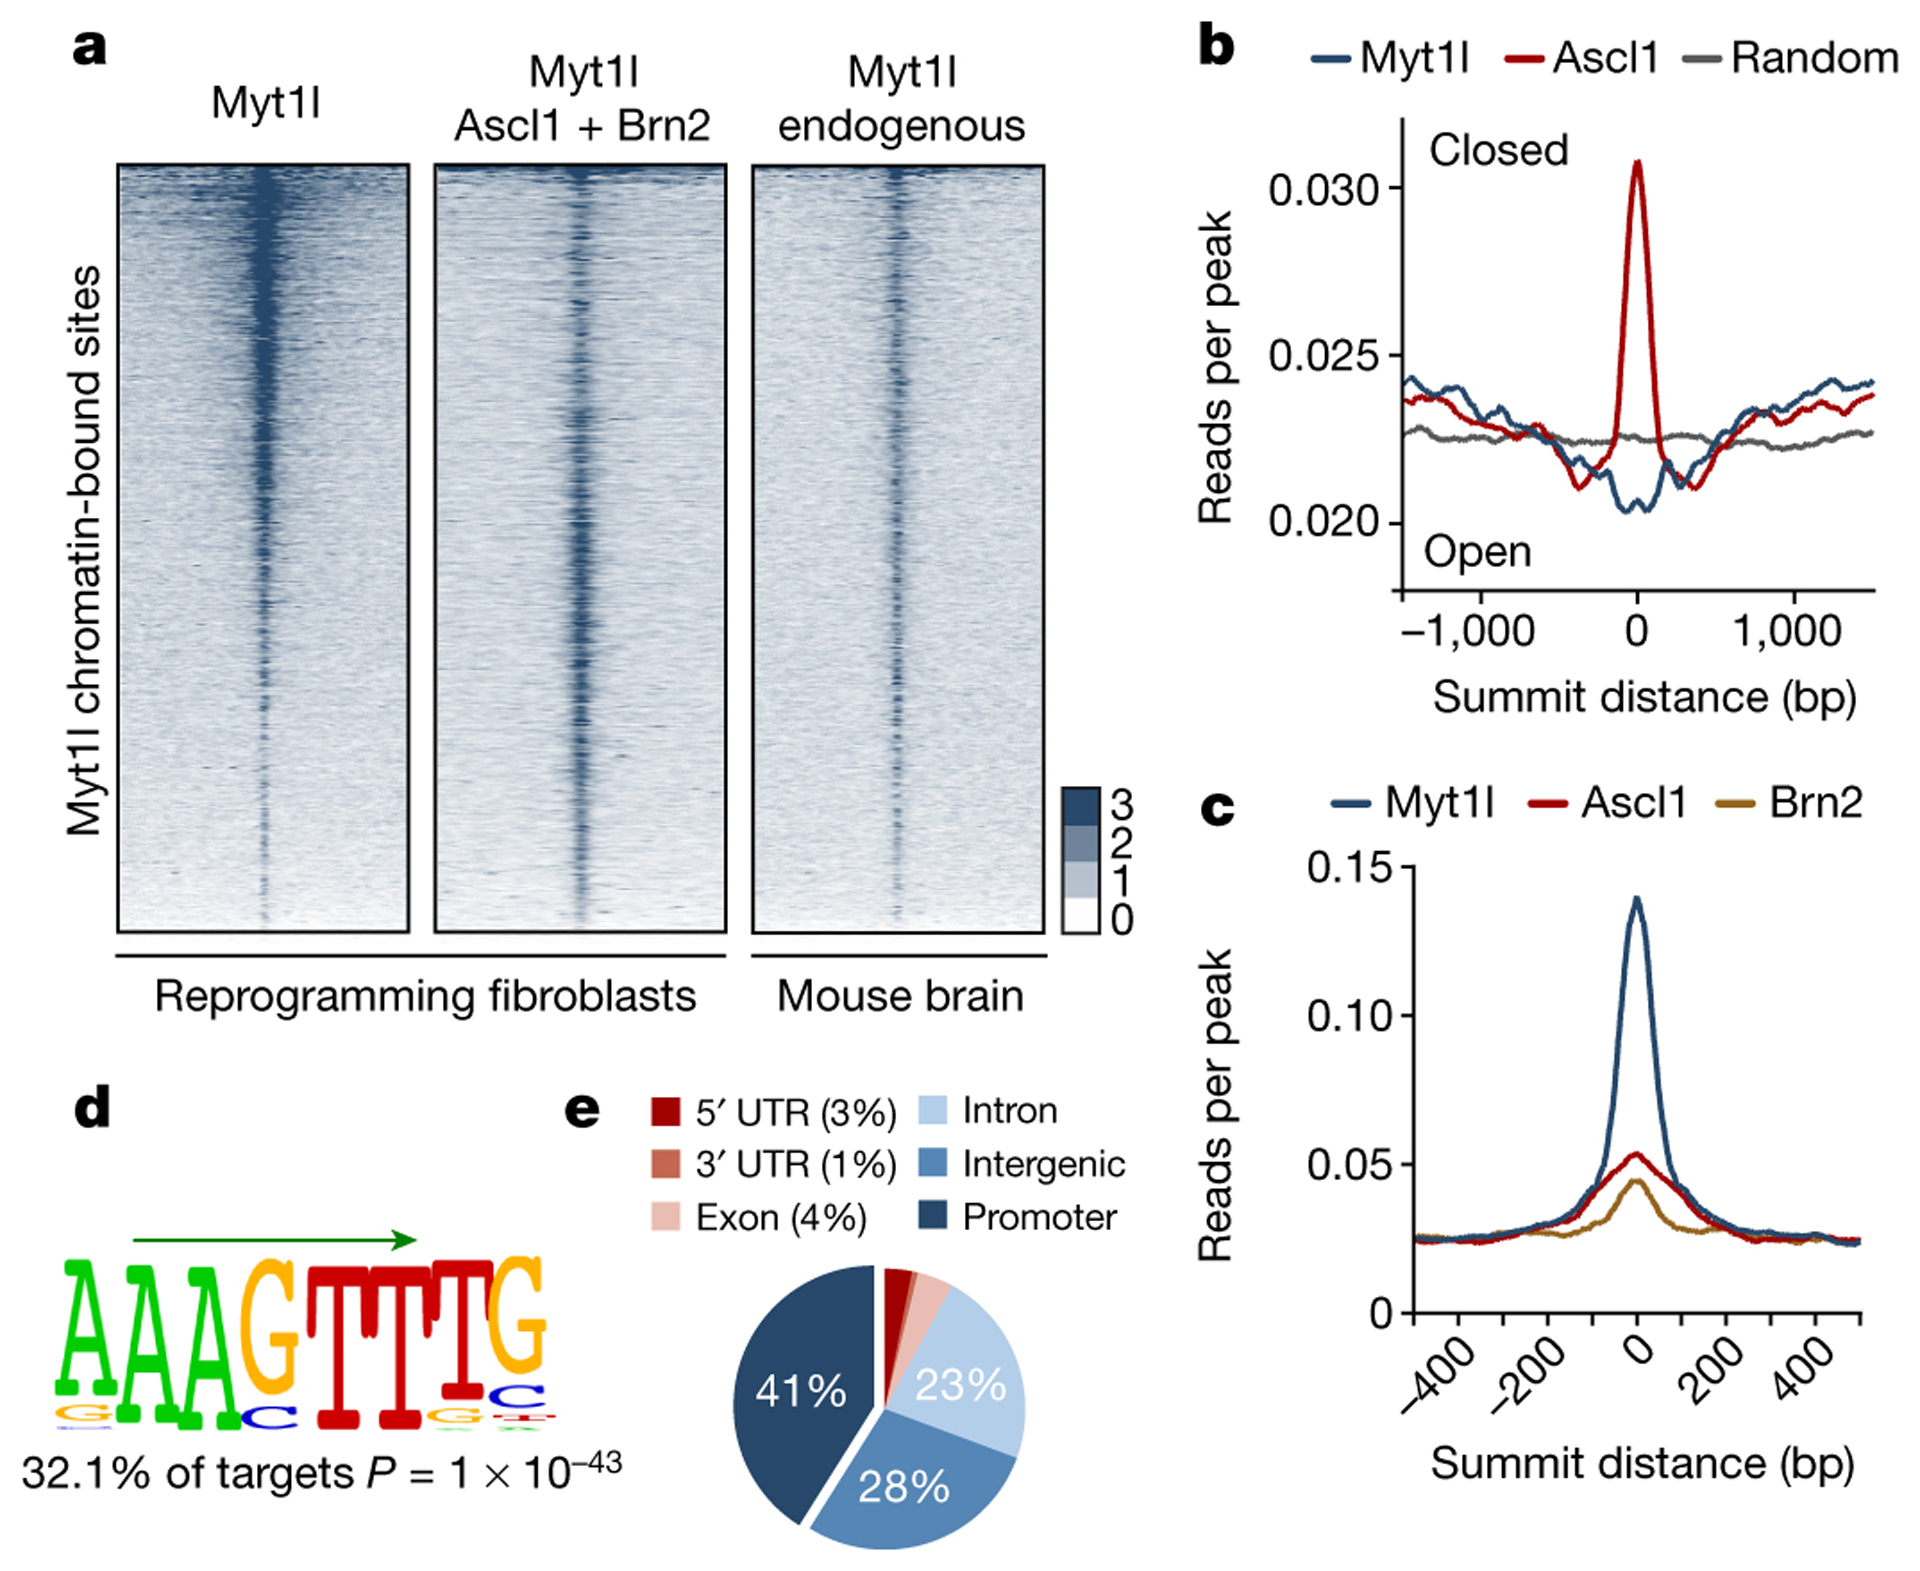
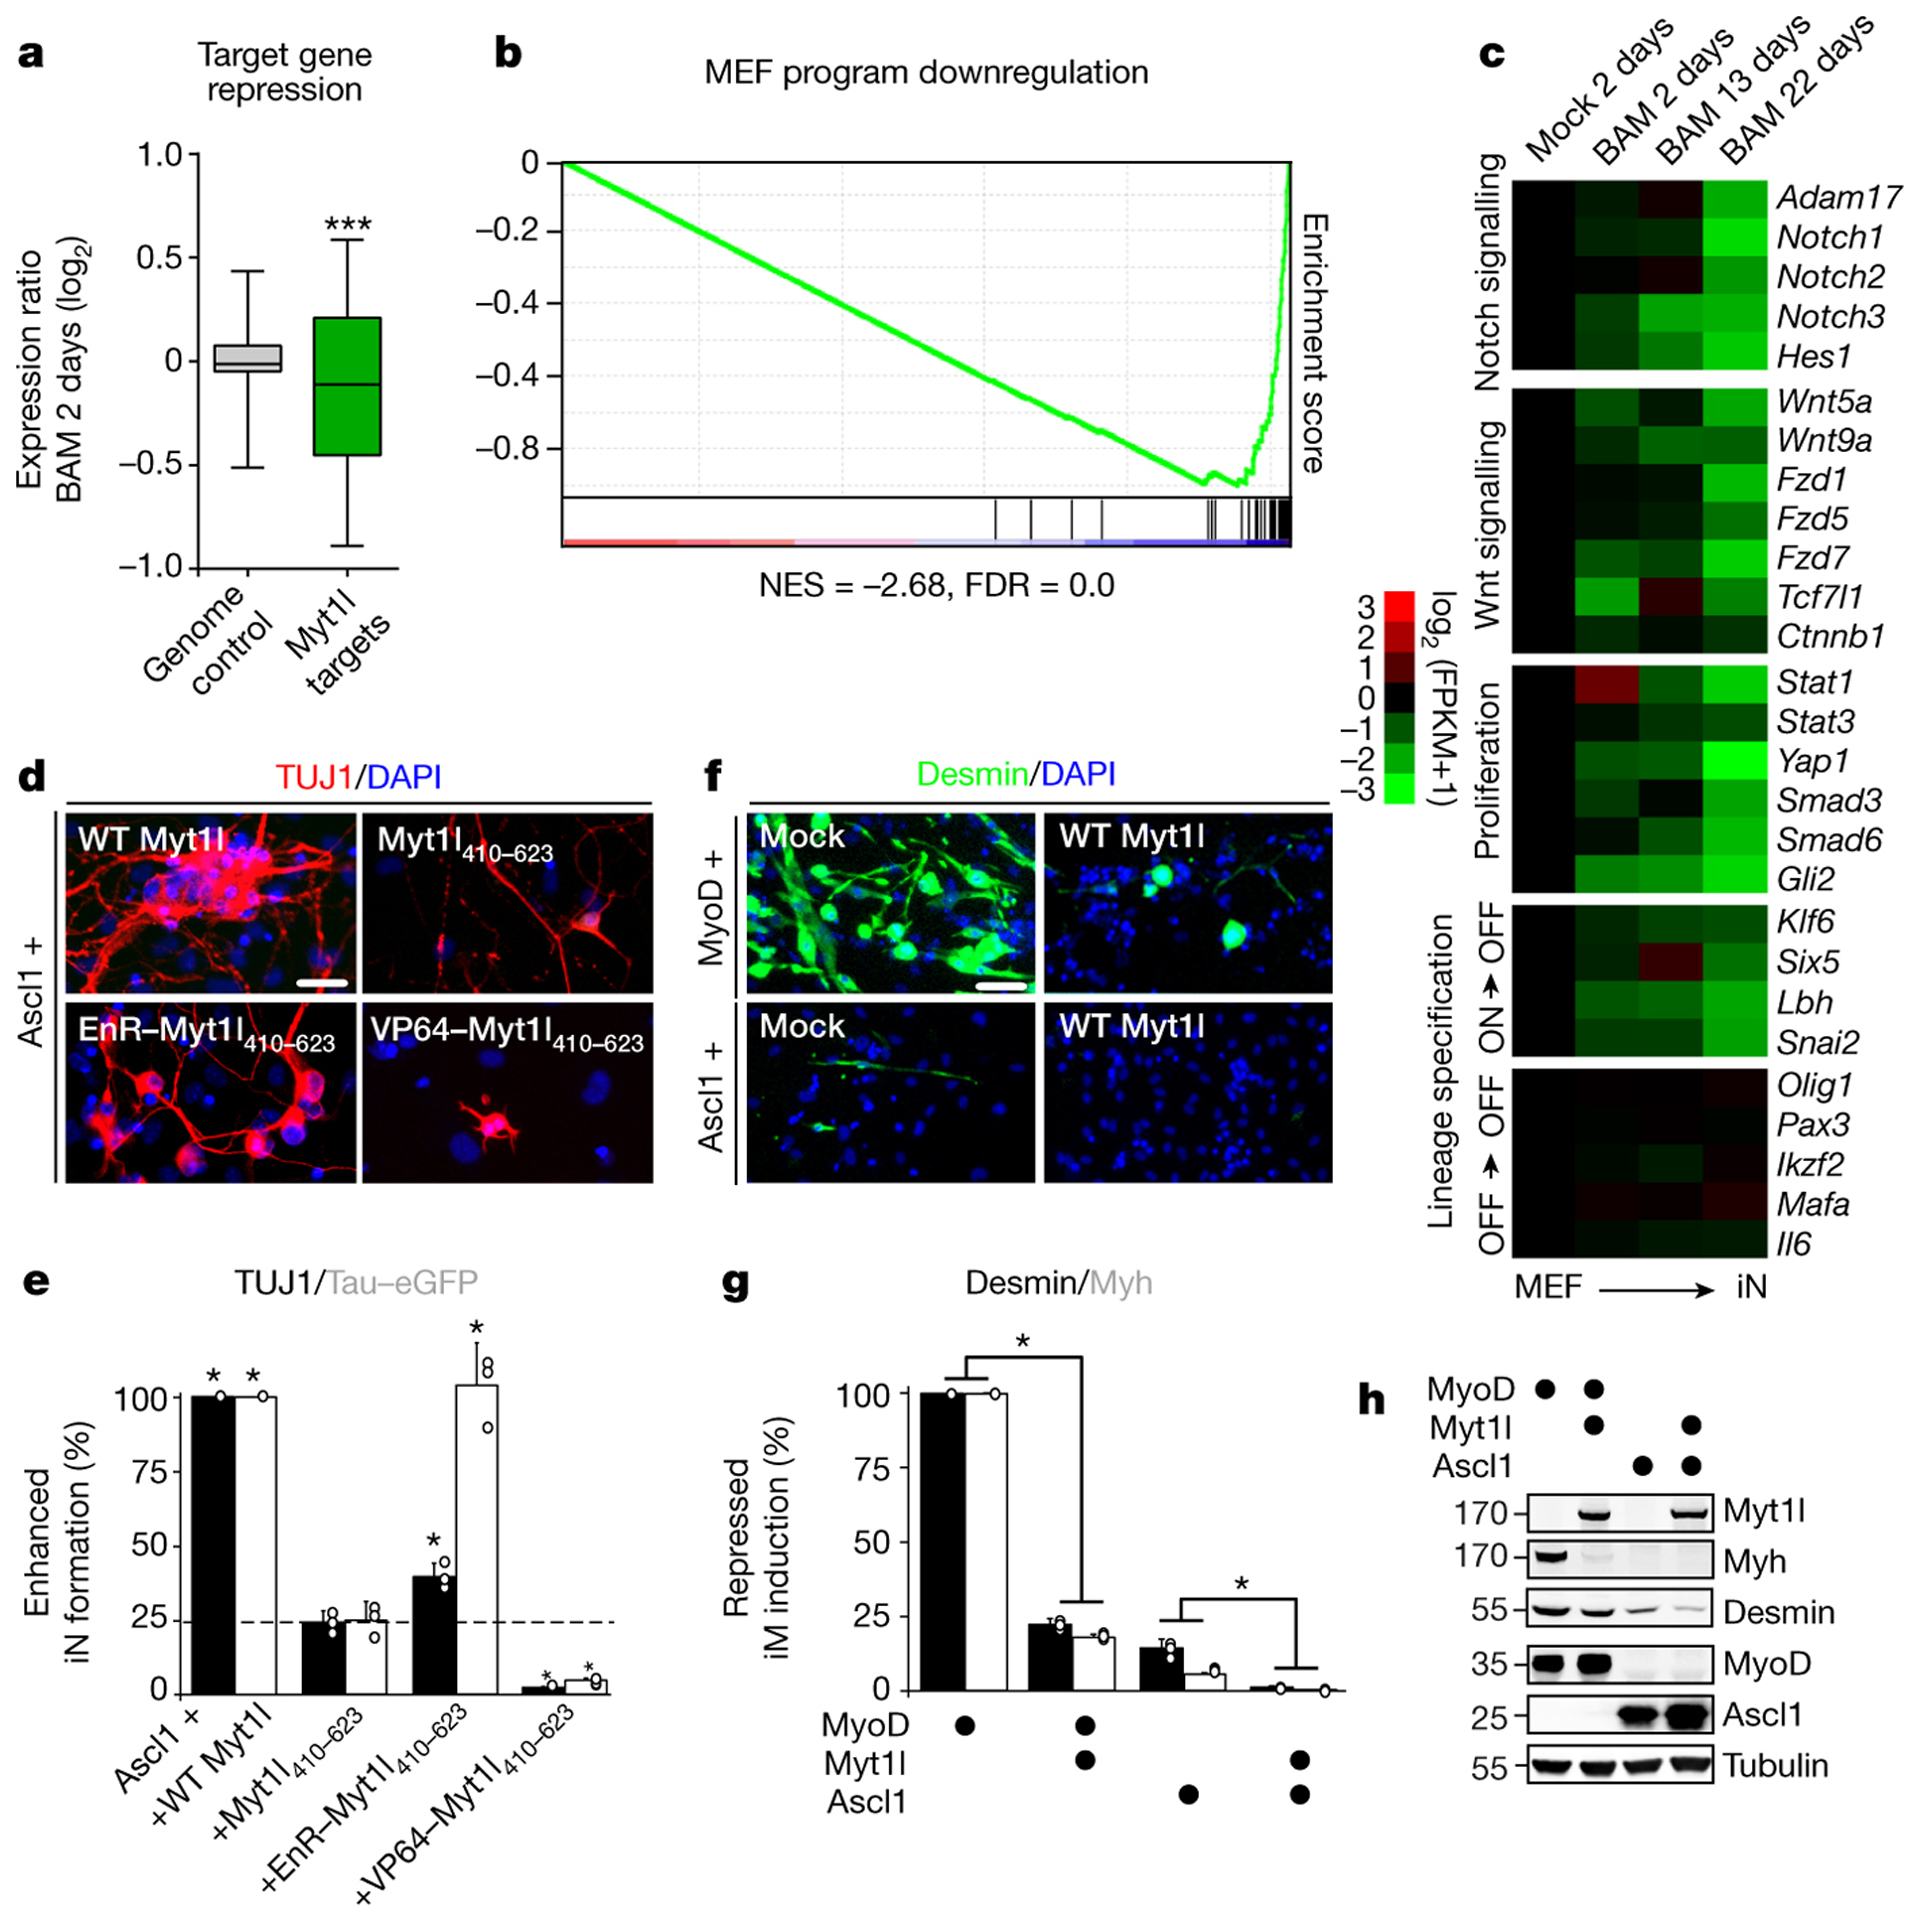
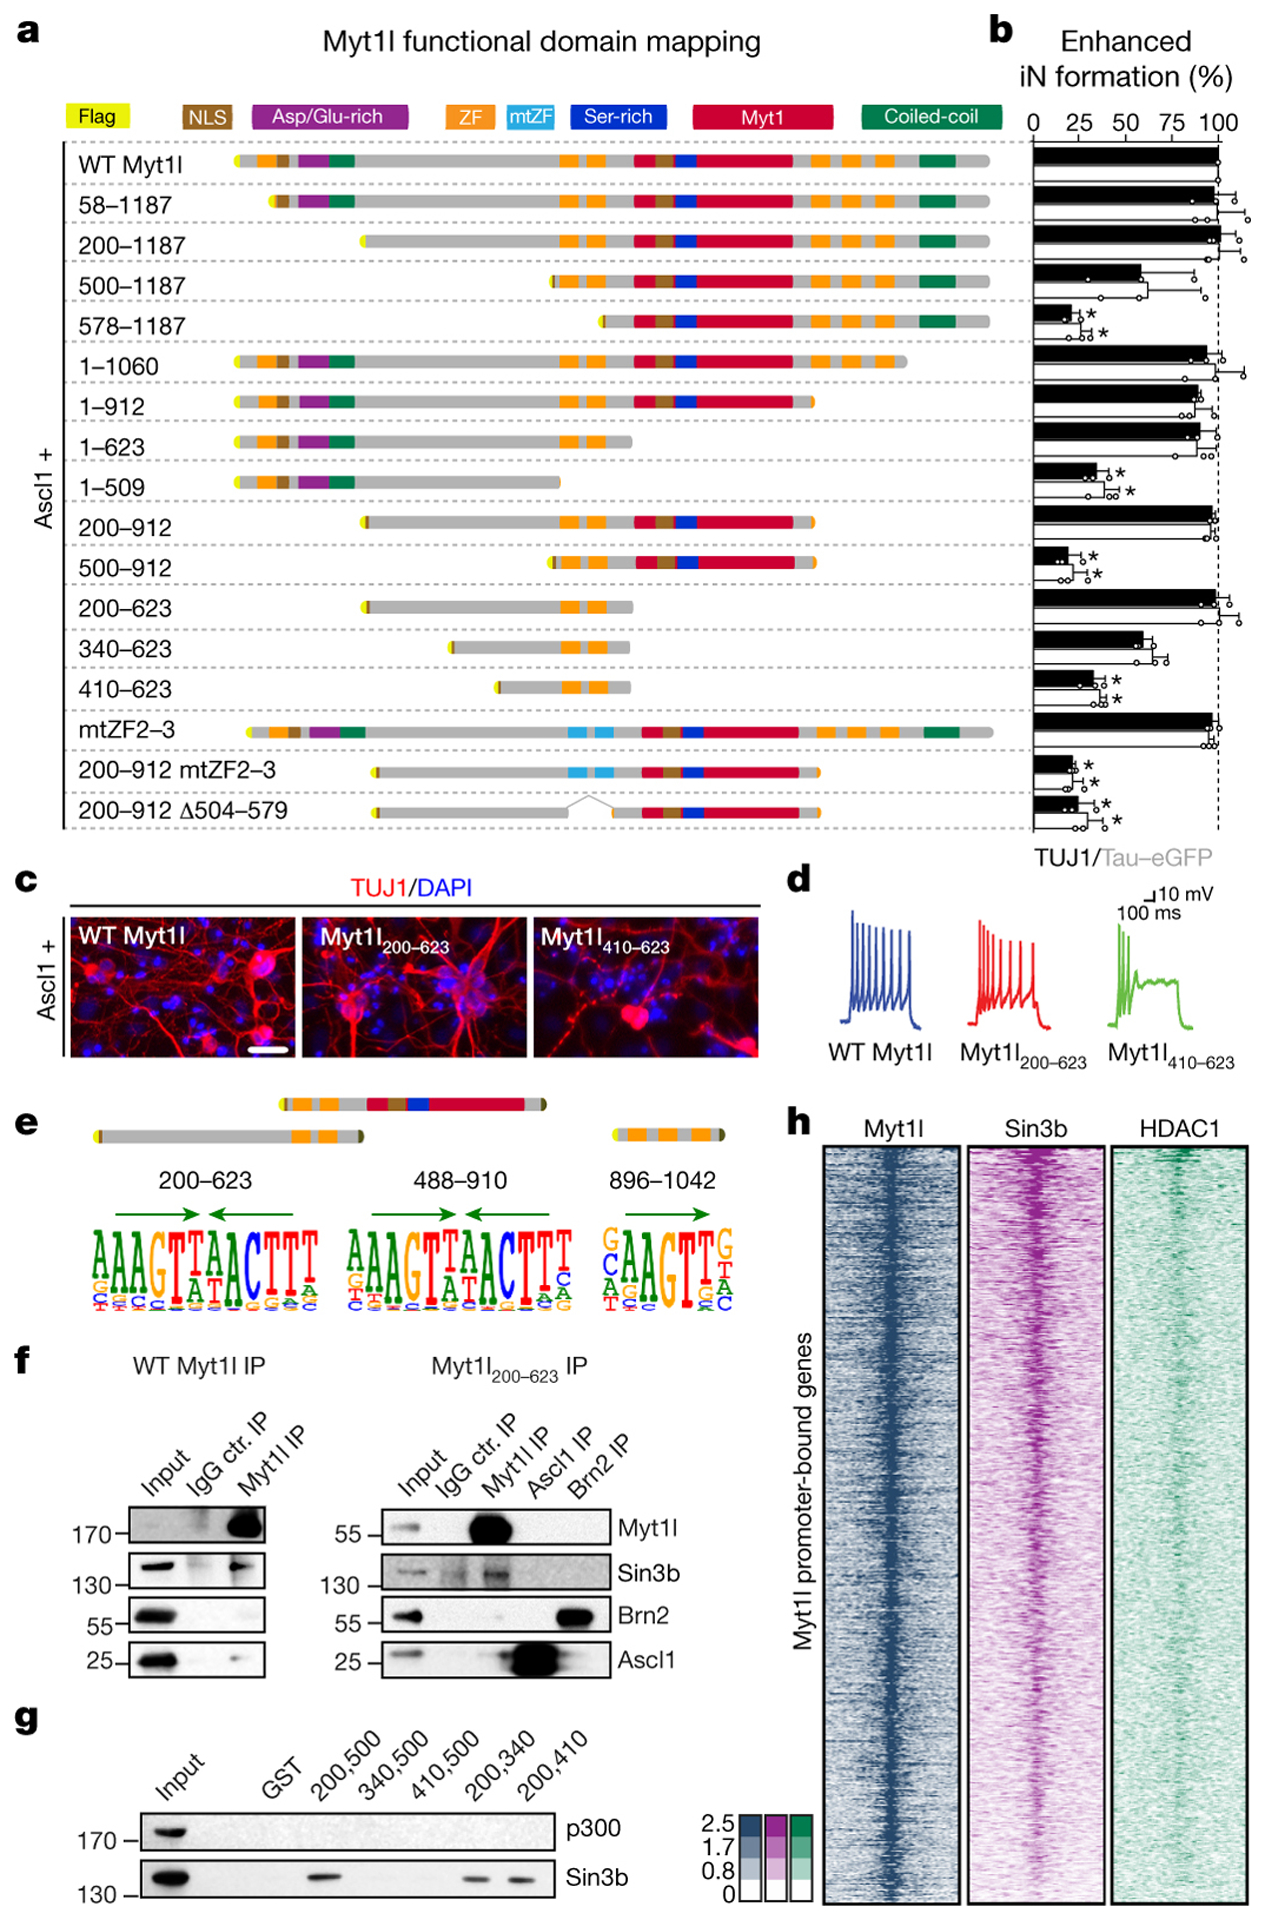
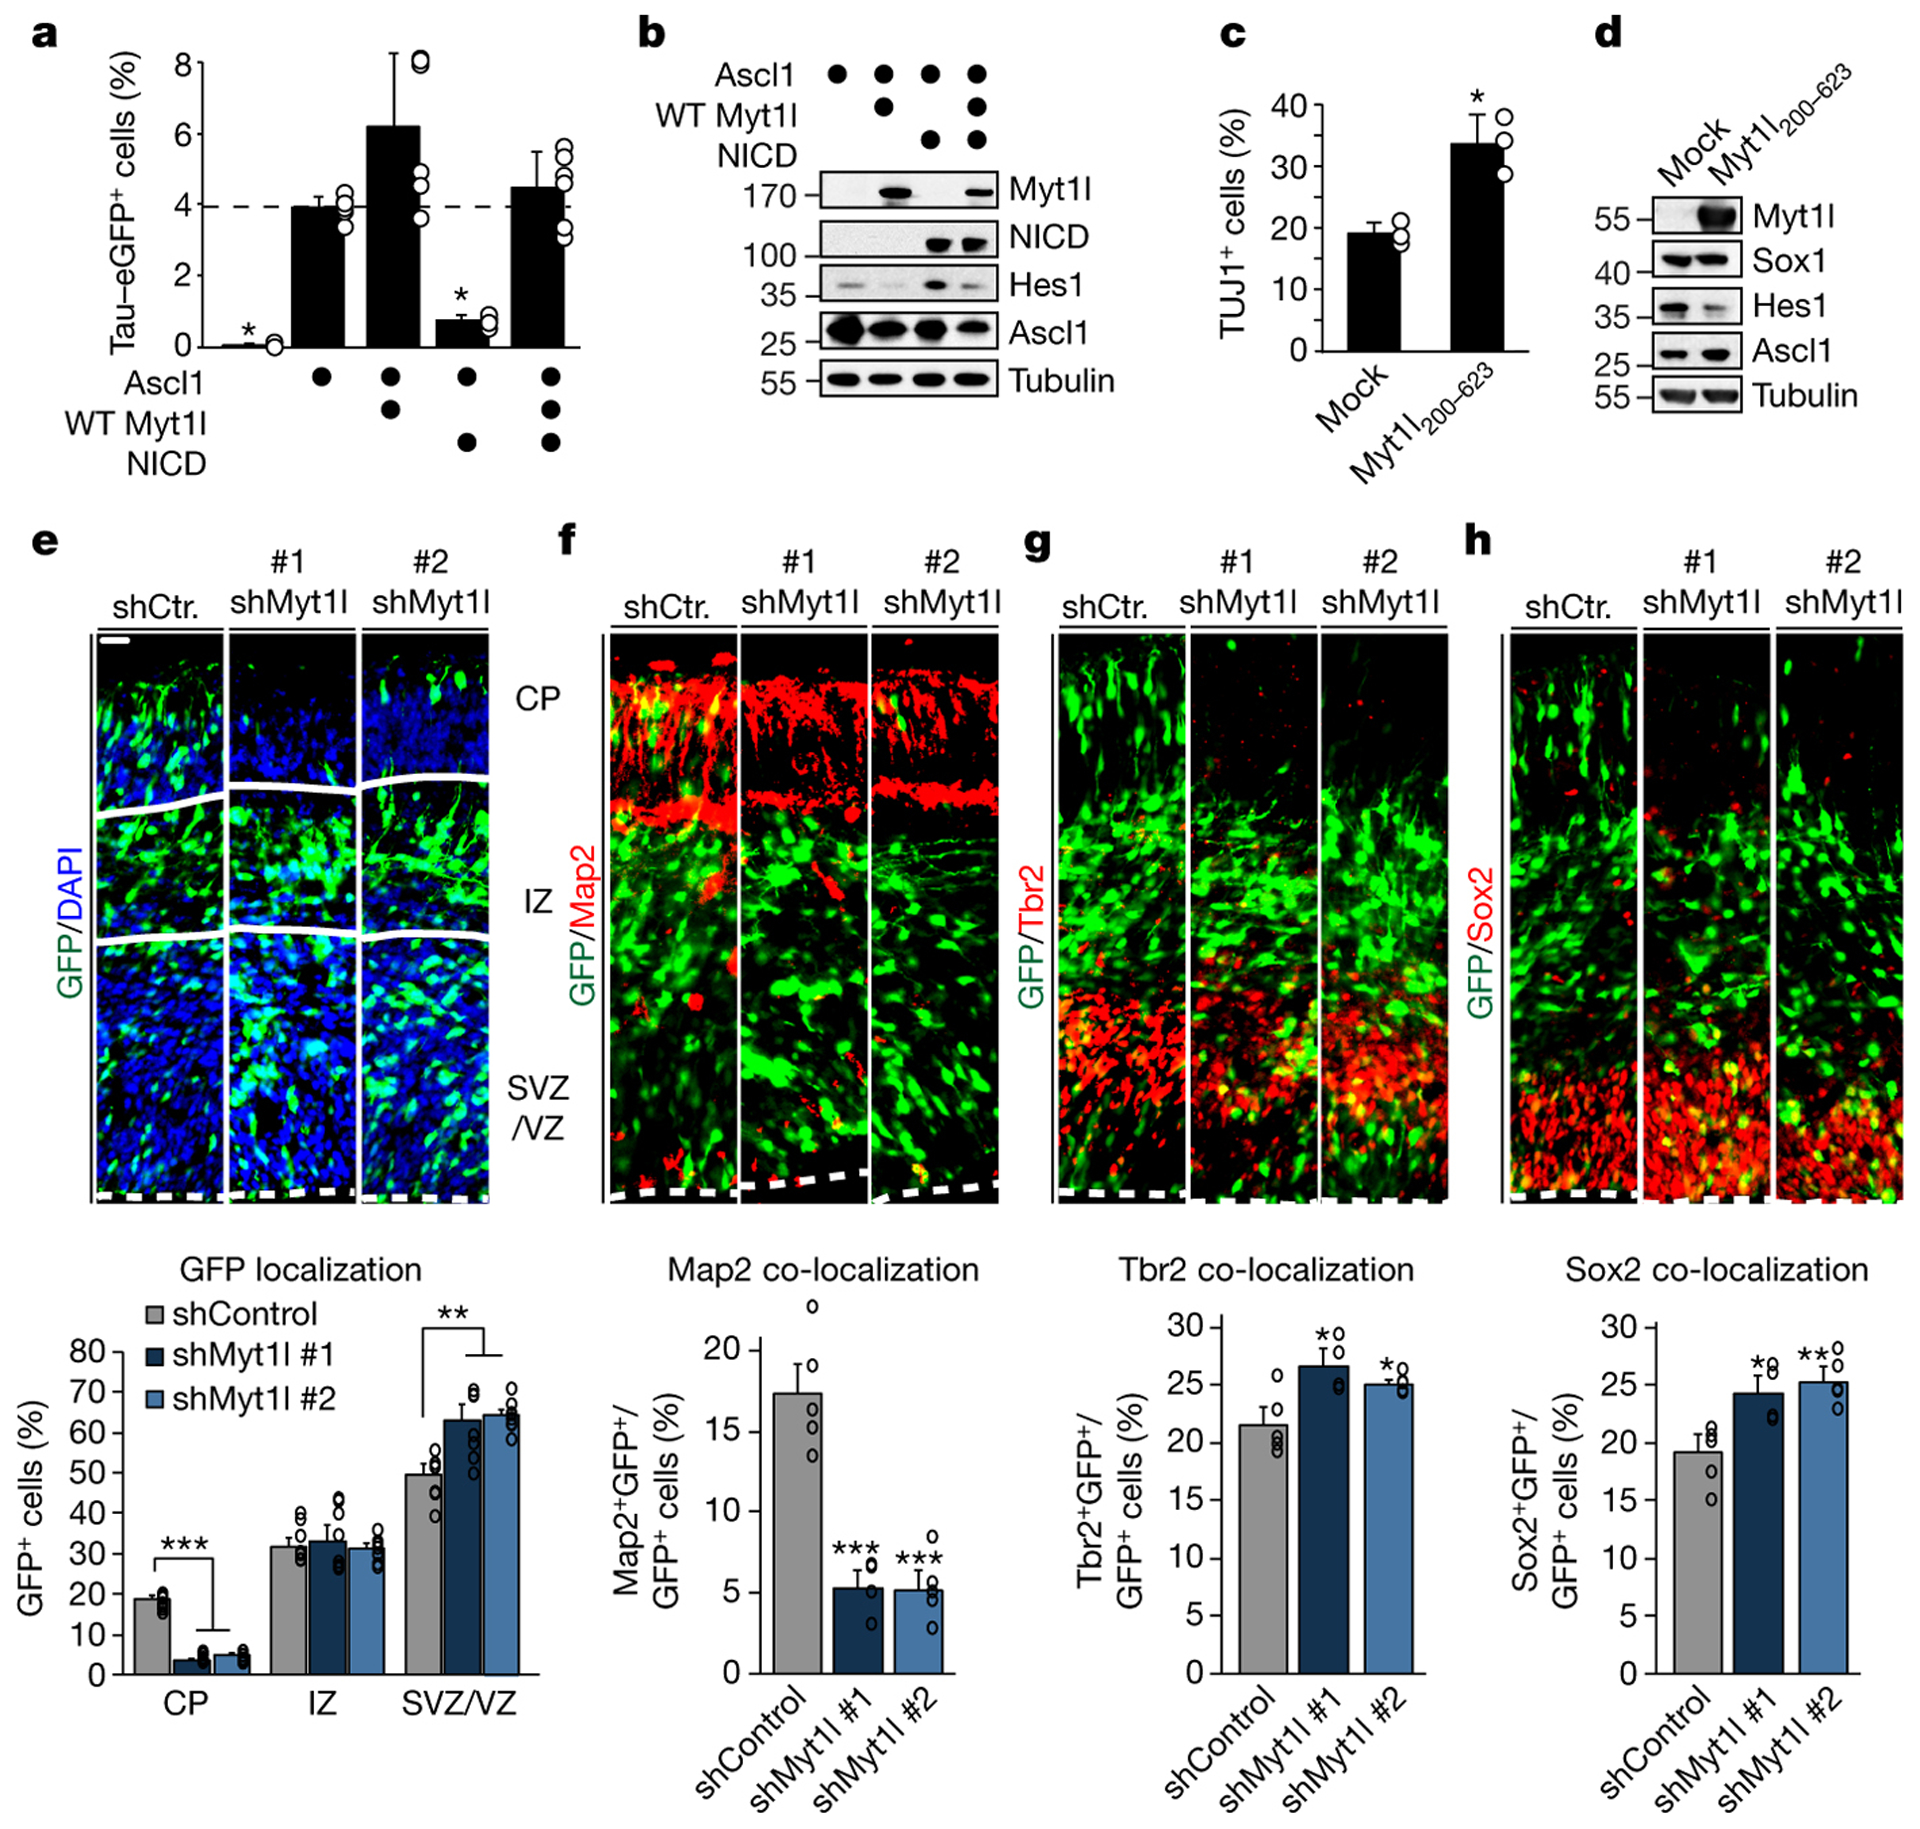
Normal differentiation and induced reprogramming require the activation of target cell programs and silencing of donor cell programs. In reprogramming, the same factors are often used to reprogram many different donor cell types. As most developmental repressors, such as RE1-silencing transcription factor (REST) and Groucho (also known as TLE), are considered lineage-specific repressors, it remains unclear how identical combinations of transcription factors can silence so many different donor programs. Distinct lineage repressors would have to be induced in different donor cell types. Here, by studying the reprogramming of mouse fibroblasts to neurons, we found that the pan neuron-specific transcription factor Myt1-like (Myt1l) exerts its pro-neuronal function by direct repression of many different somatic lineage programs except the neuronal program. The repressive function of Myt1l is mediated via recruitment of a complex containing Sin3b by binding to a previously uncharacterized N-terminal domain. In agreement with its repressive function, the genomic binding sites of Myt1l are similar in neurons and fibroblasts and are preferentially in an open chromatin configuration. The Notch signalling pathway is repressed by Myt1l through silencing of several members, including Hes1. Acute knockdown of Myt1l in the developing mouse brain mimicked a Notch gain-of-function phenotype, suggesting that Myt1l allows newborn neurons to escape Notch activation during normal development. Depletion of Myt1l in primary postmitotic neurons de-repressed non-neuronal programs and impaired neuronal gene expression and function, indicating that many somatic lineage programs are actively and persistently repressed by Myt1l to maintain neuronal identity. It is now tempting to speculate that similar 'many-but-one' lineage repressors exist for other cell fates; such repressors, in combination with lineage-specific activators, would be prime candidates for use in reprogramming additional cell types.


Conflict of interest statement

The authors declare no competing financial interests.

Figures

Fig. ED1:
Fig. ED1:. Myt1l antibody design and characterisation
a, Schematic of mouse MYT1 family members mmMYT1 (Q8CFC2), mmMyt1l (P97500) and mmST18 (A5LFV3) as well as human hsMyt1l homologue (Q9UL68). Highlighted are the nuclear localisation signals (NLS), aspartic acid/ glutamic acid-rich (Asp/Glu-rich), serine-rich (Ser-rich), MYT1. coiled-coil domains and the CCHC-type zinc fingers (ZF). Also shown is the predicted antigenicity and the conservation between the proteins generated using EpiC and T-Coffee, respectively. Based on this a fragment of mmMyt1l 171–420 was used as antigen for antibody induction in rabbits. The sequence identities among the antigen regions and the full-length proteins, as well as the molecular weights are shown (right). b-d, Western blot of; b MEF cells upon induction of FLAG-tagged mmMyt1l, c HEK293 cells upon transfection of FLAG-tagged mmMyt1, mmMyt1l, St18, and untagged hsMyt1l, and d E13.5 embryonic mouse whole brain lysate using preimmune serum, antibodies against Myt1l, FLAG, and Tubulin. e, Microscopy images of HEK293 cells upon transfection of FLAG-tagged mmMyt1l followed by immunofluorescence using antibodies against FLAG (red) and Myt1l (green). f, Microscopy images of a section from adult mouse cortex upon immunofluorescence using antibodies against NeuN (red), Myt1l (green), and DAPI staining (blue). Scale bar 10 μm. g, Myt1l antibody specifically marks mouse brain neurons in vivo. Immunofluorescence microscopy images of adult mouse brain cortex sections using antibodies against neurons; NeuN and MAP2. Oligodendrocytes; OLIG2 and APC. As well as astrocytes (GFAP) and microglia (IBA1) all shown in red together with Myt1l (green) and DAPI staining (blue). Note that Myt1l only overlaps with neuronal markers. Scale bar 20 μm.
Fig. ED2:
Fig. ED2:. Genome-wide chromatin binding of Myt1l
a-b, Chromatin immunoprecipitation (ChIP) of endogenous Myt1l from a E13.5 mouse brain or b of Myt1l wt (left) and 200–623 (right) transgenes from MEF cell lysates 2 days upon induction with or without Ascl1 and Brn2. Chromatin immunoprecipitates were analysed by Western blotting with Myt1l, BRN2, and ASCL1 antibodies. Input = 0.3% of ChIP input, unbound = 0.3% of ChIP flow-through, ChIP = 3% of ChIP eluates. c, ChIP-seq genome-wide occupancy of endogenous Myt1l in E13.5 mouse brains (n = 2) or Myt1l and Myt1l 200–623 in MEFs two days after induction with (n = 3) or without (n = 2) Ascl1 and Brn2. 6911 total peaks are sorted based on intensity and corresponding genomic regions are displayed across all data sets, signal is displayed ± 2 kb from summits. (See also Fig. 1). d, Chromatin reads for Myt1l, ASCL1, and BRN2 at ASCL1 (top), and BRN2 peaks (bottom). e, Chromatin reads of indicated histone marks in uninfected MEFs at the sites at which Myt1l is bound during reprogramming. Signal is displayed ±2 kb from peak summit. f, Pearson correlation and clustering analysis of ChIP-seq samples highlight high binding overlap between different conditions. g, MA plots from DiffBind and corresponding Venn diagrams showing the distribution of Myt1l ChIP-seq peak intensities between indicated conditions; endogenous Myt1l in mouse brain versus overexpressed Myt1l in BAM MEFs (top), Myt1l overexpression alone versus in combination with Ascl1 and Brn2 (BAM) in MEFs (bottom left), and Myt1l wt versus Myt1l 200–623 overexpression in MEFs (bottom right). Significantly different peaks are shown in color and numbers are annotated. Peaks that are significantly changed due to experimental setup are highlighted red.
Fig. ED3:
Fig. ED3:. Myt1l represses many but the neuronal transcriptional network
a, Heatmap of gene expression changes at promoter bound Myt1l target genes during iN cell conversion in MEFs at the indicated time points based on RNA-seq show significant enrichment of Myt1l motifs at repressed genes (p = 6.85×10⁻⁶), n = 2 (left) and inverse transcriptional effects upon Myt1l knock-down in primary hippocampal neurons (right). b, Mean expression levels of selected Myt1l target genes in MEFs upon induction of Myt1l wt together with Ascl1 for two days determined by quantitative real time PCR show significant repression of canonical inhibitors of neurogenesis by Myt1l. Names and annotated functions of tested genes are indicated, expression levels were normalised to Ascl1 only induction and GAPDH expression, n = 4 biological replicates (with 2 technical replicates each), error bars = SE, pair wise fixed reallocation randomisation test * p < 0.00126. c, Myt1l ChIP-seq profile at the Hes1 and Ncam1 promoter shows strong binding of endogenous Myt1l in E13.5 mouse brain and overexpressed Myt1l wt in MEFs two days after reprogramming, red bars mark multiple Myt1l AAGTTT-motifs present in repressed Hes1 promoter and gene body. d, Overlap of Myt1l bound target genes that are induced or repressed during MEF-iN formation upon overexpression of Myt1l with or without Ascl1 and Brn2 and indicated cell type specific expression signatures determined by GeneOverlap27. Odds ratio > 2 represents strong association, p-values are shown in brackets, n.s. = not significant. e, Selected top gene ontology (GO) terms of Myt1l targeted genes that are repressed (top) or induced (bottom) during reprogramming determined by PANTHER28. Enrichment scores and p-values are shown. Highlighted are the terms “negative regulation of neuron differentiation” (green) in the repressed cluster and “generation of neurons” (red) in the induced cluster. Both analyses show a striking enrichment of repressed Myt1l target genes within several non-neuronal programs. Of note several metabolic GO terms are among the upregulated target genes.
Fig. ED4:
Fig. ED4:. Myt1l blocks muscle differentiation in primary myoblasts
a, Representative micrographs of muscle cells derived from primary myoblasts upon differentiation for 4 days with with rtTA alone (mock) or in combination with Myt1l wt followed by immunofluorescence using antibodies against MYH (green), MYT1L (red) and DAPI staining (blue), scale bar 100 μm. b, Muscle differentiation efficiency of cells shown in A highlight the repressive effect of MYT1L expression (+) on MYH-induction compared to MYT1L negative cells (−). n = 3, error bars = SE, t-test * p < 0.005. c, Western blot of muscle cells shown in A using indicated antibodies show reduction of several muscle markers upon MYT1L overexpression.
Fig. ED5:
Fig. ED5:. Truncation screen identifies minimal neurogenic domains of Myt1l
a, Schematic of FLAG and NLS-tagged Myt1l truncation proteins including amino acid positions. Ability to enhance neurogenic conversion together with Ascl1 is indicated by (+), minimal active truncation Myt1l 200–623 is boxed red (see also Fig. 3). Myt1l truncations with partial or without enhanced conversion activity are indicated with (+/−) and (−), respectively. b, Representative micrographs of iN cells derived from MEFs upon reprogramming for 14 days with Ascl1 together with the indicated transgenes followed by immunofluorescence using antibodies against TUJ1 (red) and DAPI staining (blue), scale bar 50 μm. c-g, Electrophysiological characterisation of iN cells derived in B upon maturation for 21 days on mouse glia. c, Representative action potential (APs) traces of iN cells upon reprogramming with Ascl1 together with indicated Myt1l truncation. Pie charts indicate fraction of cells firing single (grey), multiple (white), or no (black) APs. d, Mean number of APs fired plotted with respect to pulse amplitude measured at −60 mV holding potential. e, Mean resting membrane-potential (Vrest). f, Mean membrane resistance (Rm) and g capacitance (Cm) measured at −70 mV holding potential. Dotted line indicates intrinsic properties of Ascl1+GFP, n = 3 biological replicates (total number of individual cells measured indicated), error bars = SE, t-test * p < 0.05. h, Microscopy images showing nuclear localisation of all tested Myt1l truncations two days after induction in MEFs by immunofluorescence using antibodies against FLAG (grey) and DAPI staining (blue), scale bar 10 μm. i, Western blot analysis of HEK293 cells two days after transfection with the indicated transgenes confirms protein integrity using antibodies against FLAG and Tubulin.
Fig. ED6:
Fig. ED6:. Characterization of mouse and human iN cells generated with ASCL1 and Myt1l
a, Microscopy images of iN cells derived from MEFs upon reprogramming for 21 days on mouse glia by overexpression of Ascl1 together with either Myt1l wt or Myt1l 200–623 followed by immunofluorescence using antibodies against MAP2 (red) and Synapsin (green) or NeuN (red) and TauEGFP (green), scale bar 10 μm. b, Synaptic recordings of TauEGFP-positive mouse iN cells shown in A. c-d, Spontaneous and evoked excitatory postsynaptic currents (EPSCs) were recorded at a holding potential of −70 mV (blue) and blocked by the addition of CNQX (red), indicating that the excitatory nature of the resulting induced neurons is mediated through AMPA-type receptors (AMPAR). e, Immunofluorescence images of iN cells derived from human embryonic fibroblasts upon reprogramming for 6 weeks by overexpression of GFP, Ascl1, Ngn2, Brn2 together with either Myt1l wt or Myt1l 200–623 and co-culture with primary cortical mouse neurons using antibodies against Synapsin (red) and GFP (green), scale bar 10 μm. f, Synaptic recordings of GFP-positive human iN cells shown in E. g-h, Spontaneous and evoked excitatory postsynaptic currents (EPSCs) were recorded at a holding potential of −70 mV, indicating synaptic competence of the resulting induced human neurons. n = 4 cells (fraction of active cells indicated).
Fig. ED7:
Fig. ED7:. Zinc fingers are essential or neurogenic function of Myt1l
a, Schematic of Myt1l zinc finger 2–3 point and deletion mutants and their ability to enhance neurogenic conversion together with Ascl1 is indicated by (+), non-functional mutants are indicated with (−)(see also Fig. 3). b, Sequence alignments and conservation of CCHC-type zinc fingers from Myt1l; cysteine and histidine residues that can coordinate Zn(II) are highlighted in purple, non-coordinating mutated histidines are shown in green. c, Representative immunofluorescence of iN cells derived from MEFs upon reprogramming for 14 days with Ascl1 and the indicated transgenes; TUJ1 (red), DAPI staining (blue), scale bar 50 μm. d-h, Electrophysiological characterisation of iN cells derived in C upon maturation for 21 days on mouse glia. d, Representative action potential (AP) traces of iN cells generated with indicated transgenes, pie charts indicate fraction of cells firing single (grey), multiple (white), or no (black) APs. e, Mean number of APs fired plotted with respect to pulse amplitude measured at −60 mV holding potential. f, Mean resting membrane-potential (Vrest). g, Mean membrane resistance (Rm) and h capacitance (Cm) measured at −70 mV holding potential. Dotted line indicates intrinsic properties of Ascl1+Myt1l wt or Ascl1+Myt1l 200–912, n = 3 biological replicates (total number of individual cells measured indicated), error bars = SE, t-test * p < 0.05.
Fig. ED8:
Fig. ED8:. SIN3b binds Myt1l via N-terminal SID domains and is essential for reprogramming
a, Schematic of FLAG and NLS-tagged Myt1l truncations and glutathione S-transferase (GST)-tagged Myt1l fusion proteins, highlighted are putative SIN3 interactions domains (SID)(See also Fig. 3). Ability to biochemically interact with SIN3b is indicated by (+) and (−), respectively. b, GST bait loading after pull down was controlled by Ponceau staining of the Western blot membrane. Input = 0.2% of pull down (PD) input, PD lanes = 20% of PD eluates. c, ChIP-seq tracks of SIN3b, HDAC1, and Myt1l shows binding at the Hes1 promoter two days after MEF reprogramming with Ascl1, Brn2, and Myt1l wt. Vertical bars mark Myt1l AAGTT-motifs. d, Multiple sequence alignments of the highly conserved putative SIN3 interaction domains (SID) within minimal functional region of Myt1l from selected eukaryotic species. The alignment was generated using T-Coffee and putative SID regions are shown above the alignment. e, Western blot of iN cells derived from MEFs upon reprogramming for 2 days with Ascl1, Myt1l wt together with either control or Sin3b-targeting shRNA constructs using indicated antibodies. f, Representative micrographs of iN cells derived in D upon reprogramming for 14 days followed by immunofluorescence using antibodies against TUJ1 (red) and DAPI staining (blue), scale bar 50 μm. g, Conversion efficiency of cells shown in D based on TUJ1-positive cells with neuronal morphology highlight the deleterious effect of Sin3b knock-down on iN formation. n = 3, error bars = SE, t-test * p < 0.005.
Fig. ED9:
Fig. ED9:. Myt1l acts upstream of HES1 to repress Notch signaling and stabilise ASCL1
a, Immunofluorescence of iN cells quantified in Fig. 4a derived from MEFs upon reprogramming for 7 days with Ascl1 and either Myt1l wt, notch intracellular domain (+ NICD) or a combination; TUJ1 (red), tauEGFP (green), DAPI staining (blue), scale bar 50 μm. b, Neurogenic conversion efficiency of MEFs cells upon reprogramming for 7 days with Ascl1 together with either Myt1l wt (n = 6), Hes 1 (+ Hes1) (n = 3) or a combination of indicated transgenes or upon treatment with DAPT (10 μM) (n = 3) based on TauEGFP induction determined by flow cytometry. Dotted line indicates mean conversion efficiency of Ascl1+Myt1l, error bars = SD, t-test * p < 0.05. c, Western blot analysis of cells shown in A-B after two days of reprogramming and mouse neural stem cells (NSCs) using indicated antibodies shows no striking induction of the neural stem cell markers NESTIN, PAX6 (arrowhead) or SOX1 in any condition but strong reduction of ASCL1 upon Hes1 overexpression. d, Mean expression levels of endogenous and exogenous (overexpressed) Ascl1 transcript in MEFs upon overexpression of Ascl1 and Hes1 with or without Myt1l wt for two days determined by quantitative real time PCR show significant repression of both endogenous and exogenous Ascl1 by Hes1 overexpression independent of Myt1l. Expression levels were normalised to Ascl1 only induction and GAPDH expression, n = 4 biological replicates (with 4 technical replicates each), error bars = SE, pair wise fixed reallocation randomisation test * p < 0.00126. e, Western blot analysis of MEF cells upon induction of Ascl1 together with either GFP, Myt1l wt, or Myt1l 200–623 after 0, 2, 5, and 7 days upon reprogramming using antibodies against MYT1L, ASCL1, GFP, and Tubulin shows no striking induction of full length Myt1l upon overexpression of minimal fragment but stabilisation of ASCL1 levels. f, Immunofluorescence of neurons quantified in Fig. 4c derived from mouse neural stem cells (NSCs) upon differentiation for 7 days with rtTA alone (mock) or in combination with Myt1l 200–623; TUJ1 (red), Myt1l (green), DAPI staining (blue), scale bar 50 μm. Of note, all neurons formed in the control condition expressed endogenous Myt1l.
Fig. ED10:
Fig. ED10:. Myt1l maintains neuronal identity by repression of non-neuronal programs
a, Myt1l knock-down in P0 mouse primary hippocampal neuronal cultures impairs neuronal maturation and maintenance. Cells were infected with shRNA-expressing lentivirus on third day of in vitro culture and analysed 11 days later by quantitative Western blot using indicated antibodies. While Tubulin served as loading control several neuronal markers are severely down-regulated by Myt1l depletion. Representative Western blot images are shown, n = 5, error bars = SEM, t-test * p < 0.05. b-f, Electrophysiological characterisation of Myt1l knock-down neurons derived in A. b, Representative action potential (AP) traces of hippocampal neurons upon indicated knock-down, pie charts indicate fraction of cells firing single (grey), multiple (white), or no (black) APs at the 90 pA pulse. c , Mean number of APs fired plotted with respect to pulse amplitude measured at −60 mV holding potential. d, Mean resting membrane-potential (Vrest). e, Mean membrane resistance (Rm) and f capacitance (Cm) measured at −70 mV holding potential. Dotted line indicates intrinsic properties upon shControl treatment, n = 5 biological replicates (total number of individual cells measured indicated), error bars = SE, t-test * p < 0.05. g, Myt1l knock-down in P0 mouse primary hippocampal neuronal cultures induces non-neuronal gene expression programs. Overlap of Myt1l bound target genes that are induced or repressed upon knock down of Myt1l in primary hippocampal neurons and indicated cell type specific expression signatures determined by GeneOverlap27. Odds ratio > 2 represents strong association, p-values are shown, n.s. = not significant. h, Relative number of Myt1l and REST DNA binding motifs at cell type specific genes highlight depletion of Myt1l and enrichment of REST motifs at neuronal genes, respectively (t-test * p < 0.005). i, RNA-seq analysis of genes shown in A, confirm decreased expression of neuronal genes upon Myt1l depletion. In addition several Notch and Wnt signaling factors that are direct targets of Myt1l are de-repressed (see also Fig. 2c). In addition transcription of several non-neuronal lineage specifiers is induced compared to the control. Shown are gene expression values of cells treated as in A based on RNA-seq, fold change is represented in logarithmic scale normalised to the shControl sample, n = 2. j, Selected top gene ontology (GO) terms of Myt1l targeted genes that are repressed (top) or induced (bottom) upon knock-down in primary hippocampal neurons determined by PANTHER28. Enrichment scores and p-values are shown. Highlighted are the terms “generation of neurons” (green) in the repressed cluster and “negative regulation of neurogenesis” (red) and in the induced cluster. In addition this analysis highlights induction of several non-neuronal gene expression programs upon Myt1l depletion.
Fig. 1:
Fig. 1:. Context independent on target chromatin access of Myt1l
a, Genome-wide occupancy profiles of endogenous Myt1l in E13.5 mouse brains (n = 2) or overexpressed Myt1l with (n = 3) or without (n = 2) Ascl1 and Brn2 in MEFs two days after reprogramming. Corresponding regions are displayed across all data sets ± 2 kb from summits. b, Chromatin accessibility based on MNase-seq signal in MEFs shows binding enrichment of Myt1l in open and ASCL1 in closed regions. c, Read densities of ASCL1 and BRN2 chromatin binding shows minor overlap at Myt1l bound regions. d, The Myt1l AAGTT-core motif (green arrow) is significantly enriched at bound sites across data sets. P-value reported, E-value is 9.6e-3. e, Pie chart indicates enrichment of high confidence Myt1l bound sites at gene promoters.
Fig. 2:
Fig. 2:. Myt1l target gene repression dominates induced neurogenesis
a, Repression of promoter bound (TSS −5,+2kb) Myt1l targets (n = 1798) dominates genome wide expression changes (n = 33459) upon two days of reprogramming (p = 2.78×10⁻¹²), two biological replicates each. b, GSEA identified MEF signature among repressed Myt1l targets. Normalised enrichment score (NES) and false discovery rate (FDR). c, RNA-seq expression values of selected Myt1l targets at indicated time points during reprogramming, normalised to the mock sample, n = 2. Myt1l represses several Notch, Wnt, and proliferation factors. Many lineage specifiers are bound and repressed (ON->OFF) or remain repressed (OFF->OFF). d, Immunofluorescence of iN cells derived from MEFs upon reprogramming for 14 days with Ascl1 and Myt1l wt or a non-functional zinc finger fragment fused to a repressor (EnR) and activator (VP64); TUJ1 (red), DAPI staining (blue). e, Conversion efficiency of cells shown in D based on TUJ1-positive cells with neuronal morphology (black) or TauEGFP expression (grey) show partial reprogramming using repressor fusion, with many TauEGFP-positive cells without neuronal morphologies. f, Immunofluorescence of MEFs upon reprogramming for 14 days with Ascl1 or MyoD without (mock) or with Myt1l wt; DESMIN (green), DAPI staining (blue). g, Induced muscle (iM) conversion efficiency of cells shown in F based on either DESMIN (black) or MYH expression (grey) show decreased muscle marker-positive cells upon Myt1l wt addition. h, Western blot analysis of cells shown in F after two days of reprogramming using indicated antibodies (gel source data Fig. S1). d-g, Scale bar 50 μm, n = 3, error bars = SD, t-test * p < 0.05.
Fig. 3:
Fig. 3:. Characterisation of neurogenic and repressive Myt1l domains
a, Truncation and mutation screen identifies Myt1l domains essential for induced neurogenesis from MEFs upon reprogramming for 14 days with Ascl1. Highlighted are nuclear localisation signals (NLS), aspartic acid/glutamic acid-rich (Asp/Glu-rich), serine-rich (Ser-rich), MYT1, coiled-coil domains, CCHC-type zinc fingers (ZF) and mutants (mtZF). b, Conversion activity compared to Myt1l wt based on number of TUJ1-positive cells with neuronal morphology (black) or TauEGFP expression (grey). n = 3, error bars = SD, t-test * p < 0.005. c, Representative immunofluorescence of iN cells in A; TUJ1 (red), DAPI staining (blue), scale bar 50 μm. d, Representative action potential (AP) traces of iN cells in A upon maturation for 21 days on mouse glia. e, SELEX DNA binding experiments of Myt1l ZF fragments enrich same Myt1l AAGTT-core motif (green arrows). f, Immunoprecipitation show binding of SIN3b to full length and minimal Myt1l in DNase-treated MEF cell lysates two days after transgene overexpression. g, GST pull down from MEF cell lysates identify minimal SIN3b interaction region within functional Myt1l domain. h, Overlapping ChIP-seq chromatin occupancy profiles of overexpressed Myt1l (left, blue), endogenous SIN3b (middle, violet) and HDAC1 (right, green) at Myt1l promoter target sites in MEFs two days after reprogramming induction. n = 2.
Fig. 4:
Fig. 4:. Myt1l represses Notch/Hes1 activity to promote neurogenesis
a, Fraction of TauEGFP-positive iN cells derived from MEFs upon reprogramming for 7 days with Ascl1 and either Myt1l wt, notch intracellular domain (+ NICD) or a combination determined by flow cytometry, n = 6, error bars = SD, t-test * p < 0.05. b, Western blot analysis of cells shown in A using indicated antibodies. c, Neuronal differentiation efficiency of mouse neural stem cells (NSCs) upon overexpression of rtTA (mock) or rtTA and Myt1l 200–623 for 7 days based on TUJ1-positive cells with neuronal morphology. n = 3, error bars = SD, t-test * p < 0.05. d, Western blot analysis of proliferating NSCs 7 days upon induction of rtTA (mock) alone or with Myt1l 200–623 using indicated antibodies. e, Myt1l knock-down cells exhibit cell positioning defects in utero. Control or Myt1l-shRNA constructs co-expressing GFP were electroporated into E13.5 embryonic mouse brains, and the mice were analysed at E15.5. The percentage of GFP-positive cells in each region is shown. CP, cortical plate; IZ, intermediate zone; VZ/SVZ, ventricular zone/subventricular zone (n = 8). f-h, Myt1l knock-down leads to in vivo neurogenesis defects. Cortices electroporated in A were examined at E15.5 by staining with antibodies against MAP2, TBR2, or SOX2 and the percentage of the GFP-positive cells that were also positive for the corresponding markers are shown. (source data Fig. 4, n = 5 for shControl and shMyt1l #2, n = 4 for shMyt1l #1). Scale bar 25 μm, error bars = SEM, t-test * p < 0.05, ** p < 0.005, *** p < 0.0005.

Comment in

References

    1. Schäfer BW, Blakely BT, Darlington GJ & Blau HM Effect of cell history on response to helix-loop-helix family of myogenic regulators. Nature 344, 454–458 (1990). - PubMed
    1. Terranova R, Pereira CF, Roure, Du, C., Merkenschlager, M. & Fisher, A. G. Acquisition and extinction of gene expression programs are separable events in heterokaryon reprogramming. J Cell Sci 119, 2065–2072 (2006). - PubMed
    1. Xu J, Du Y & Deng H Direct lineage reprogramming: strategies, mechanisms, and applications. Cell Stem Cell 16, 119–134 (2015). - PubMed
    1. Santisteban P, Recacha P, Metzger DE & Zaret KS Dynamic expression of groucho-related genes Grg1and Grg3in foregut endoderm and antagonism of differentiation. Dev Dyn 239, 980–986 (2010). - PMC - PubMed
    1. Schoenherr CJ & Anderson DJ The neuron-restrictive silencer factor (NRSF): a coordinate repressor of multiple neuron-specific genes. Science 267, 1360–1363 (1995). - PubMed

Publication types

MeSH terms