. 2017 Apr 5;12(4):e0172786.
doi: 10.1371/journal.pone.0172786. eCollection 2017.

IL-15 regulates migration, invasion, angiogenesis and genes associated with lipid metabolism and inflammation in prostate cancer

Affiliations

IL-15 regulates migration, invasion, angiogenesis and genes associated with lipid metabolism and inflammation in prostate cancer

Krizia Rohena-Rivera et al. PLoS One. .

Abstract

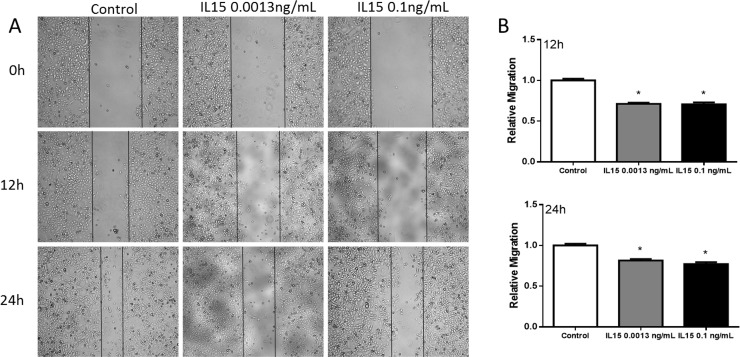
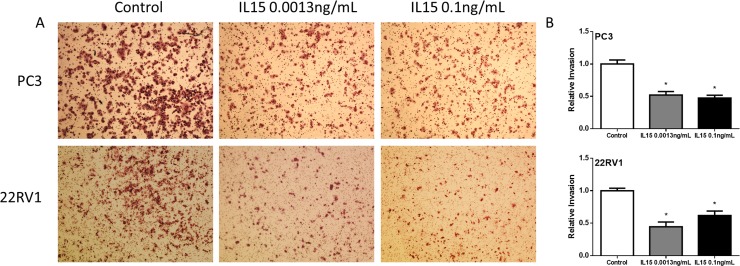
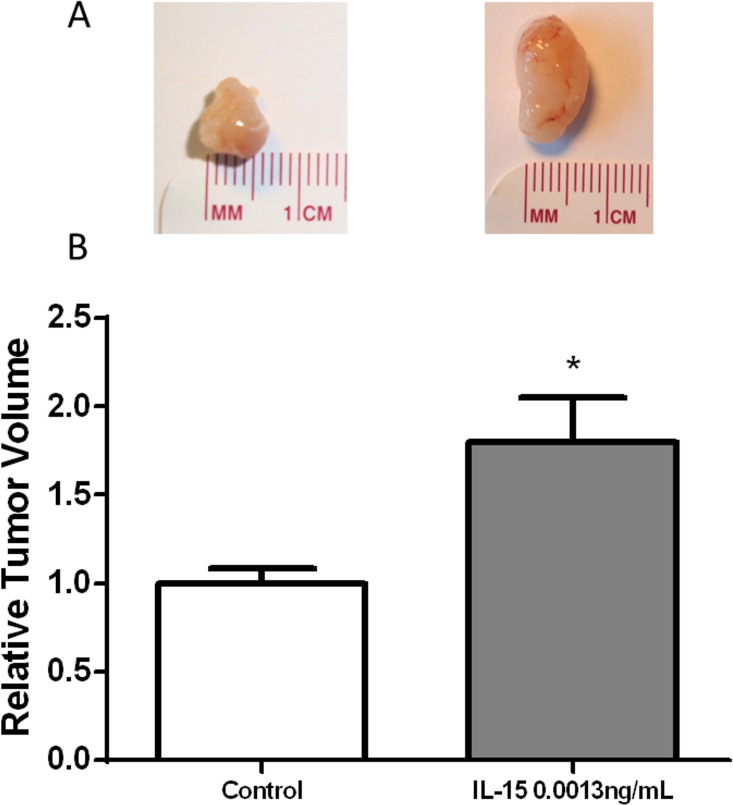
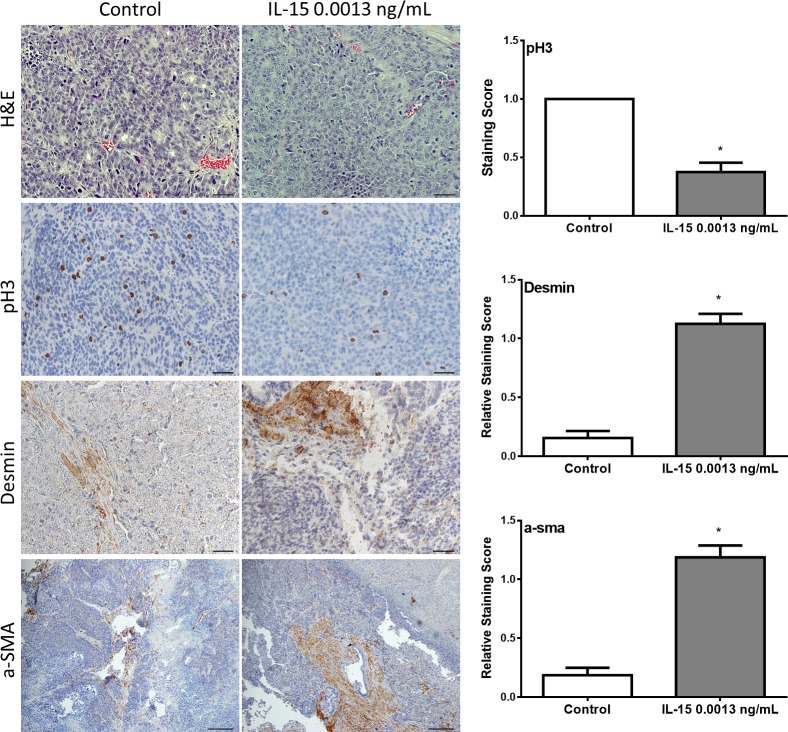
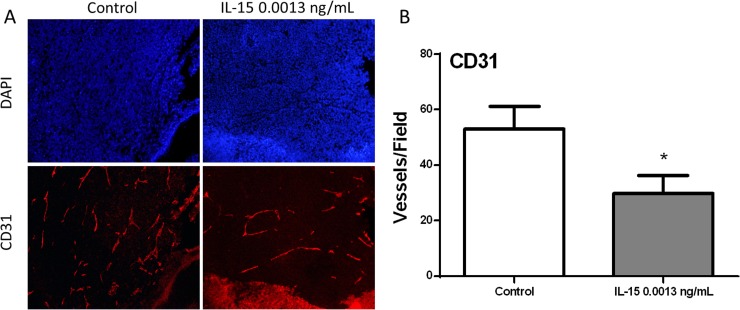
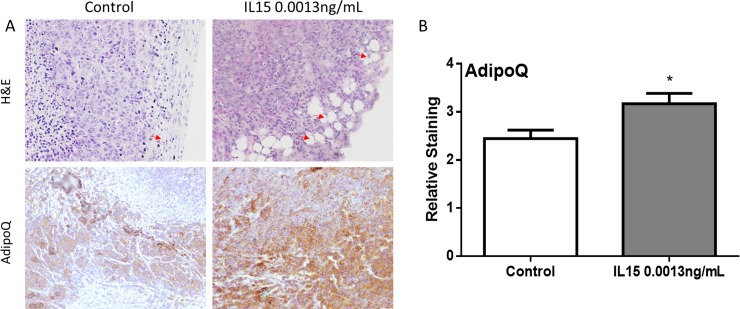
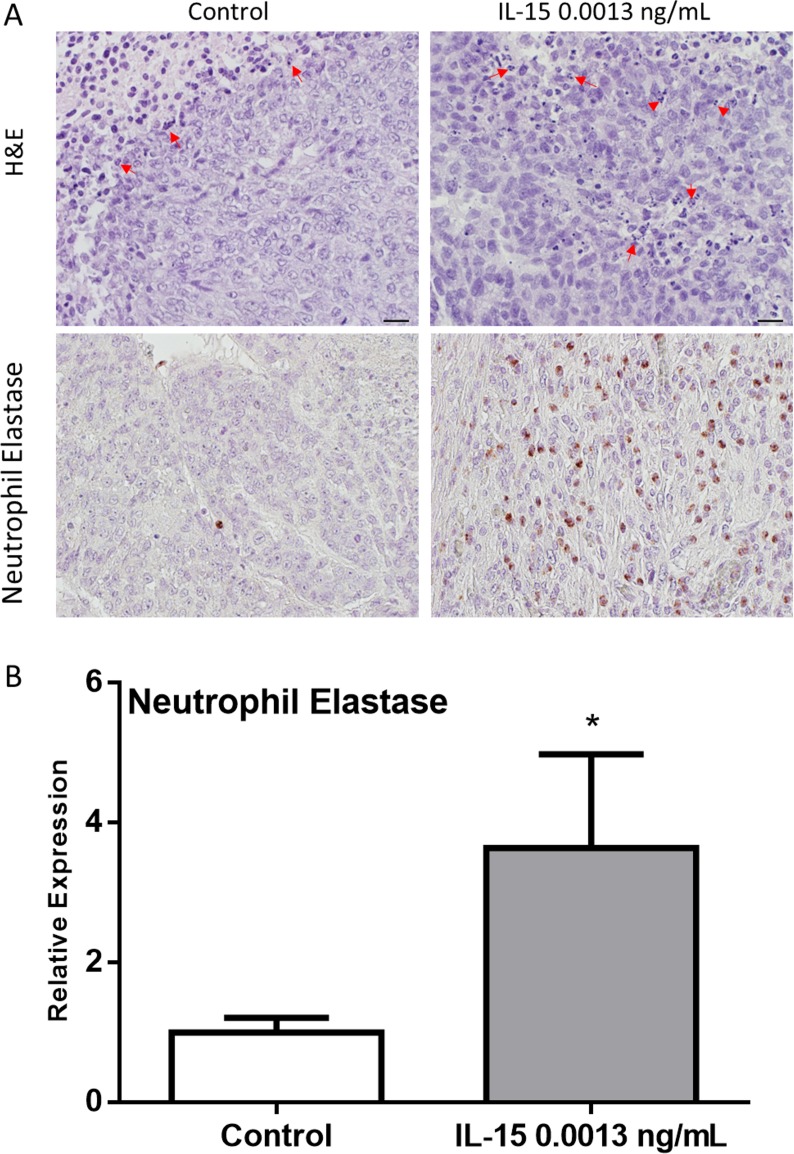
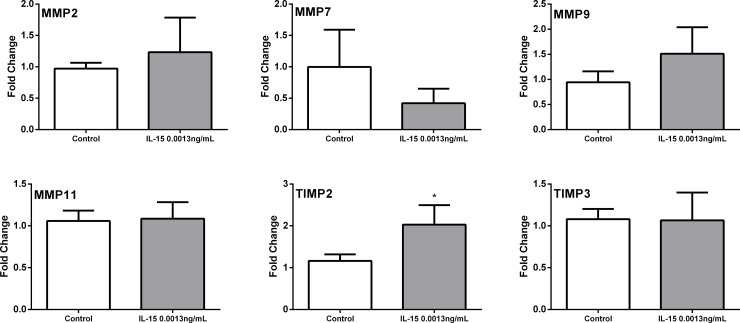
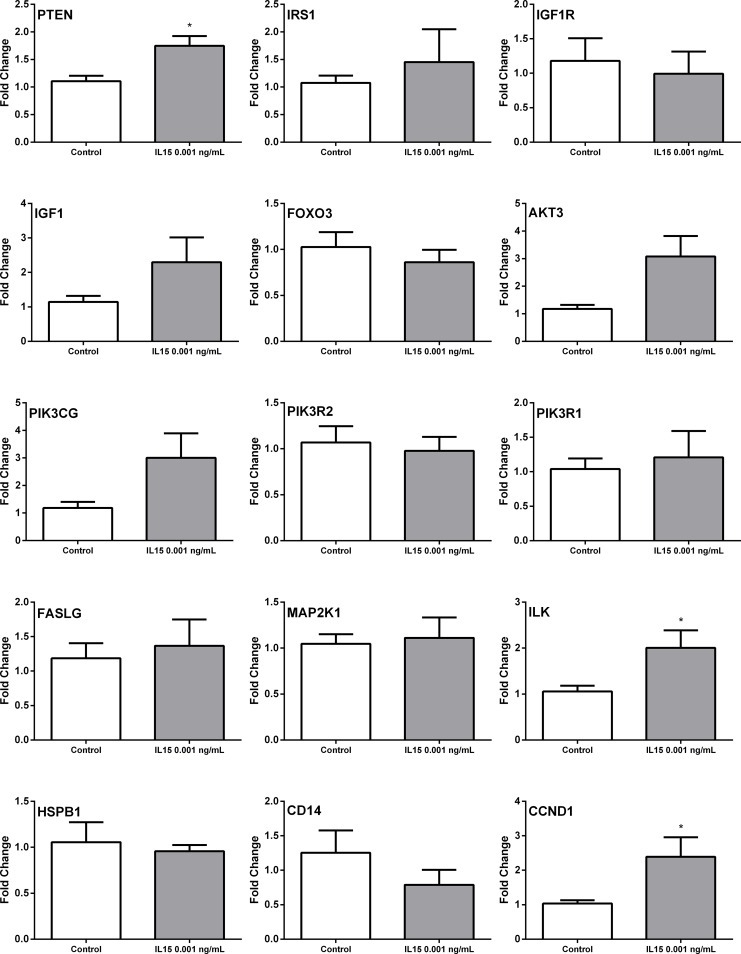
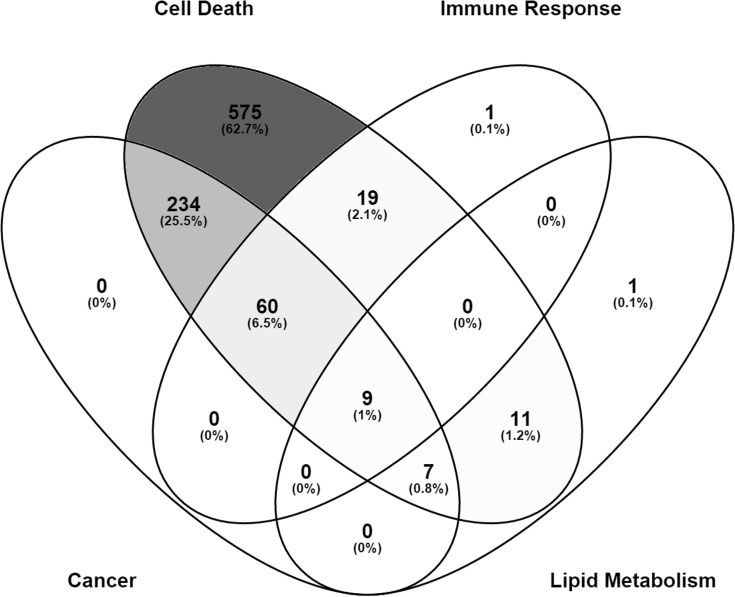
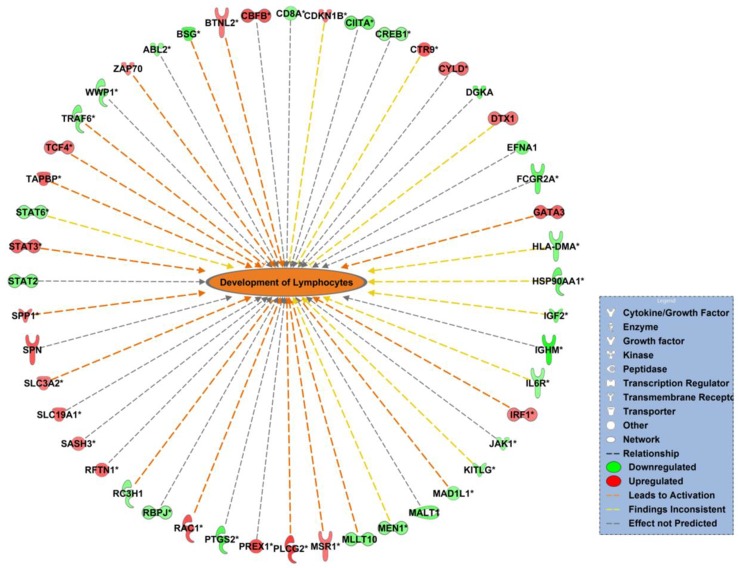
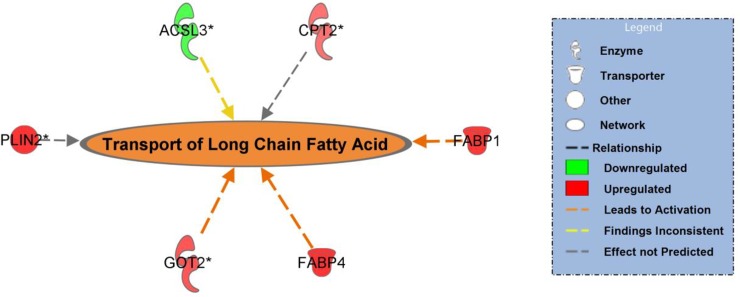
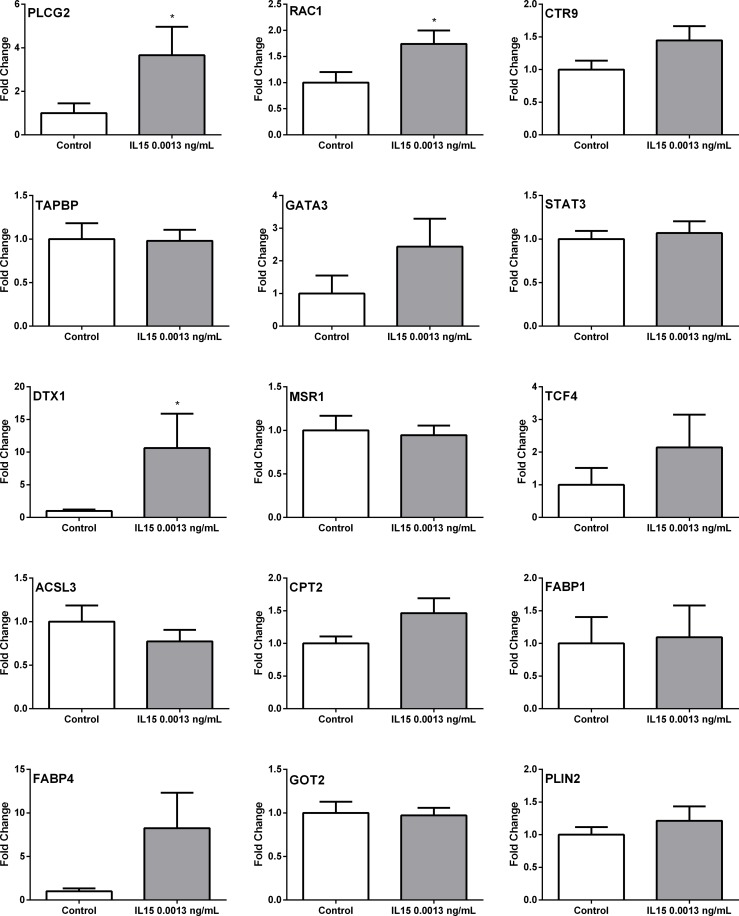
Prostate cancer (PCa) is the most commonly diagnosed non-cutaneous cancer. In the United States it is second leading cause of cancer related deaths in men. PCa is often treated via radical prostatectomy (RP). However, 15-30% of the patients develop biochemical recurrence (i.e. increased serum prostate specific antigen (PSA) levels). Interleukin-15 (IL-15) is a secreted cytokine found over expressed in patients with recurrence-free survival after RP. In our study, we aim to determine the role of IL-15 in PCa using in vitro and in vivo models, and gene expression analysis. PC3 (androgen-independent) and 22RV1 (androgen-dependent) cell lines were treated with IL-15 at 0.0013 ng/mL and 0.1 ng/mL. Tumor growth was evaluated using an orthotopic xenograft model. The anterior prostate lobes of SCID mice were injected with 250,000 22RV1 cells and IL-15 was administered bi-weekly with intraperitoneal (IP) injections during 4 weeks. Tumor tissue was collected for immunohistochemical and gene expression analysis. To study changes in gene expression, we looked at "Tumor Metastasis" and "PI3K pathway" using commercially available PCR arrays. In addition, we employed a microarray approach using the Affymetrix Hugene 2.0 ST array chip followed by analysis with Ingenuity Pathways Analysis (IPA) software. In vitro studies showed that IL-15 decreased PCa cell motility at both concentrations. In vivo studies showed that IL-15 increased neutrophil infiltration, and the expression of adiponectin, desmin and alpha smooth muscle actin (α-sma) in the tumor tissue. Angiogenesis analysis, using CD31 immunohistochemistry, showed that IL-15 decreased the number of blood vessels. Gene expression analysis identified Cancer, Cell Death, Immune Response and Lipid Metabolism as the major diseases and functions altered in tumors treated with IL-15. This suggests that IL-15 causes inflammation and changes in stroma that can promote decreased tumor cell proliferation.


Conflict of interest statement

Competing Interests: The authors have declared that no competing interests exist.

Figures

Fig 1
Fig 1. IL-15 decreases PC3 cell migration in vitro.
(A) Representative 4x magnification images at 0, 12, and 24hours (top to bottom). (B) Statistical analysis shows that IL-15 treatment causes a significant decrease in cell migration at 12 hours (top) and 24 hours (bottom). Mean + SEM (*P<0.05).
Fig 2
Fig 2. IL-15 decreases PC3 and 22RV1 cell invasion in vitro.
(A) Representative 10x magnification images of invasive cells at 24h. PC3 (Top) 22RV1 (Bottom) (B) Statistical analysis shows that IL-15 treatment causes a significant decrease in cell invasion. PC3 (Top) 22RV1 (Bottom). Mean + SEM (*P<0.05).
Fig 3
Fig 3. IL-15 increases tumor volume.
(A) Representative photographs of murine tumor tissue treated with IL-15 (0.0013 ng/mL) and control. (B) Statistical analysis shows that IL-15 increased tumor volume at 0.0013ng/mL. Ncontrol = 26, NIL-15 = 20. Mean + SEM (*P<0.05).
Fig 4
Fig 4. IL-15 treatment affects expression of pH3, desmin and a-sma in vivo.
Tumor tissue was evaluated pathologically and immunohistochemically. Pathological analysis was done with hematoxylin-eosin staining (top pane) and immunohistochemistry was done to evaluate the expression of phosho-histone 3 (pH3), desmin, and alpha smooth muscle actin (a-sma), (top to bottom). IL-15 treatment decreased the expression of pH3, and increased the expression of desmin and a-sma. n = 10 tumors per group. Scale bar (H&E, pH3, and desmin) = 20 μm (40x), Scale bar (a-sma) = 50 μm (20x) Mean + SEM (*P<0.05)
Fig 5
Fig 5. IL-15 decreases angiogenesis in vivo.
To evaluate angiogenesis, we performed Immunofluorescence of CD31 in tumor tissue. (A) Representative 20x magnification immunofluorescence images of 22RV1 tumors, Control and IL-15 0.001ng/mL. Nuclei are stained with DAPI (blue) and blood vessels are stained with CD31 (red). (B) Statistical analysis shows that blood vessels were significantly decreased with IL-15 treatment. Mean + SEM (*P<0.05).
Fig 6
Fig 6. IL-15 increases lipid deposition and metabolism in vivo.
(A) Representative 40x magnification images of 22RV1 tumors, H&E (Top panel) shows increased number of lipid droplets in IL-15 tumors (Red arrows), AdipoQ (Bottom Panel) shows increased expression of adiponectin in IL-15 tumors. (B) Statistical analysis shows that adiponectin is significantly increased with IL-15 treatment. Mean + SEM (*P<0.05).
Fig 7
Fig 7. IL-15 increases neutrophil invasion and degranulation in vivo.
(A) Representative images of 22RV1 tumors: H&E (Top panel) shows increased invading neutrophils (60x magnification) (red arrows) in IL-15; neutrophil elastase (Bottom Panel) shows increased expression of Neutrophil elastase in IL-15 tumors (40x magnification). (B) Statistical analysis shows that neutrophil elastase was significantly increased with IL-15 treatment. Scale bar = 10 μm, Mean + SEM (*P<0.05).
Fig 8
Fig 8. qRTPCR analysis of differentially expressed genes in murine tumors treated with IL-15: Tumor Metastasis PCR array.
Genes were obtained from the Tumor metastasis PCR array. Expression of: Matrix metallopeptidase 2 (MMP2), Matrix metallopeptidase 7 (MMP7), Matrix metallopeptidase 9 (MMP9), Matrix metallopeptidase 11 (MMP11), Tissue inhibitor of metallopeptidase type 2 (TIMP2) and Tissue inhibitor of metallopeptidase type 3 (TIMP3). Fold change was calculated with the ddCT method. N = 5 representative tumor samples per treatment. Mean+ SEM. *p<0.05. Experiments performed in triplicate.
Fig 9
Fig 9. qRTPCR analysis of differentially expressed genes in murine tumors treated with IL-15: PI3K PCR array.
Genes were obtained from the PI3K pathway PCR array Real time PCR results for: Phosphatase and tensin homolog (PTEN), Insulin receptor substrate 1 (IRS1), Insulin-like growth factor 1 receptor (IGF1R), Insulin-like growth factor 1 (IGF1), Forkhead box O3 (FOXO3), V-akt murine thymoma viral oncogene homolog 3 (AKT3), Phosphoinositide-3-kinase, catalytic, gamma polypeptide (PIK3CG), Phosphoinositide-3-kinase, regulatory subunit 2 (beta) (PIK3R2), Phosphoinositide-3-kinase, regulatory subunit 1 (alpha) (PIK3R1), Fas ligand (FASLG), Mitogen-activated protein kinase kinase 1 (MAP2K1), Integrin-linked kinase (ILK), Heat shock 27kDa protein 1 (HSPBP1), CD14 molecule (CD14), and Cyclin D1 (CCND1). Fold change calculated with the ddCT method. N = 5 representative tumor samples per treatment. Mean+ SEM. *p<0.05. Experiments performed in triplicate.
Fig 10
Fig 10. Gene expression patterns affected by IL-15 in vivo.
Microarray analysis was performed with murine tumor samples. IL-15 treatment affected the expression of 917 genes in total. These were grouped into 4 top diseases and functions: cancer, cell death, immune response, and lipid metabolism. Out of these, 575 were solely associated with Cell death, 234 were associated to cancer and cell death, and 60 were associated cancer, cell death, and immune response. Image was generated using Venny 2.1 [27]
Fig 11
Fig 11. IL-15 affects genes associated with lymphocyte development in a PCa murine model.
Network representation of affected functions by IL-15. Orange color represents predicted activation of the network. Orange arrows represent that the state of expression of the gene leads to activation of the network, yellow arrows represent that the state of expression of that gene results in inconclusive activation of the network, and grey arrows represent that the state of expression of that gene does not affect the activation of the network. Red-colored genes are up-regulated in the data set and green-colored genes are down-regulated in the data set. Image was generated in IPA software. p value = 0.016, z score = 1.496
Fig 12
Fig 12. IL-15 affects genes associated with long chain fatty acid transport in a PCa murine model.
Network representation of long chain fatty acid transport. This function is represented with an orange color since it was predicted to be increased by IL-15. Up-regulated genes are represented by a red color and down-regulated genes are represented by a green color. Genes whose expression lead to activation of the network are connected with orange arrows, those with an inconclusive connection to the network, are connected with yellow arrows. Genes that do not affect the activation of the network are connected with grey arrows. Image was generated in Ingenuity Pathways Analysis (IPA) software. p value = 0.0031, z score = 1.227
Fig 13
Fig 13. Real time PCR analysis of differentially expressed genes in tumors treated with IL-15.
Real time PCR results for: Phospholipase C, Gamma 2 (PLCG2), Ras-Related C3 Botulinum Toxin Substrate 1 (RAC1), Paf1/RNA Polymerase II Complex Component (CTR9), TAP Binding Protein (TAPBP), GATA Binding Protein 3 (GATA3), Signal Transducer and Activator of Transcription 3 (STAT3), Deltex 1, E3 Ubiquitin Ligase (DTX1), Macrophage Scavenger Receptor 1 (MSR1), Transcription Factor 4 (TCF4), Acyl-CoA Synthetase Long-Chain Family Member 3 (ACSL3), Carnitine Palmitoyltransferase 2 (CPT2), Fatty Acid Binding Protein 1 (FABP1), Fatty Acid Binding Protein 4 (FABP4), Glutamic-Oxaloacetic Transaminase 2 (GOT2), and Perilipin 2 (PLIN2). Fold change calculated with the ddCT method. N = 5 representative tumor samples per treatment. Mean+ SEM. *p<0.05. Experiments performed in duplicate.

References

    1. Siegel RL, Miller KD, Jemal A. Cancer statistics, 2015. CA Cancer J Clin. 2015;65: 5–29. 10.3322/caac.21254 - DOI - PubMed
    1. Freedland SJ, Humphreys EB, Mangold L a, Eisenberger M, Dorey FJ, Walsh PC, et al. Risk of prostate cancer-specific mortality following biochemical recurrence after radical prostatectomy. JAMA. American Medical Association; 2005;294: 433–9. 10.1001/jama.294.4.433 - DOI - PubMed
    1. Alva A, Hussain M. Intermittent androgen deprivation therapy in advanced prostate cancer. Curr Treat Options Oncol. 2014;15: 127–36. 10.1007/s11864-013-0272-2 - DOI - PubMed
    1. Bruce JY, Lang JM, McNeel DG, Liu G. Current controversies in the management of biochemical failure in prostate cancer. Clin Adv Hematol Oncol. 2012;10: 716–22. - PubMed
    1. Stephenson AJ, Kattan MW, Eastham J a, Dotan Z a, Bianco FJ, Lilja H, et al. Defining biochemical recurrence of prostate cancer after radical prostatectomy: a proposal for a standardized definition. J Clin Oncol. 2006;24: 3973–8. 10.1200/JCO.2005.04.0756 - DOI - PubMed

MeSH terms