. 2017 Apr 5;11(4):e0005507.
doi: 10.1371/journal.pntd.0005507. eCollection 2017 Apr.

Unraveling Chagas disease transmission through the oral route: Gateways to Trypanosoma cruzi infection and target tissues

Affiliations

Unraveling Chagas disease transmission through the oral route: Gateways to Trypanosoma cruzi infection and target tissues

Danielle Silva-Dos-Santos et al. PLoS Negl Trop Dis. .

Abstract

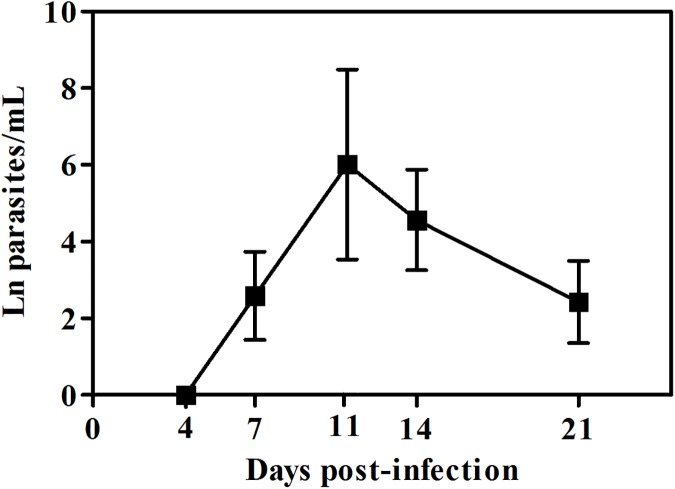
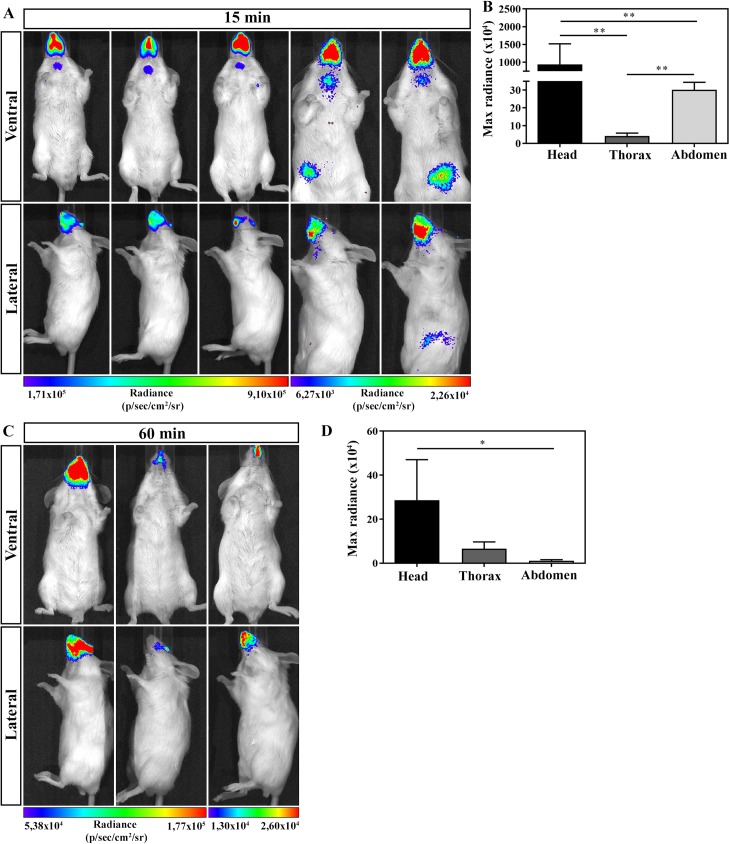
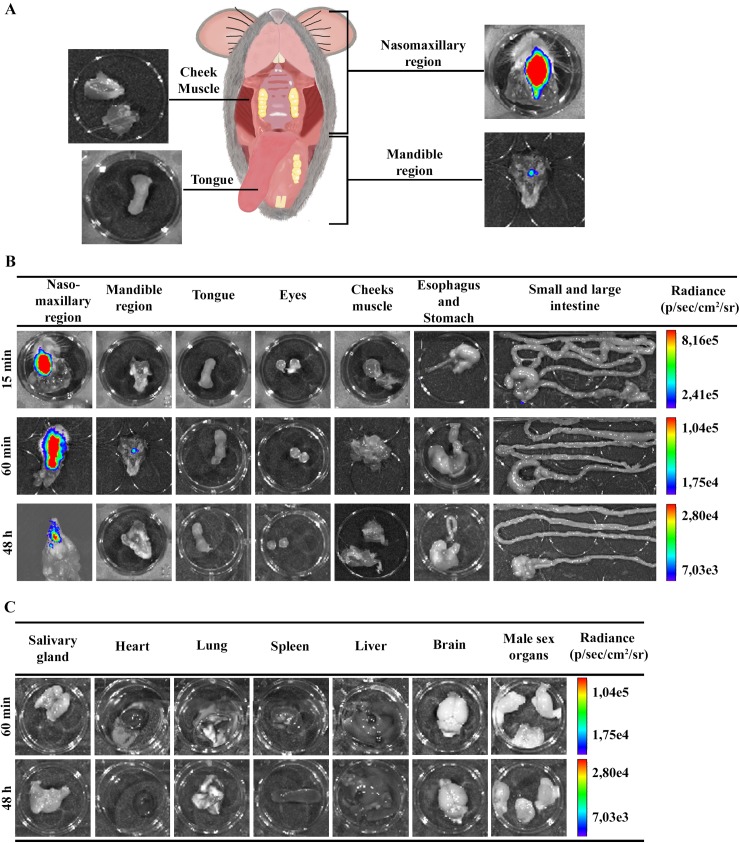
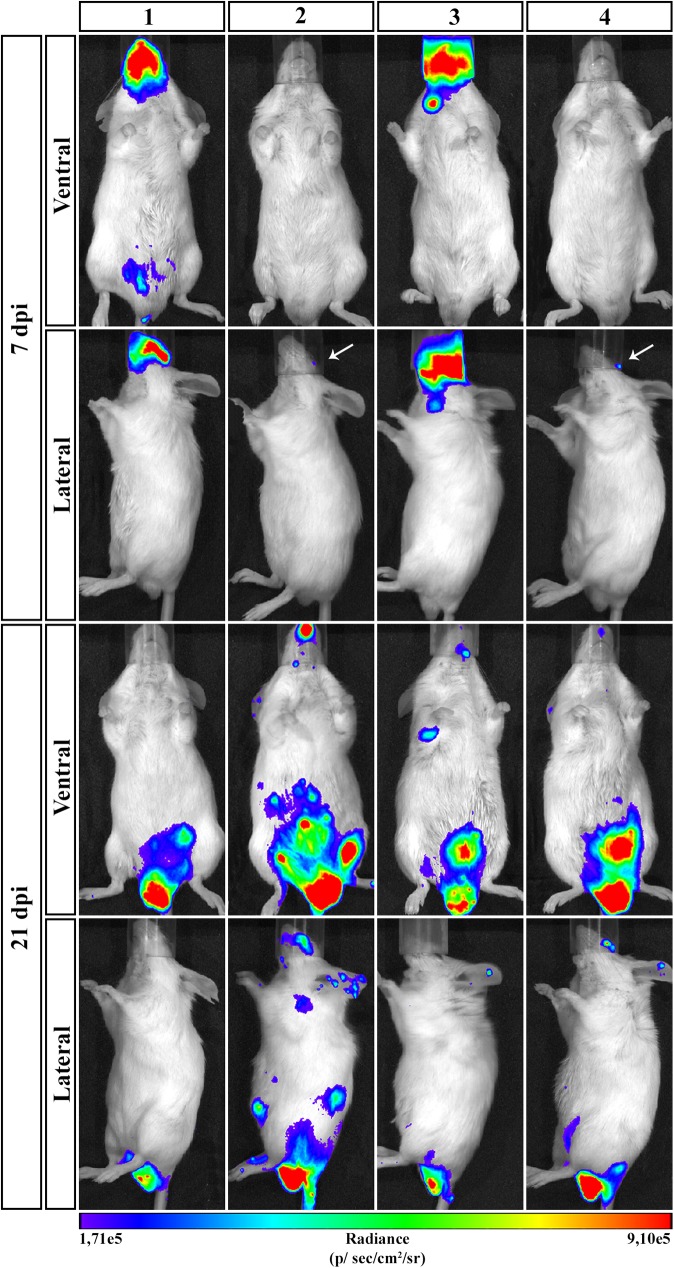
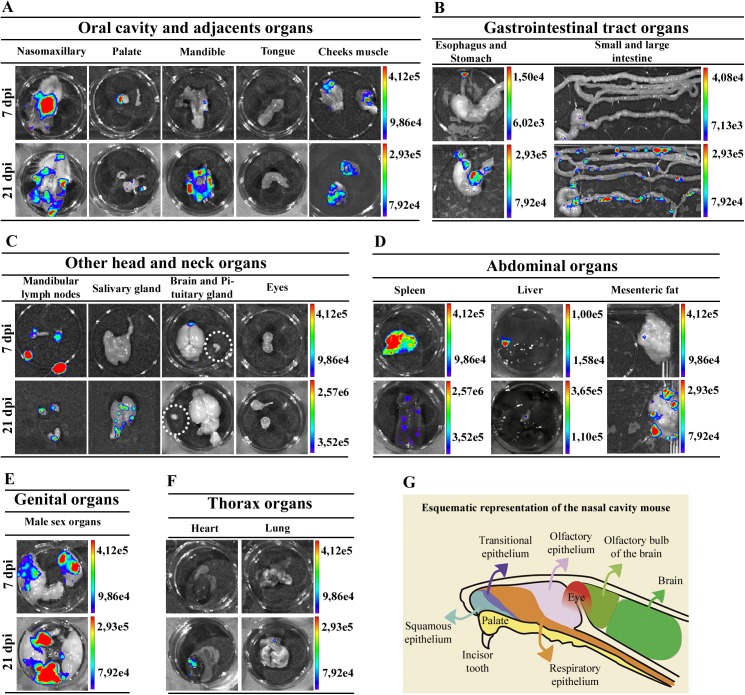
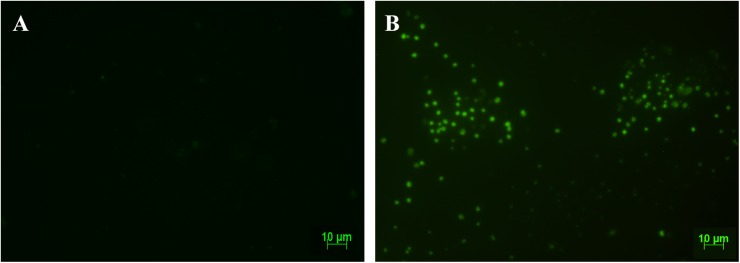
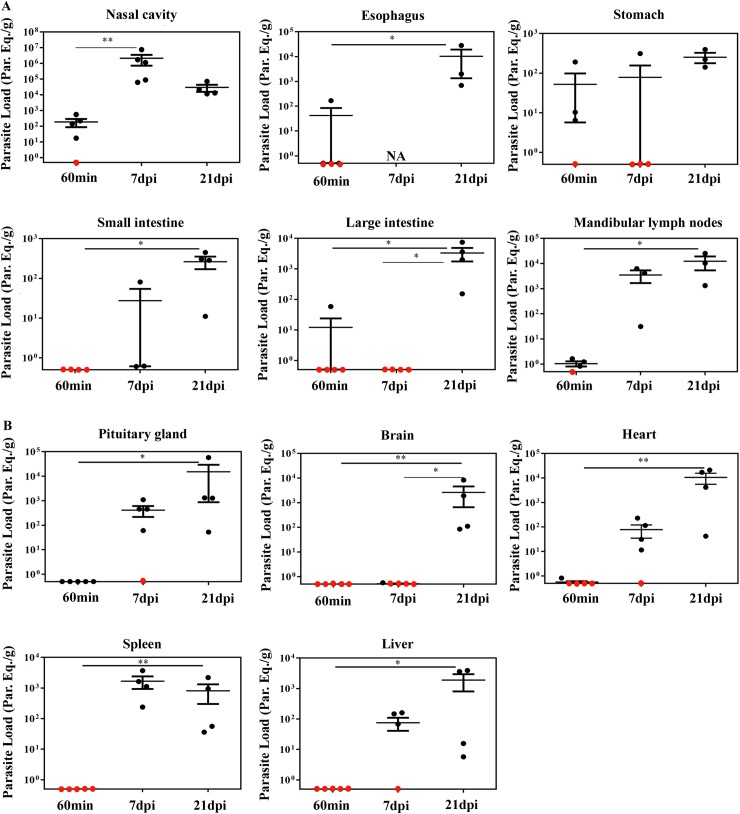
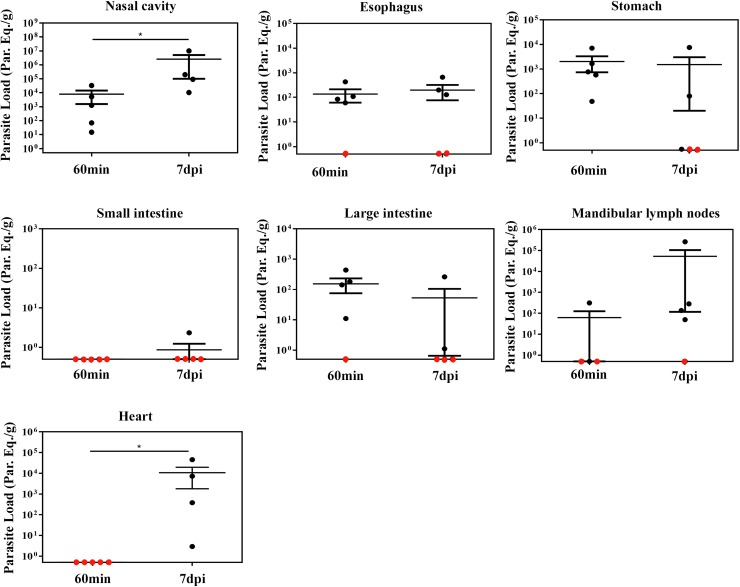
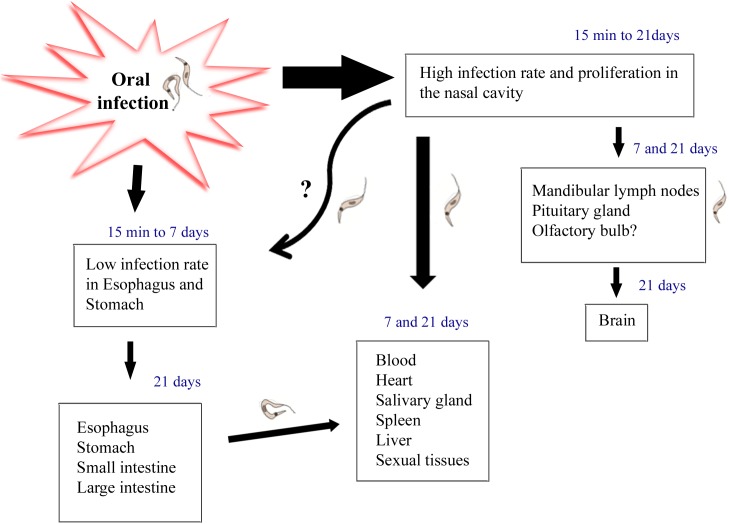
Oral transmission of Trypanosoma cruzi, the causative agent of Chagas disease, is the most important route of infection in Brazilian Amazon and Venezuela. Other South American countries have also reported outbreaks associated with food consumption. A recent study showed the importance of parasite contact with oral cavity to induce a highly severe acute disease in mice. However, it remains uncertain the primary site of parasite entry and multiplication due to an oral infection. Here, we evaluated the presence of T. cruzi Dm28c luciferase (Dm28c-luc) parasites in orally infected mice, by bioluminescence and quantitative real-time PCR. In vivo bioluminescent images indicated the nasomaxillary region as the site of parasite invasion in the host, becoming consistently infected throughout the acute phase. At later moments, 7 and 21 days post-infection (dpi), luminescent signal is denser in the thorax, abdomen and genital region, because of parasite dissemination in different tissues. Ex vivo analysis demonstrated that the nasomaxillary region, heart, mandibular lymph nodes, liver, spleen, brain, epididymal fat associated to male sex organs, salivary glands, cheek muscle, mesenteric fat and lymph nodes, stomach, esophagus, small and large intestine are target tissues at latter moments of infection. In the same line, amastigote nests of Dm28c GFP T. cruzi were detected in the nasal cavity of 6 dpi mice. Parasite quantification by real-time qPCR at 7 and 21 dpi showed predominant T. cruzi detection and expansion in mouse nasal cavity. Moreover, T. cruzi DNA was also observed in the mandibular lymph nodes, pituitary gland, heart, liver, small intestine and spleen at 7 dpi, and further, disseminated to other tissues, such as the brain, stomach, esophagus and large intestine at 21 dpi. Our results clearly demonstrated that oral cavity and adjacent compartments is the main target region in oral T. cruzi infection leading to parasite multiplication at the nasal cavity.


Conflict of interest statement

The authors have declared that no competing interests exist.

Figures

Fig 1
Fig 1. Parasitemia levels in mice orally infected with Dm28c-luc.
Male BALB/c mice were infected with 1x10⁶ trypomastigotes forms of T. cruzi expressing luciferase (Dm28c-luc) through the oral cavity (OI). Parasitemia was assessed during acute phase by couting parasites with light microscope and the number of peripheral blood parasites was calculated by the Brener method. Values represent mean ± SEM. n: 4 and 11 dpi = 6; 7, 14 and 21 dpi = 16. The total number was obtained from two independent experiments.
Fig 2
Fig 2. In vivo bioluminescence imaging of mice infected with Dm28c-luc at 15 and 60 min of infection.
Male BALB/c mice were infected in the oral cavity (OI) with 1x10⁶ trypomastigotes forms of T. cruzi expressing luciferase (Dm28c-luc). Evaluation of OI mice was performed at 15 (A and B) and 60 min (C and D) post-infection using bioluminescent imaging (IVIS Lumina system). (A) In vivo bioluminescence imaging at 15 min post-infection (n = 5). (B) In vivo quantification of luminescent signal at 15 min post-infection (n = 5). (C) In vivo bioluminescence imaging at 60 min post-infection (n = 3). (D) In vivo quantification of luminescent signal at 60 min post-infection (n = 3). The scale bar for radiance (below) was correlated with the signal intensity, where red indicates higher signal and blue indicates a lower signal. Maximum and minimum signals are indicated at the right and left of the scale bar, respectively. Numbers represent mean ± SEM. Data were analyzed using one tailed Mann-Whitney test. Statistical analysis was performed using GraphPad Prism 5. * p<0.05; ** p < 0.01.
Fig 3
Fig 3. Ex vivo evaluation of dissected organs and tissues by bioluminescent imaging.
Male BALB/c mice were infected in the oral cavity (OI) with 1x10⁶ trypomastigotes forms of T. cruzi expressing luciferase (Dm28c-luc). After 10 min of D-luciferin i.p administration (150 mg/kg), organs were harvested and images were captured using an IVIS Lumina II system. (A) Schematic picture for anatomic localization of organs and tissues analyzed. Nasomaxillary region includes all tissues from regions of the nose, nasal cavity and upper region of the oral cavity with exception of the cheek muscle. Mandible region includes all tissues of the mandible and the lower region of the oral cavity, with exception of the tongue (B and C). Ex vivo bioluminescence imaging from selected organs and tissues at 15 min (n = 3), 60 min (n = 4 in the nasomaxilary region; n = 2 in other organs) and 48 hours (n = 5) post-infection. The scale bar for radiance (right) was correlated with the signal intensity, where red indicates higher signal and blue indicates a lower signal. Maximum and minimum signals are indicated at the top and bottom of the scale bar, respectively.
Fig 4
Fig 4. Course of parasite dissemination in Trypanosoma cruzi oral infection.
Male BALB/c mice were infected in the oral cavity (OI) with 1x10⁶ trypomastigotes forms of T. cruzi expressing luciferase (Dm28c-luc). Representative in vivo bioluminescence images were acquired in the same mice (n = 6), at 7 and 21 dpi, after 15 min of D-luciferin IP administration (150 mg/kg), using IVIS Lumina image system (Xenogen) The scale bar for radiance (below) was correlated with the signal intensity, where red indicates higher signal and blue indicates a lower signal. Maximum and minimum signals are indicated at the right and left of the scale bar, respectively. White arrows indicate the presence of bioluminescence.
Fig 5
Fig 5. Ex vivo bioluminescence images from infected mice confirm the systemic dissemination of the parasite.
Male BALB/c mice were infected in the oral cavity (OI) with 1x10⁶ trypomastigotes forms of T. cruzi expressing luciferase (Dm28c-luc). After 10 min of D-luciferin administration IP (150 mg/kg), organs were harvested and images were captured using an IVIS Lumina II system. Ex vivo bioluminescence imaging at 7 and 21 dpi: (A) oral cavity and adjacent organs; (B) gastrointestinal tract organs; (C) others head and neck organs. Pituitary gland: inside white circle; (D) abdominal organs; (E) In the male sex organ image, testicle and epididymal fat are located at the sides and the preputial gland in the bottom; (F) thorax organs. (n = 4 palate, cheek muscle; pituitary gland, mandibular lymph nodes mesenteric fat and lymph nodes; n = 6, others organs). The scale bar for radiance (right) was correlated with the signal intensity, where red indicates higher signal and blue indicates a lower signal. Maximum and minimum signals are indicated at the top and lower region of scale bar, respectively. (G) Schematic drawing of an anatomic section from a mouse head. The septum was removed, exposing the lateral wall and some of the major structures in the head. Palate (yellow), eyes (red), brain (light and dark green), olfactory bulb (light green) and nasal cavity are shown and the distribution of surface epithelial types lining the nasal airways is represented in blue, dark-purple, orange and light-purple colors for the squamous, transitional, respiratory, and olfactory epithelium, respectively.
Fig 6
Fig 6. Amastigote nests detection by fluorescence microscopy of nasal cavity from mice infected with Dm28c-GFP.
Male BALB/c mice were infected with 1x10⁶ trypomastigotes forms of T. cruzi expressing GFP reporter gene (Dm28c-GFP). At 6 dpi, the nasal cavity tissues were removed, frozen and sections were prepared for fluorescence microscopy analysis. (A) Representative fluorescence image of the nasal cavity from uninfected mice. (B) Representative fluorescence image of the nasal cavity from infected mice. Several amastigote nests (green) can be observed in the nasal cavity. Data represent analysis from an experiment with n = 2.
Fig 7
Fig 7. Quantification of tissue parasite loads in BALB/c mice orally infected with T. cruzi Dm28c-luc strain.
Male BALB/c mice were infected in the oral cavity (OI) with 1x10⁶ trypomastigotes forms of T. cruzi expressing luciferase (Dm28c-luc). Organs and tissues were harvested for qPCR analysis to determine the parasite load (parasite equivalent/g) at 60 min, 7 and 21 dpi. The qPCR was performed in multiplex, targeting T. cruzi nuclear satellite DNA (Sat DNA) and IAC, as a quality control. (A) Parasite load in the nasal cavity (n: 60 min and 7dpi = 5; 21 dpi = 4), esophagus (n: 60 min = 4; 21 dpi = 3), stomach (n: 60 min and 7 dpi = 4; 21 dpi = 3), small intestine (n: 60 min = 5; 7 dpi = 3; 21 dpi = 4); large intestine (n: 60 min = 5; 7 and 21 dpi = 4) and mandibular lymph nodes (n: 60 min = 4; 7 and 21 dpi = 3). (B) Parasite load in the pituitary gland (n: 60 min and 7dpi = 5; 21 dpi = 4), brain (n: 60 min and 7 dpi = 5; 21 dpi = 4), heart (n: 60 min and 7dpi = 5; 21 dpi = 4), spleen (n: 60 min = 4; 7 and 21 dpi = 4) and liver (n: 60 min and 7 dpi = 5; 21 dpi = 4). Red dots: no parasite detection. Values present mean ± SEM. Kruskal-Wallis (Dunn’s post-test) was used for group kinetics. Statistical analysis was performed using Graph Pad Prism 5. * p < 0.05, **p < 0,01.
Fig 8
Fig 8. Quantification of tissue parasite loads in BALB/c mice orally infected with T. cruzi Tulahuén strain.
Male BALB/c mice were infected in the oral cavity (OI) with 1x10⁶ trypomastigotes forms of T. cruzi Tulahuén strain (DTU-TcVI). Organs and tissues were harvested for qPCR analysis to determine the parasite load (parasite equivalent/g) at 60 min and 7 dpi. The qPCR was performed in multiplex, targeting T. cruzi nuclear satellite DNA (Sat DNA) and IAC, as a quality control. Parasite load in the: nasal cavity (n: 60 min = 5; 7 dpi = 4), esophagus (n: 60 min and 7dpi = 5), stomach (n: 60 min and 7 dpi = 5), small intestine (n: 60min and 7 dpi = 5), large intestine (n: 60 min and 7 dpi = 5), mandibular lymph nodes (n: 60 min = 4 and 7 dpi = 5) and heart (n: 60 min = 4 and 7 dpi = 5). Red dots: no parasite detection. Values present mean ± SEM. One tailed Mann-Whitney test was used for group kinetics. Statistical analysis was performed using GraphPad Prism 5. * p < 0.05.
Fig 9
Fig 9. Hypothesis: Oral infection involves Trypanosma cruzi infection through the mouth into the nasal cavity, the main source of parasite replication.
Nasal cavity parasites might disseminate through the olfactory nerve to the brain and also by the lymphatic and/or blood circulation to distant tissues. Moreover, as previously described by others, a small amount of parasites migrates to the gastric mucosa in initial moments of infection. T. cruzi infection in the stomach may also be associated to parasite dissemination trough the host.

References

    1. Coura JR, Vinas PA. Chagas disease: a new worldwide challenge. Nature. 465(7301):S6–7. doi: 10.1038/nature09221 - DOI - PubMed
    1. Gascon J, Bern C, Pinazo MJ. Chagas disease in Spain, the United States and other non-endemic countries. Acta Trop. 2010;115(1–2):22–7. Epub 2009/08/04. doi: 10.1016/j.actatropica.2009.07.019 - DOI - PubMed
    1. Schmunis GA, Yadon ZE. Chagas disease: a Latin American health problem becoming a world health problem. Acta Trop. 2010;115(1–2):14–21. Epub 2009/11/26. doi: 10.1016/j.actatropica.2009.11.003 - DOI - PubMed
    1. Toso MA, Vial UF, Galanti N. [Oral transmission of Chagas' disease]. Rev Med Chil. 2011;139(2):258–66. Epub 2011/07/21. doi: /S0034-98872011000200017 - PubMed
    1. Sanchez LV, Ramirez JD. Congenital and oral transmission of American trypanosomiasis: an overview of physiopathogenic aspects. Parasitology. 2013;140(2):147–59. Epub 2012/09/27. doi: 10.1017/S0031182012001394 - DOI - PubMed