. 2017 Apr 5;12(4):e0174905.
doi: 10.1371/journal.pone.0174905. eCollection 2017.

Application of JC1 for non-toxic isolation of cells with MDR transporter activity by flow cytometry

Affiliations

Application of JC1 for non-toxic isolation of cells with MDR transporter activity by flow cytometry

J Mario Wolosin et al. PLoS One. .

Abstract

The DNA intercalating dye Hoechst 33342 or its close analog DCV are actively removed from cells by the multidrug resistance transporter ABCG2, a protein overexpressed in metastatic cells and somatic stem cells. In bivariate blue-red flow cytometry fluorescent plots active Hoechst or DCV efflux combined with a concentration dependent bathochromic shifts of these nuclear dyes leads to the segregation of the transporter-rich cells into a distinct cell cohort tilted towards the shorter wavelength axis of the plot, the cohort is generically known as the side population (SP). This feature has facilitated the surface marker-independent isolation of live stem cells. A drawback, though, is the known toxicity of Hoechst dyes. In this study we show that JC1, a bathochromic mitochondrial membrane potential-sensitive dye applied at proper concentration, can yield flow cytometry fluorescent emission bivariate plots containing a low JC1 accumulation (JC1low) cohort. Using a combination of multiple cell lines, ABC-transporter inhibitors and viral vector-driven insertion of the ABCG2 gene or ABCG2 and ABCB1 shRNAs we demonstrate that JC1low can be generated by either of the two aforementioned multidrug resistance transporters. Complete wash out of mitochondrial bound JC1 required more than 24 h. In spite of this tight binding, the dye did not affect either the mitochondrial membrane potentials or the proliferation rate. In contrast, contemporaneous with its nuclear accumulation, Hoechst 33342 or DVC, caused changes in the fluorescent emission of mitochondrial membrane potential sensitive dyes resembling the effects caused by the mitochondrial uncoupler FCCP. In a number of cell lines exposure to Hoechst resulted in marked slow-down of proliferation and abolition of ABCG2 transport activity during the subsequent 2 days but in K562 cells the exposure induced cell extended death. Overall, its lack of toxicity vis. a vis. the toxicity and genotoxicity of the DNA intercalating dyes makes JC1 an ideal tool for isolating live cells expressing high multidrug resistance transport activity.


Conflict of interest statement

Competing Interests: The authors have declared that no competing interests exist.

Figures

Fig 1
Fig 1. Bivariate JC1 flow cytometry plots and correlated micrographs of HCE cells as a function of dye concentration, incubation and wash out time, re-incubation and re-culture of presorted JC1-SP and JC1-nonSP populations.
A-C. Graphical description of the gating strategy applied to all samples. Width vs. forward scatter (FSC) was used to exclude cells deviating from the main cohort of single cells (A), a plot of Fl3 (PI) fluorescence vs. FSC was used to select the live cells within the single cell population (B) and the final gating action excluded cells with high SSC/FCS ratios because those likely to be in early stages of apoptotic death (C). D-F. JC1 images after incubation with 125 (D), 250 (E) or 500 (F) nM JC1 for 60 min. The JC1low and JC1main cell cohorts are indicated in D. The vertical bracket in E marks the wide range of 525 nm emission intensities over which the transition from JC1low to JC1main occurs for different cells. G. Composite of bivariate images for HCE cells incubated in 250 nM JC1 as a function of time of incubation. H. JC1 image after incubation for 120 min with 250 nM JC1 including 10 μM FCCP for the last 20 min. Note the x-axis scales and vertical red dashed lines indicating the stain position after FCCP relative to the position of the JC1low and JC1main prior to FFCP exposure. I. JC1 stains 1 h after 60 min incubation with JC1. J. Same culture as in panel I after 18h incubation in JC1-free conditions. K. Same sample as J after re-incubation with JC1 for 45 min. L and M. JC1 images after one week culture of sorted JC1low (L) and JC1main (M) cells. N-Q. Fluorescence images for the HCE cells incubated for 5 (N), 15(O) or 60 (P) min with 250 nM JC1 or as P but with the inclusion of FCCP for the last 15 min (Q).
Fig 2
Fig 2. Effect of inhibitors or shRNAs for ABCB1or ABCG2 transporters on JC1 or Hoechst exclusion in HCE cells.
All cells were incubated for 60 or 75 min with either 250 nM JC1 or 4 μg/ml Hoechst, unless indicated otherwise. Inhibitors were added 60 min before the addition of JC1 or Hoechst. The % of cells included within subjectively selected JC1-SP or Hoechst-SP domains (gates) are indicated next to the gate. A and B. Sixty min incubation with JC1; control (Cntrl) and puromycin-selected cells transduced with the ABCG2-A shRNA. C-E. Seventy five min incubation with JC1 incubated for 75 min; Control (C) and ABCG2 gene transduced cells before (D) or after (E) antibiotic selection. Note that the shRNA, in addition to the elimination of the JC1low cohort, causes a rightward shift of JC1main cells (B) while conversely, addition of the ABCG2 gene causes not only a large increase in the JC1low but also and a leftward shift of JC1main cells (E). F-H. Hoechst stain for 75 min. F. Control cells. G. Cells pre-incubated with 2 μM Ko143. The G0/G1, S and G2-M cell cohorts are indicated. H. ABCG2 shRNA transduced and puromycin selected cells. I. Western blot of unmodified HCEC and HCEC transduced with ABCG2 shRNA (shRNA) or ABCG2 gene. Top: ABCG2 stain. Bottom: GAPDH stain of the same blot.
Fig 3
Fig 3. Effect of inhibitors or shRNAs for ABCB1or ABCG2 transporters on JC1 or Hoechst exclusion in 293T cells.
Cells were incubated with dyes for 75 min. A-C. Control (A), and ABCB1shRNA transduced (B) or and scrambled shRNA transduced cells (C). D-F. Control cells and cells transduced with the ABCG2-A or ABCG2-B shRNAs, respectively. G-I. Control medium (G), medium complemented with 2 μM of either valspodar (H) or Ko143 (I), respectively. J and K. Hoechst 33342 stain in control (J) or after transduction with the ABCG2-A gene (K), respectively. L. Flow cytometry histogram of control or ABCB1shRNA-transduced live 293T immunostained with FITC-conjugated anti-ABCB1 antibody. An FITC conjugated isotype control was used to confirm the specificity of the staining.
Fig 4
Fig 4. Effect of inhibitors or shRNAs for ABCB1or ABCG2 transporters on JC1 or Hoechst exclusion in Caco-2 cells.
A-C. Control (A), ABCB1-A shRNA (B) and ABCG2-A shRNA transduced (C) cells were incubated with JC1 for 75 min. D-I. Control cells (D) and cells pretreated with 2 μM Ko143 (E), 5 μM Ko143 (F), 2 μM FTC (G), 2 μM Valspodar (H), or 5 μM valspodar (I) were incubated with JC1 for 90 min. J-L. Control cells (J), and cells pretreated with 2 μM Ko143 (K) or transduced with ABCB1-A shRNA (L) were incubated with Hoechst for 75 min.
Fig 5
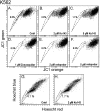
Fig 5. Effect of inhibitors ABC transporters on JC1 or Hoechst exclusion in K562 cells.
A- F. Cells were incubated for 90 min with JC1 in the absence of an inhibitor (A) or, after pretreatment with 2 μM Ko143 (B), 5 μM Ko143 (C), 1 μM Zosuquidar (D), 2 μM Valspodar (E) or 5 μM valspodar (F). G and H. Control cells (G) or cell pretreated with plus 2 μM Ko143 (H) were incubated with Hoechst for 75 min.
Fig 6
Fig 6. Effect of Hoechst 33342 on JC1 bivariate 525/585 emission plots and fluorescence microscopy in multiple adherent human cells.
A. Flow cytometry. The four different cell lines, HCE, HEK 293T (293T), Caco-2 (Cacao) and primary limbal epithelial cells were incubated for 60 min with 250 nM JC1 and after dye wash out, were incubated with either 5 ug/ml Hoechst 33342 (Ho) or 5 μM DCV for the indicated times (because of the need to harvest the cell by trypsinization, the times of cell incubation at 37 ⁰ C in the DNA binding dyes are extended by an extra 5–7 min beyond the incubation times stated, before biological activity can be arrested by sample cooling). B. Representative fluorescent images of HCE cells incubated for 75 min with JC1 and cultured for 3 h after dye wash up. C. Same cells as B but the medium was complemented with 5 μM DCV or 5 μg/ml Hoechst for 30 or 60 min during the last part of the 3 h culture. Right, center and left panels show, respectively, the fluorescence of the DNA dyes alone, JC1 alone and the merged images.
Fig 7
Fig 7. Cross correlation of JC1 and Hoechst exclusion cohorts (SPs) in cells expressing only ABCG2.
A. Freshly isolated rabbit conjunctiva epithelial cells that have been cultured overnight were simultaneously incubated for 75 min with 250 nM JC1 and 4μg/ml Hoechst. A Hoechst-SP gate was defined in the flow cytometry software under red color coding. In the JC1 image the great majority of these Hoechst-SP cells fall within an identifiable JC1-SP range. B. HCE cells incubated for 75 min with JC1 and washed were incubated with 2 μg/ml Hoechst for 5–10 and 30 min, as indicated. The same color coding method described in A was used to track the uptake of Hoechst by the JC1-SP cells. The JC1-SP cells (red) show the slowest accumulation of Hoechst as function of time (arrow down). In the last frame the process of cross correlation was reversed to show that the cohort of cells with the lowest accumulation of Hoechst at 30 min (pink color gate) consists almost exclusively of JC1-SP cells (arrow up). Even with the lowered Hoechst concentration the leftward shift of the main JC1 population (i.e., depolarization) starts developing within 30 min (increased distance from blue line).
Fig 8
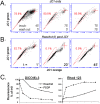
Fig 8. Effect of Hoechst 3342 and FCCP on MMPT as determined by JC1, DiOC6-3 or Rho 123 in K562 cells.
A. A high density K562 cell culture (3 x10⁶ cells/ml) was incubated with 250 nm JC1 for 45 and 75 min as indicated, or incubated for 75 min with JC1, spun down, resuspended in medium for an additional 75 min. B. Cells that have been incubated for 75 min with JC1 were complemented with 5μg/ml Hoechst and the changes in the JC1 image were recorded after 1, 20 and 45 min. Note that the SP and nonSP shift in opposite direction along the orange axis. C. K562 cell cultures (0.2 x 10⁶ cells/ml) were incubated with 5 nM DiOC6-3 for 20 min or 100 nM Rho123 for 60 min. The cultures were then complemented with either 5 μg/ml Hoechst 33342 or 15 μM FCCP and the changes in fluorescence were recorded at time intervals. Both FCCP and Hoechst caused time dependent decreases in DiOC (6)-3 and increases in Rho123 fluorescent emission, respectively. The FCCP effect was more rapid and pronounced. Results are the mean of two experiments.
Fig 9
Fig 9. Effect of exposure to JC1 and Hoechst on proliferation of cultured transformed and primary tissue cells.
A. Adherent cells at a ~ 40% density were treated with 250 nM JC1 or 5 μg/ml Hoechst for 90 min in triplicates or left untreated (Control). Cells were then cultured for 48 h and cells were counted in the Accuri 6. There were no statistical difference between control and JC1-treated cells. * and ** respectively indicate p < 0.01 and p < 0.05 for Hoechst respective to both control and JC1. B. HCE cells treated with 5 μg/ml Hoechst, or 250 nM JC1 for 90 min or left untreated. Cells were counted (top line plot), analyzed for relative live cell size (FCS, bottom line plot) and for JC1 accumulation (vertically oriented bivariate JC1 emission plots) every day for 3 to 4 days… The JC1 treatment caused no statistically demonstrable difference in cell count or FCS from control. Both populations increased about two fold for the first and second day (insert). In contrast cell counts for the Hoechst treated cells remain unchanged during these first 2 days. Additionally, FCS underwent a substantial increase and JC1 exclusion activity was abolished during this period. These negative effects waned during days 3 and 4. C. 293T cells exposed to Hoechst for 90 min. Note similarity of results with those for HCE cells for both cell count and FCS. D. Effect of Hoechst and FCCP on K562 cells. Cells were treated in the same manner used in Fig 5 to examine their effect on MMPT. Values represent the mean of duplicates. The line plot, the flow cytometry FSC/SSC bivariate plots and the SSC and FCS histograms show that Hoechst, but not FCCP, caused a selective increase in SSC during the incubation time without correlated changes in FSC. E. Cell count, SSC, fraction of live cells within the cells suspension and SSC/FCS ratios in K562 cells during the post-exposure 3 days. JC1 cell count (top line plot), and SSC values (bottom line plot) for the JC1 exposed cells were indistinguishable from control. In the Hoechst-treated K562 cells, cell count decreased gradually over the three day period while the SSC, which has already increased during the 90 min treatment period (Δ = 56%), continue to increase becoming after 3 days 2.5 higher than the control. This SSC increase occurred without any substantial increase in FCS (SSC/FCS plots). At the same time, the % of dead cells increased every day (PI stain /SSC plots).

Similar articles

Cited by

References

    1. Goodell MA, Brose K, Paradis G, Conner AS, Mulligan RC. Isolation and functional properties of murine hematopoietic stem cells that are replicating in vivo. J Exp Med. 1996;183:1797–806. - PMC - PubMed
    1. Zhou S1, Schuetz JD, Bunting KD, Colapietro AM, Sampath J, Morris JJ et al. The ABC transporter Bcrp1/ABCG2 is expressed in a wide variety of stem cells and is a molecular determinant of the side-population phenotype. Nat Med. 2001;7:1028–34. 10.1038/nm0901-1028 - DOI - PubMed
    1. Kim M, Morshead CM. Distinct populations of forebrain neural stem and progenitor cells can be isolated using side-population analysis. J Neurosci. 2003;23:10703–9. - PMC - PubMed
    1. Lassalle B, Bastos H, Louis JP, Riou L, Testart J, Dutrillaux B et al. Side Population' cells in adult mouse testis express Bcrp1 gene and are enriched in spermatogonia and germinal stem cells. Development. 2004;131:479–87. 10.1242/dev.00918 - DOI - PubMed
    1. Umemoto T, Yamato M, Nishida K, Yang J, Tano Y, Okano T. Limbal epithelial side-population cells have stem cell-like properties, including quiescent state. Stem Cells. 2006;24:86–94. 10.1634/stemcells.2005-0064 - DOI - PubMed

MeSH terms

Substances

LinkOut - more resources