. 2017 Apr 4;19(1):175-187.
doi: 10.1016/j.celrep.2017.03.024.

Necroptosis Execution Is Mediated by Plasma Membrane Nanopores Independent of Calcium

Affiliations

Necroptosis Execution Is Mediated by Plasma Membrane Nanopores Independent of Calcium

Uris Ros et al. Cell Rep. .

Abstract

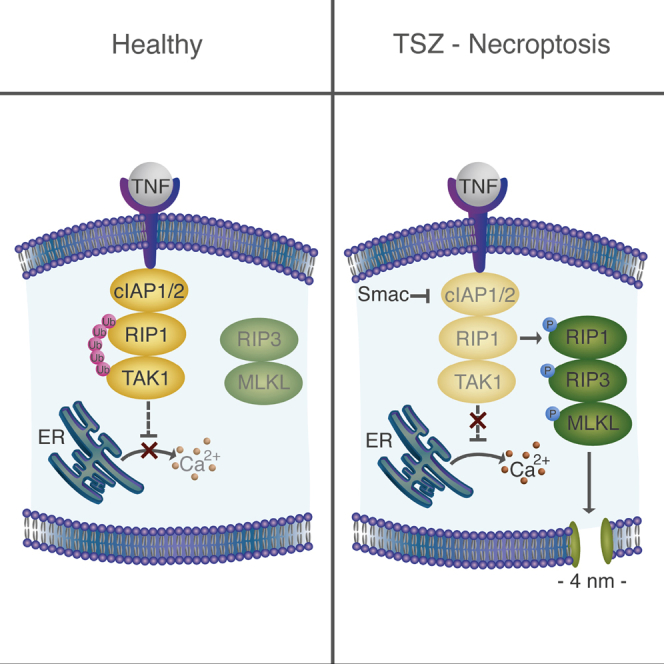
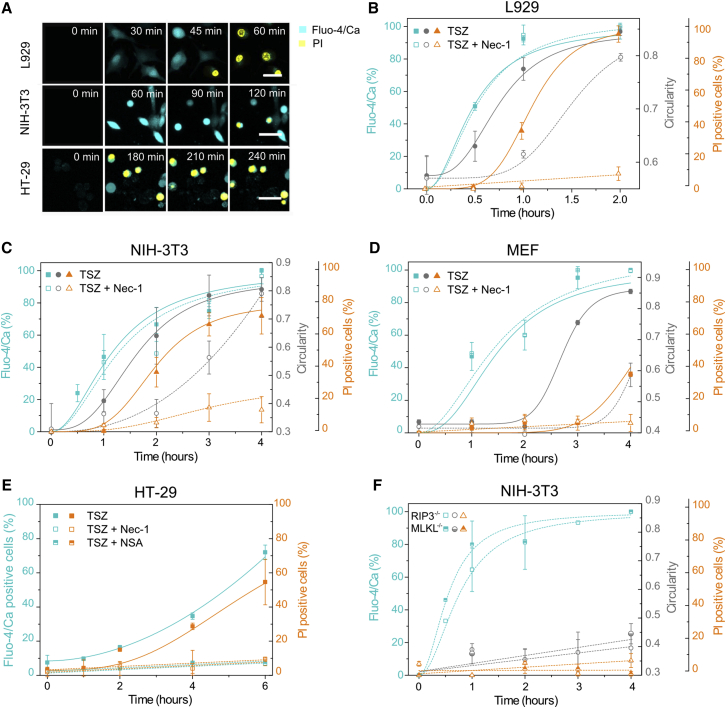
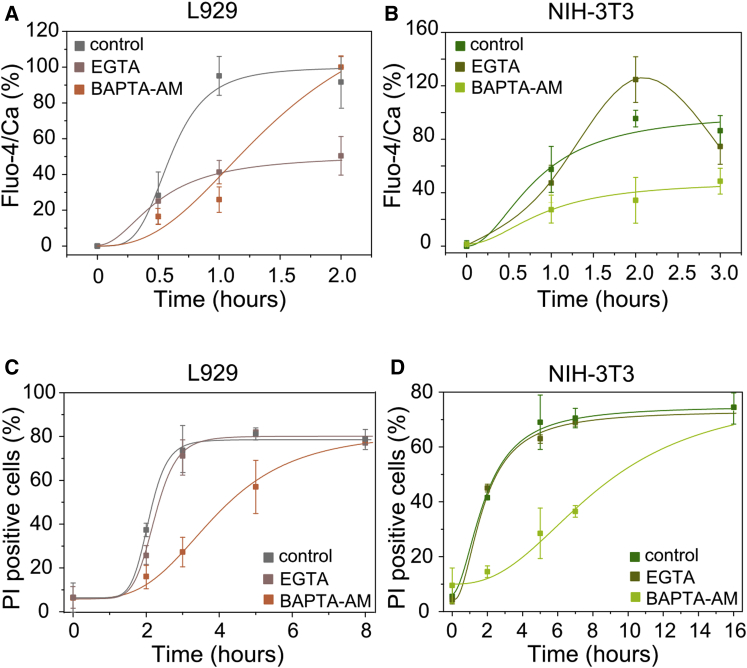
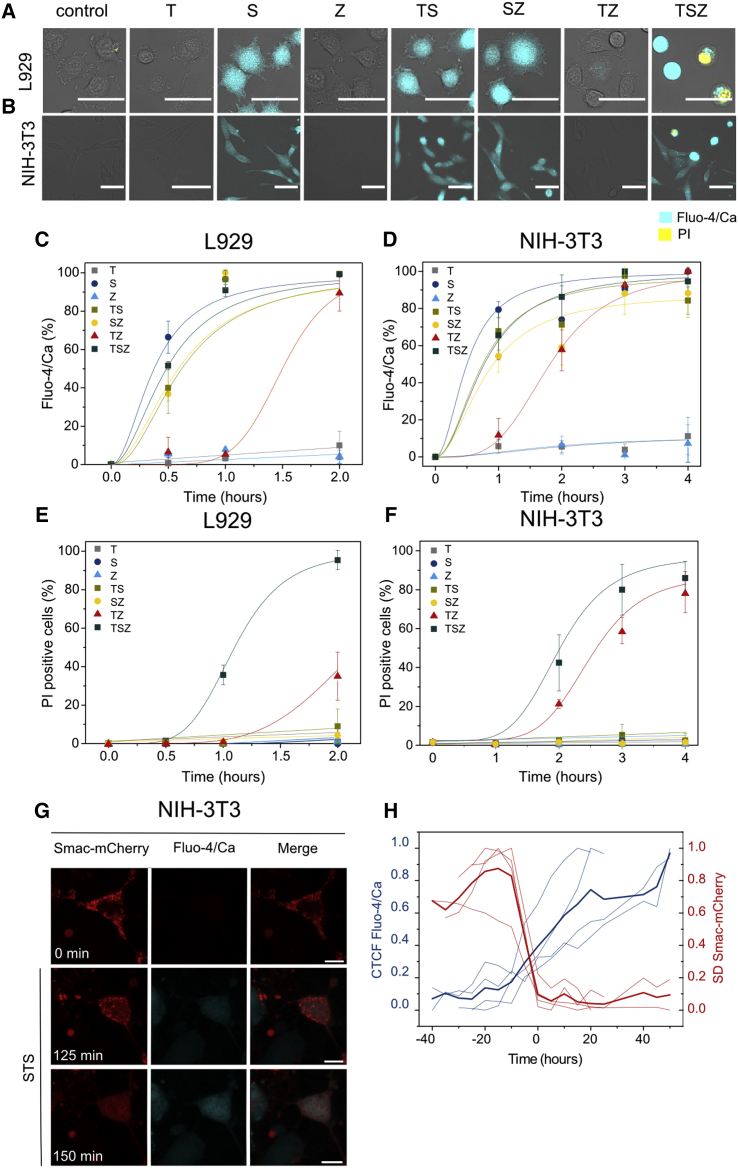
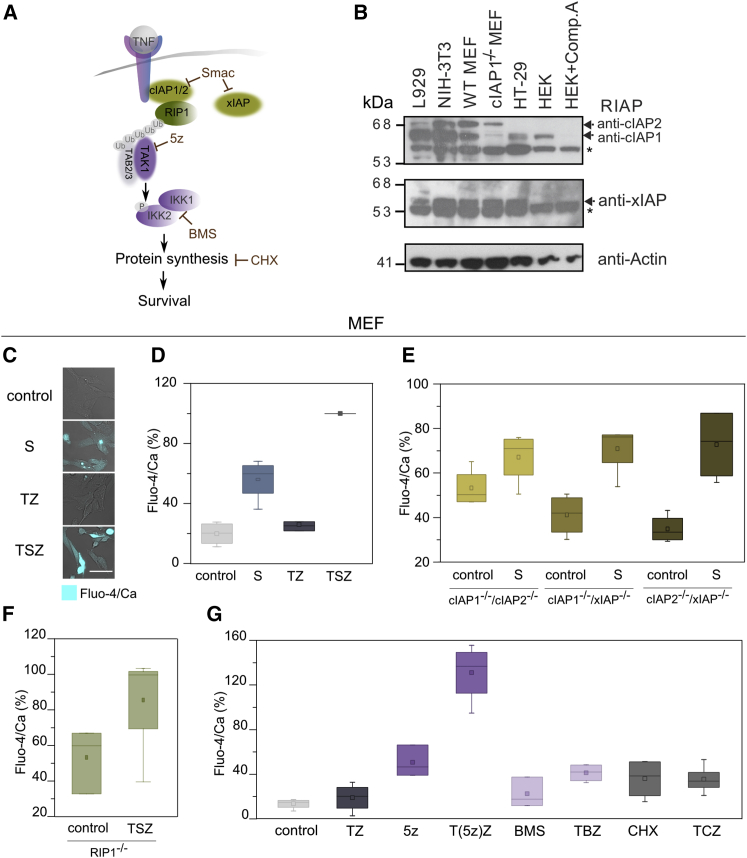
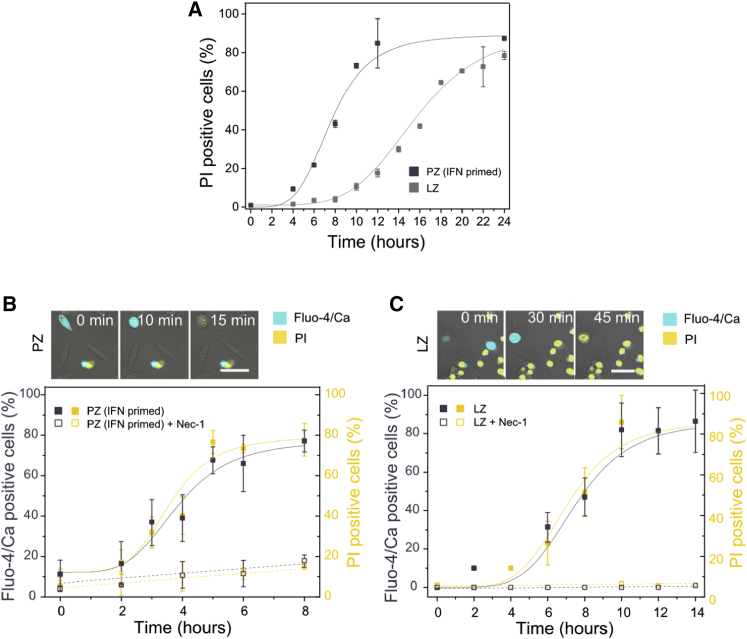
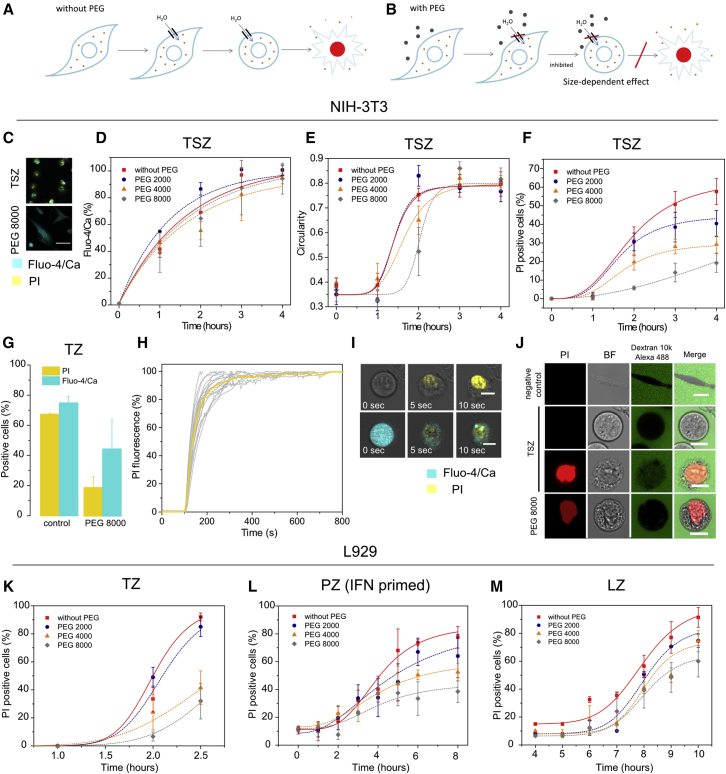
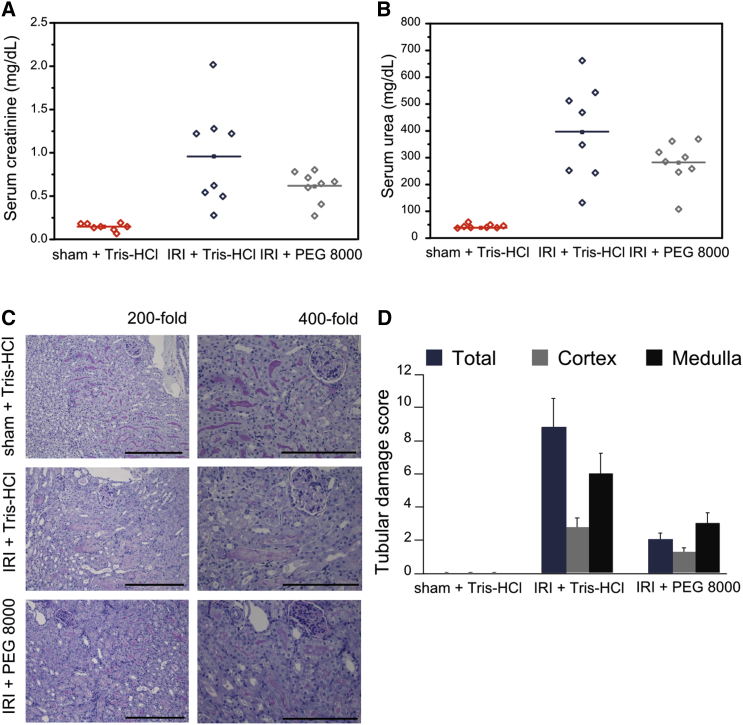
Necroptosis is a form of regulated necrosis that results in cell death and content release after plasma membrane permeabilization. However, little is known about the molecular events responsible for the disruption of the plasma membrane. Here, we find that early increase in cytosolic calcium in TNF-induced necroptosis is mediated by treatment with a Smac mimetic via the TNF/RIP1/TAK1 survival pathway. This does not require the activation of the necrosome and is dispensable for necroptosis. Necroptosis induced by the activation of TLR3/4 pathways does not trigger early calcium flux. We also demonstrate that necroptotic plasma membrane rupture is mediated by osmotic forces and membrane pores around 4 nm in diameter. This late permeabilization step represents a hallmark in necroptosis execution that is cell and treatment independent and requires the RIP1/RIP3/MLKL core. In support of this, treatment with osmoprotectants reduces cell damage in an in vivo necroptosis model of ischemia-reperfusion injury.

Keywords: Smac mimetics; TNF; calcium signaling; membrane pores; necroptosis.


Figures

None
Graphical abstract
Figure 1
Figure 1
Early Calcium Flux and PI Intake Are Independent Events in Necroptosis (A) Time series of calcium and PI intake during TSZ-induced necroptosis. Scale bar, 50 μm. Pictures are representative of at least three independent experiments. (B–D) Kinetics of calcium flux, change in cell shape, and PI intake in mouse fibroblasts. (E) Kinetics of calcium flux and PI intake in HT-29 cells. (F) Effect of RIP3 or MLKL deletion in NIH 3T3 knockout cells. Cyan, y axis: Fluo-4/Ca fluorescence intensity per cell; gray, y axis: circularity absolute value; orange, y axis: PI-positive cells. The x axis is common for all parameters plotted in the y axis. The values represent the mean and the SD of at least three independent experiments. Error bars represent the SD from the measurements. Lines correspond to the best fitting of the data. See also Figure S1.
Figure 2
Figure 2
Intracellular and Extracellular Calcium Have Different Effects in TSZ-Induced Necroptosis (A and B) Effect of EGTA and BAPTA-AM in the kinetics of increase of the intracellular calcium. (C and D) Kinetics of membrane breakdown in the presence of EGTA or BAPTA-AM. The values represent the mean and the SD of at least three independent experiments. Error bars represent the SD from the measurements. Lines correspond to the best fitting of the data. See also Figure S2.
Figure 3
Figure 3
Early Calcium Flux in L929 and NIH 3T3 Cells Is a Consequence of Smac Mimetic Treatment (A and B) Calcium signal upon different treatments (T, TNF-α; S, Smac mimetic; Z, zVAD; TS, TNF-α + Smac; SZ, Smac + zVAD; TZ, TNF-α + zVAD; TSZ, TNF-α + Smac + zVAD). Images were taken after 1 hr of treatment. Scale bar, 50 μm. (C and D) Kinetics of calcium flux. (E and F) Kinetics of PI intake. (G) Time-series images of the increase in the cytosolic calcium after mitochondria permeabilization upon STS treatment. Scale bar, 10 μm. (H) Corrected total cell fluorescence (CTCF) of Fluo-4/Ca in individual cells versus the SD (SD) of the fluorescence intensity of Smac1-60-mCherry (n = 4). Time 0 corresponds to the normalized time when both events cross in each cell. Darker lines represent the average of the individual cells. In (C)–(F), values represent the mean value and SD of at least three independent experiments. Error bars represent the SD from the measurements. Lines correspond to the best fitting of the data. Images are representative of three independent experiments. See also Figure S3.
Figure 4
Figure 4
Early Calcium Signal Is Activated upon Inhibition of IAP Function and Involves the TNF-α Survival Pathway (A) General representation of the role of Smac as inhibitor of IAPs and its link with the TNF-α-mediated NF-κB survival pathway. cIAP1/2 ubiquitinate RIP1, and its ubiquitinated chain acts as scaffolds to recruit others molecules such as TAK1 that activates the IKK1/2 complex by phosphorylation of IKK2. 5Z-7-oxozeaenol (5z) is an inhibitor of TAK1. BMS-345541 (BMS) is an inhibitor of the catalytic subunits of IKK1/2. Cycloheximide (CHX) is an inhibitor of protein synthesis. (B) Expression of different IAPs in L929, NIH 3T3, MEF, and HT-29 cells. The RIAP antibody recognizes cIAP1/2. Controls consist of the cIAP1 knock out MEF, HEK cells treated with compound A (911) that strongly reduces cIAP1 levels but not cIAP2. Asterisks indicate non-specific bands. (C) Representative images of calcium flux in MEF upon different treatments (S, Smac mimetic; TZ, TNF-α + zVAD; TSZ, TNF-α + Smac + zVAD). Scale bar, 50 μm. (D) Percentage of Fluo-4/Ca fluorescence signal in MEF after 2 hr of treatment with the compounds referred to. (E) Effect of IAPs deletion on Fluo-4/Ca fluorescence signal after 2 hr treatment with Smac. (F) Effect of RIP1 deletion on Fluo-4/Ca fluorescence after 2 hr treatment with TSZ. (G) Fluo-4/Ca signal in MEF after 2 hr of treatment with other TNF-α sensitizers (5z, 5Z-7-oxozeaenol; T(5z)Z, TNF-α + 5Z-7-oxozeaenol + zVAD; BMS, BMS-345541; TBS, TNF-α + BMS + zVAD; CHX, cycloheximide; TCZ, TNF-α + cycloheximide + zVAD). Error bars represent the SD from the measurements. See also Figure S4.
Figure 5
Figure 5
Early Calcium Flux Is Not Activated in TLR-3/4-Induced Necroptosis in L929 Cells (A) Kinetics of PI intake after treatment with poly (I:C) (P) or LPS (L) in the presence of zVAD (Z). Cells were primed with IFN-γ 24 hr before PZ treatment. (B and C) Kinetics of late calcium flux and PI intake after activation of (B) TLR3 (PZ treatment) or (C) TLR4 (LZ treatment). Top: time series of change in shape, calcium flux, and PI intake during TLR3 (B) or TLR4 (C)-induced necroptosis. Scale bar, 50 μm. Purple, y axis: Fluo-4/Ca fluorescence intensity; yellow, y axis: PI-positive cells. The x axis is common for all parameters plotted. The values represent the mean and the SD of at least three independent experiments. Error bars represent the SD from the measurements. Lines correspond to the best fitting of the data. See also Figure S5.
Figure 6
Figure 6
PI Intake but Not Early Calcium Signal Is Mediated by Membrane Pores (A) Impermeant intracellular molecules impose an osmotic gradient after pore opening that leads to net influx of water molecules and cell lysis. (B) PEGs can prevent this effect if their size is large enough to not cross the membrane through the pores. (C) Calcium flux and PI intake in NIH 3T3 cells treated with TSZ in the presence or absence of PEG 8000. Scale bar, 50 μm. (D) Kinetics of calcium flux, (E and F) Change in cell shape (E) and PI intake (F) in NIH 3T3 cells in the presence of PEGs of different sizes. (G) PI and Fluo-4/Ca-positive NIH 3T3 cells after TZ induction in the presence or not of PEG 8000. (H) Kinetics of PI intake in individual NIH 3T3 cells. 20 individual cells were selected, and the fluorescence intensity of the PI was recorded every 5 s. Values were normalized taking as 100% the maximum of the fluorescence obtained per cell. (I) Time lapse of PI intake, calcium flux, and membrane breakdown. Scale bar, 10 μm. (J) FD10 influx in NIH 3T3 cells after treatment with TSZ. First-line scale bar, 20 μm, second-, third-, and fourth-line scale bars, 10 μm. (K–M) Kinetics of PI influx in L929 cells treated with (K) TZ, (L) PZ (IFN primed), or (M) LZ in the presence or not of PEGs. Results show the mean and the SD from at least three independent experiments. Error bars represent SD from the measurements. Lines correspond to the best fitting of the data.
Figure 7
Figure 7
PEG 8000 Provides Osmotic Protection against the Necroptosis In Vivo Model IRI (A and B) Corresponding serum concentrations of creatinine (A) and urea (B) 48 hr after reperfusion or sham operation (n = 8 per group, mean values, p ≤ 0.14. p values were determined by a Student’s t test). 100 μL vehicle (Tris-HCl [pH 8.0]) or 100 μL 100 mM PEG 8000 (in Tris-HCl [pH 8.0]) was applied intraperitoneally 15 min before the onset of ischemia and additionally 1, 3, and 5 hr post-ischemia in a final volume of 250 μL, respectively. (C) Representative renal sections stained with periodic acid-Schiff are shown at magnifications of 200- and 400-fold as indicated 48 hr following reperfusion or sham operation. PEG-8000-treated animals show abundant tubular epithelial vacuolization without other damage signs. Scale bars, 0.3 (for 200-fold) and 0.2 (for 400-fold) mm, respectively. (D) Quantification by renal damage score of (C). Error bars represent the SD from the measurements. See also Figure S6.

References

    1. Blériot C., Lecuit M. The interplay between regulated necrosis and bacterial infection. Cell. Mol. Life Sci. 2016;73:2369–2378. - PMC - PubMed
    1. Bowman A.M., Nesin O.M., Pakhomova O.N., Pakhomov A.G. Analysis of plasma membrane integrity by fluorescent detection of Tl(+) uptake. J. Membr. Biol. 2010;236:15–26. - PMC - PubMed
    1. Cai Z., Jitkaew S., Zhao J., Chiang H.C., Choksi S., Liu J., Ward Y., Wu L.G., Liu Z.G. Plasma membrane translocation of trimerized MLKL protein is required for TNF-induced necroptosis. Nat. Cell Biol. 2014;16:55–65. - PMC - PubMed
    1. Chen X., He W.T., Hu L., Li J., Fang Y., Wang X., Xu X., Wang Z., Huang K., Han J. Pyroptosis is driven by non-selective gasdermin-D pore and its morphology is different from MLKL channel-mediated necroptosis. Cell Res. 2016;26:1007–1020. - PMC - PubMed
    1. Conze D.B., Albert L., Ferrick D.A., Goeddel D.V., Yeh W.C., Mak T., Ashwell J.D. Posttranscriptional downregulation of c-IAP2 by the ubiquitin protein ligase c-IAP1 in vivo. Mol. Cell. Biol. 2005;25:3348–3356. - PMC - PubMed

MeSH terms

LinkOut - more resources