. 2017 Apr 4;25(4):811-822.e4.
doi: 10.1016/j.cmet.2017.03.002.

Mitochondrial Patch Clamp of Beige Adipocytes Reveals UCP1-Positive and UCP1-Negative Cells Both Exhibiting Futile Creatine Cycling

Affiliations

Mitochondrial Patch Clamp of Beige Adipocytes Reveals UCP1-Positive and UCP1-Negative Cells Both Exhibiting Futile Creatine Cycling

Ambre M Bertholet et al. Cell Metab. .

Abstract

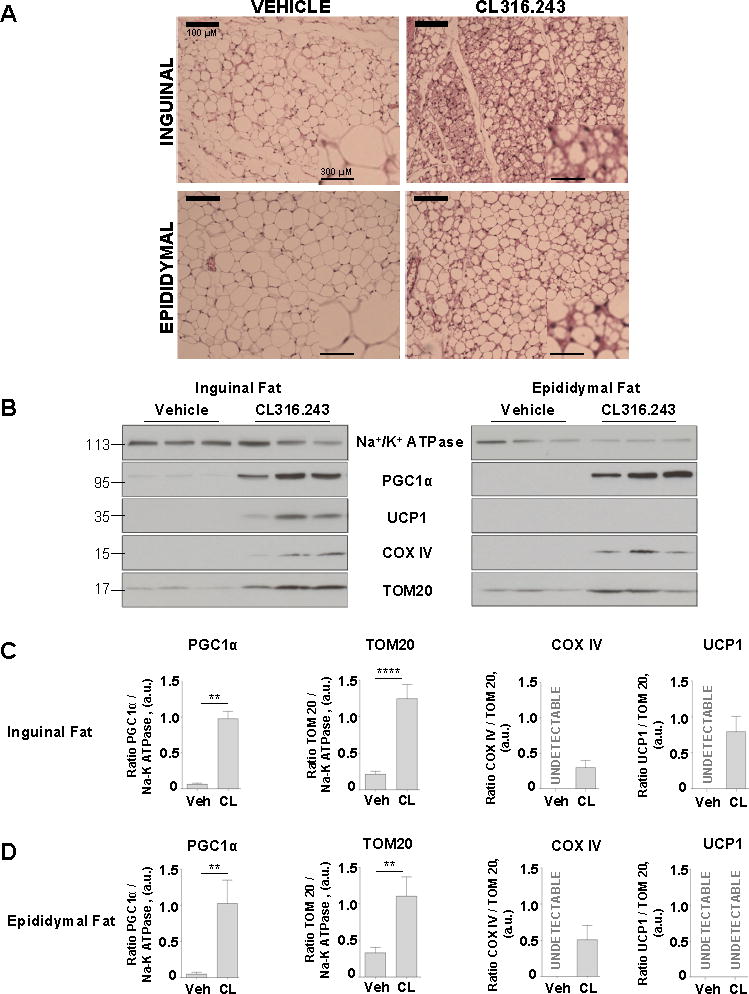
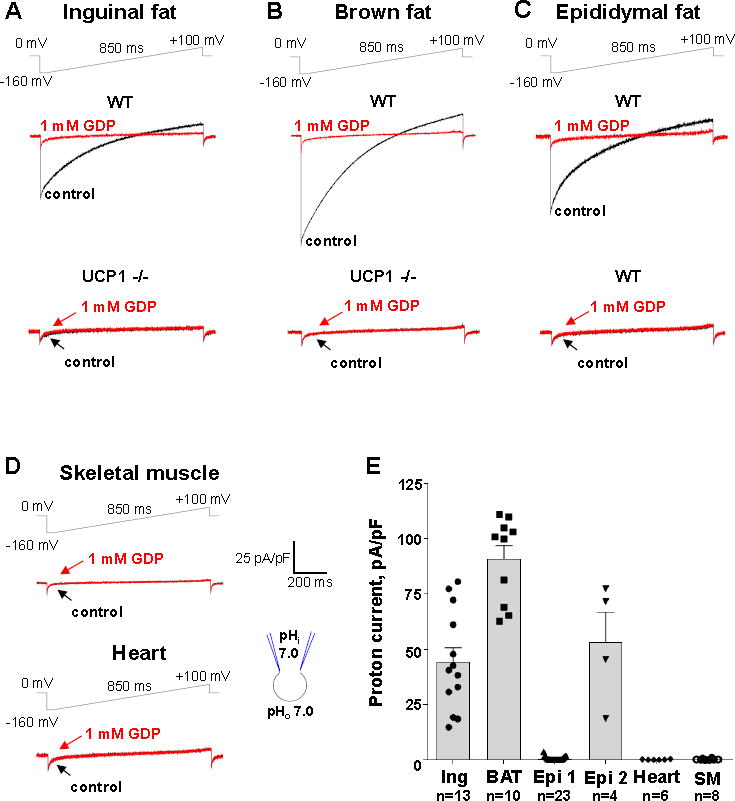
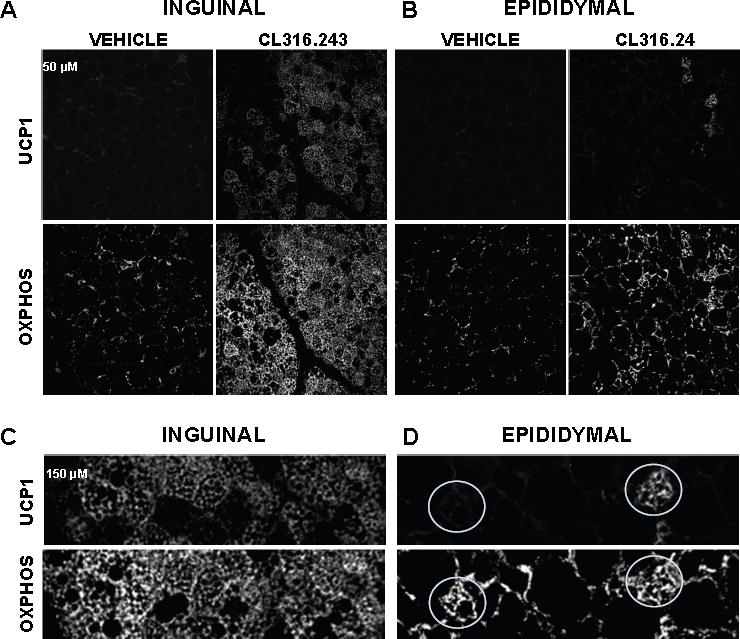
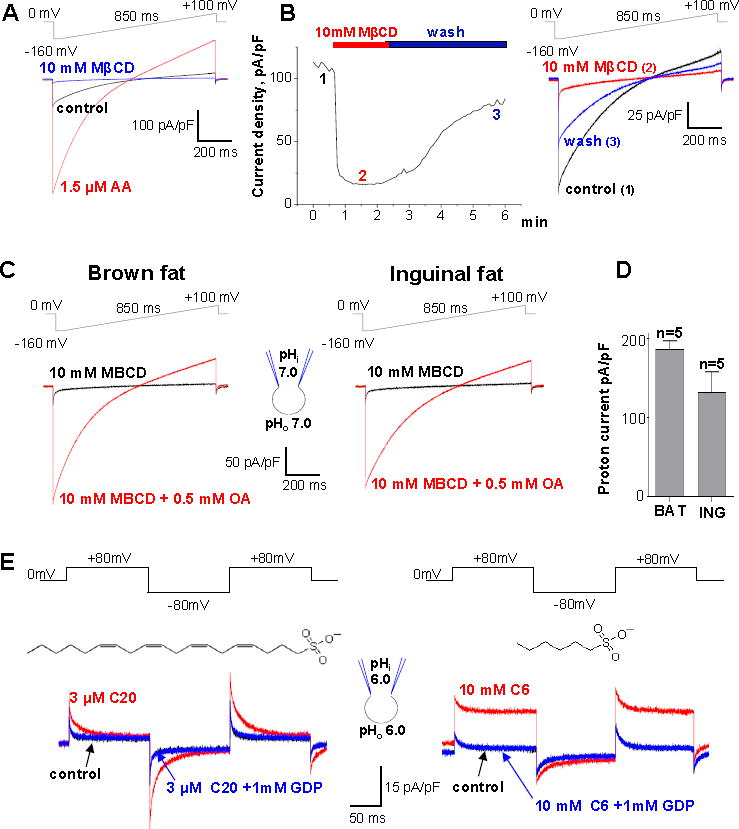
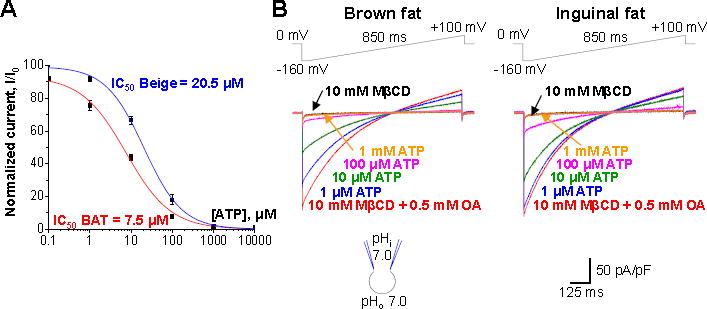
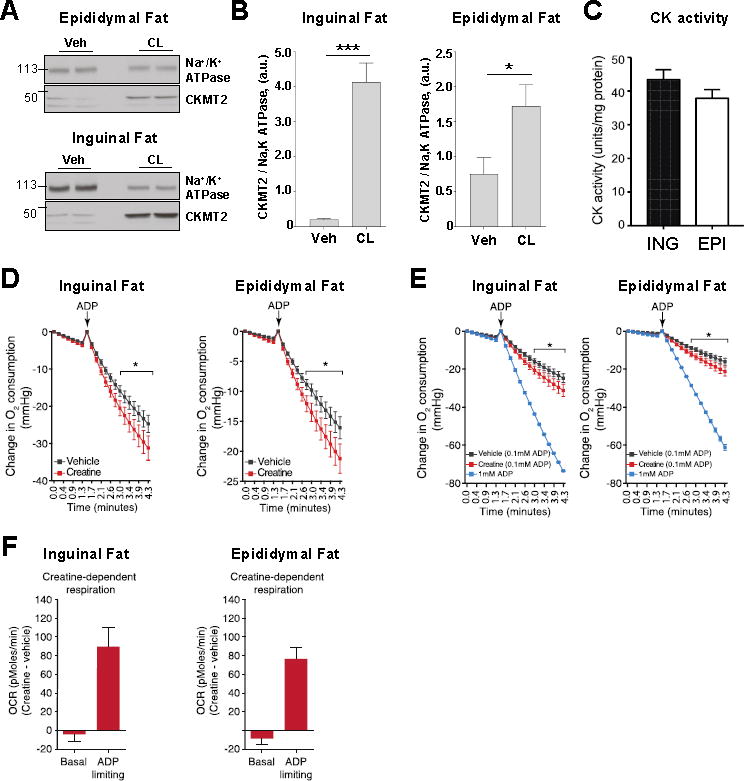
Cold and other environmental factors induce "browning" of white fat depots-development of beige adipocytes with morphological and functional resemblance to brown fat. Similar to brown fat, beige adipocytes are assumed to express mitochondrial uncoupling protein 1 (UCP1) and are thermogenic due to the UCP1-mediated H+ leak across the inner mitochondrial membrane. However, this assumption has never been tested directly. Herein we patch clamped the inner mitochondrial membrane of beige and brown fat to provide a direct comparison of their thermogenic H+ leak (IH). All inguinal beige adipocytes had robust UCP1-dependent IH comparable to brown fat, but it was about three times less sensitive to purine nucleotide inhibition. Strikingly, only ∼15% of epididymal beige adipocytes had IH, while in the rest UCP1-dependent IH was undetectable. Despite the absence of UCP1 in the majority of epididymal beige adipocytes, these cells employ prominent creatine cycling as a UCP1-independent thermogenic mechanism.


Figures

Figure 1
Figure 1. Browning of inguinal and epididymal fat depots upon chronic β3-adrenergic receptor stimulation
(A) Representative inguinal and epididymal fat sections of mice treated with vehicle or CL316.243 compound were stained with hematoxylin and eosin; scale bar, 100 μm. A magnified view is shown on the right corner of each picture, scale bar, 300 μm. (B) Representative immunoblots showing the effect of β3-adrenergic receptor stimulation on the protein levels of Na+/K+ ATPase, PGC1α, UCP1 and COXIV in inguinal fat (left) and epididymal fat (right). See also Figures S1 and S2. (C and D) PGC1α, TOM20, COX IV and UCP1 protein levels in inguinal and epididymal fat, based on the data presented in (B). Data shown as mean ± SEM, n = 5–9. See also Figures S1 and S2.
Figure 2
Figure 2. Mitochondrial IH in beige adipocytes of inguinal and epididymal fat as compared to other tissues
(A) Representative IH recorded from inguinal beige fat mitoplasts isolated from WT (upper panel) and UCP1−/− mice (lower panel). IH traces are shown before (control, black) and after (red) the addition of 1 mM GDP to the bath solution. The voltage protocol is indicated at the top. (B) Representative IH recorded from brown fat mitoplasts isolated from WT (upper panel) and UCP1−/− mice (lower panel). IH traces are shown before (control, black) and after (red) the addition of 1 mM GDP to the bath solution. (C) Representative IH recorded from two distinct types of epididymal beige fat mitoplasts isolated from WT mice: UCP1-positive (upper panel) and UCP1-negative (lower panel). IH traces are shown before (control, red) and after (black) the addition of 1 mM GDP to the bath solution. (D) Representative IH recorded from mitoplasts isolated from skeletal muscle (upper panel) and heart (lower panel). IH traces are shown before (control, black) and after (red) the addition of 1 mM GDP to the bath solution. (E) Bar graph showing average IH current density in inguinal beige fat (Ing), brown fat (BAT), heart, skeletal muscle (SM), and two distinct types of beige adipocyte from epididymal beige fat (UCP1 negative (Epi1) and positive (Epi2)). Data shown as mean ± SEM. See also Figure S3.
Figure 3
Figure 3. Mitochondrial biogenesis and UCP1 expression in inguinal and epididymal depots after chronic β3-adrenergic stimulation
(A and B) Confocal micrographs of inguinal fat and epididymal fat of mice treated with vehicle or CL and immunolabeled with UCP1 (upper panels) and with respiratory chain complex antibodies (MitoProfile® Total OXPHOS, lower panels); scale bar, 50 μm). See also Figures S4 and S5. (C and D) Magnified views of the areas within the white rectangles from panels A and B. Representative UCP1-positive (right) and UCP1-negative (left) beige adipocytes of epididymal fat are shown by white circles.
Figure 4
Figure 4. FA dependence of beige fat UCP1
(A) IH (control, red) is de-activated by 10 mM MβCD and re-activated by 1.5 μM arachidonic acid (AA, blue). The voltage protocol is indicated at the top. (B) Left panel: Representative time course of IH amplitude in control (1), and upon the application (2) and subsequent washout (3) of 10 mM MβCD at pH 8.0. Right panel: IH traces recorded at times 1, 2, and 3 as indicated in the left panel. (C) Representative IH upon extraction of endogenous LCFAs with 10 mM MβCD (black) and after application of 0.5 mM OA mixed with 10 mM MβCD (red). The experiment was performed in brown fat (left panel) and inguinal beige fat (right panel). (D) Bar graph showing average IH current density in inguinal beige fat (ING), and brown fat (BAT) based on the experiments shown in (C). Data shown as mean ± SEM. (E) Representative IH recorded after the extraction of endogenous membrane FA with 10mM MβCD (control, black), after subsequent application of the indicated concentration of Cn-sulfonate (red), and upon adding 1 mM GDP (blue), at symmetrical pH 6.0. The structure of the activating Cn-sulfonate is shown near the currents induced: arachidonyl sulfonate (C20, left panel) and hexanesulfonate (C6, right panel). See also Figure S7.
Figure 5
Figure 5. Inhibition of UCP1 by purine nucleotides in brown and beige fat
(A) The dose-dependence of IH inhibition by ATP4− in brown (red) and beige fat (blue). Current amplitudes were measured upon stepping from 0 to −160 mV, see (B). (B) Representative IH traces in various concentrations of ATP4− on the cytosolic face of the IMM. Brown (left panel) and beige (right panel) are shown. IH was activated with 0.5 mM oleic acid (OA) mixed with 10 mM MβCD.
Figure 6
Figure 6. Distinct OXPHOS profiles of brown and beige fat mitochondria
(A and B) Representative immunoblots showing protein levels of five mitochondrial respiratory protein complexes: NDUFB8 (Complex I, CI), SDHA (Complex II, CII), Core 2 subunit (Complex III, CIII), CIV-I subunit (Complex IV, CIV) and ATP5 subunit alpha (Complex V, CV) along with the loading control (TOM20) in mitochondria of beige (A) and brown (B) fat. (C) Histograms representing the protein levels of ATP synthase relative to the levels of complex II (left panel) and complex IV (right panel), based on the data presented in (A) and (B). Data shown as mean ± SEM, n = 5.
Figure 7
Figure 7. Creatine stimulates respiration in inguinal and epididymal beige fat mitochondria
(A) Representative immunoblots showing the effect of β3-adrenergic receptor stimulation on the protein level of Na+/K+ ATPase and CKMT2 in epididymal fat (upper panel) and inguinal fat (lower panel). See also Figure S6. (B) Histograms representing the protein level of CKMT2 relative to the level of Na+/K+ ATPase in inguinal fat (left panel) and epididymal fat (right panel). Data shown as mean ± SEM, n = 4. (C) CK activity of inguinal fat (ING) and epididymal fat (EPI) mitochondria after β3-adrenergic receptor stimulation. Data shown as mean ± SEM, n = 6. (D) Oxygen consumption by inguinal fat (left panel) and epididymal fat (right panel) mitochondria following treatment with vehicle or creatine (0.01 mM). Traces exhibit oxygen consumption of mitochondria during State 4 and following the addition of a limiting amount of ADP (0.1 mM). Data shown as mean ± SEM, n = 7 separate mitochondrial preparations for inguinal and epididymal fat. (E) The vehicle-and creatine-dependent oxygen consumption traces under ADP-limiting (0.1 mM) conditions are the same as those shown in Figure 7D, and are compared to the oxygen consumption traces following addition of saturating amounts of ADP (1mM). Data shown as mean ± SEM, n = 7 separate mitochondrial preparations for inguinal and epididymal fat under ADP-limiting conditions. ADP saturating rates were obtained from two separate mitochondrial preparations. (F) Creatine dependent basal and ADP-limiting oxygen consumption rate (OCR) in inguinal and epididymal beige fat mitochondria. The OCR of vehicle-treated beige fat mitochondria was subtracted from creatine-treated beige organelles. Data shown as mean ± SEM, n = 7 mitochondrial preparations for inguinal (left panel) and epididymal (right panel) adipose each. These data were obtained from the raw O2 traces shown in Figure 7D.

Comment in

References

    1. Bertholet AM, Kirichok Y. UCP1: A transporter for H+ and fatty acid anions. Biochimie. 2017;134:28–34. - PMC - PubMed
    1. Betz MJ, Enerbäck S. Human Brown Adipose Tissue: What We Have Learned So Far. Diabetes. 2015;64:2352–2360. - PubMed
    1. Borecky J, Jezek P, Siemen D. 108-pS channel in brown fat mitochondria might Be identical to the inner membrane anion channel. J Biol Chem. 1997;272:19282–19289. - PubMed
    1. Cannon B, Nedergaard J. Brown adipose tissue: function and physiological significance. Physiol Rev. 2004;84:277–359. - PubMed
    1. Chouchani ET, Kazak L, Jedrychowski MP, Lu GZ, Erickson BK, Szpyt J, Pierce KA, Laznik-Bogoslavski D, Vetrivelan R, Clish CB, et al. Mitochondrial ROS regulate thermogenic energy expenditure and sulfenylation of UCP1. Nature. 2016;532:112–116. - PMC - PubMed

MeSH terms

LinkOut - more resources