. 2017 Apr 4;25(4):838-855.e15.
doi: 10.1016/j.cmet.2017.03.003.

SIRT4 Is a Lysine Deacylase that Controls Leucine Metabolism and Insulin Secretion

Affiliations

SIRT4 Is a Lysine Deacylase that Controls Leucine Metabolism and Insulin Secretion

Kristin A Anderson et al. Cell Metab. .

Abstract

Sirtuins are NAD+-dependent protein deacylases that regulate several aspects of metabolism and aging. In contrast to the other mammalian sirtuins, the primary enzymatic activity of mitochondrial sirtuin 4 (SIRT4) and its overall role in metabolic control have remained enigmatic. Using a combination of phylogenetics, structural biology, and enzymology, we show that SIRT4 removes three acyl moieties from lysine residues: methylglutaryl (MG)-, hydroxymethylglutaryl (HMG)-, and 3-methylglutaconyl (MGc)-lysine. The metabolites leading to these post-translational modifications are intermediates in leucine oxidation, and we show a primary role for SIRT4 in controlling this pathway in mice. Furthermore, we find that dysregulated leucine metabolism in SIRT4KO mice leads to elevated basal and stimulated insulin secretion, which progressively develops into glucose intolerance and insulin resistance. These findings identify a robust enzymatic activity for SIRT4, uncover a mechanism controlling branched-chain amino acid flux, and position SIRT4 as a crucial player maintaining insulin secretion and glucose homeostasis during aging.

Keywords: branched-chain amino acids; deacylase; insulin secretion; leucine; mitochondria; sirtuin 4.


Figures

Figure 1
Figure 1. Phylogenetic and Evolutionary Analyses of SIRT4 (See also Figure S1)
(A) Primary sequence analyses and alignment of the three mitochondrial sirtuins SIRT3, SIRT4, and SIRT5 showing locations of amino acids important for mitochondrial localization, NAD+ binding, catalysis, substrate specificity, and Zn2+ binding. (B) Secondary structure analyses of the three mitochondrial sirtuins aligned with (A), showing predicted α-helices (above the axis) and β-sheets (below the axis). (C) Unrooted phylogenetic tree of species containing sirtuin-like genes, showing class I–IV groupings and the corresponding mammalian sirtuins; scale: 0.9 substitutions/site. (D) Regions of conserved (: and .) and identical (*) amino acids within the primary sequence of select class II sirtuins; z-score heatmap (−2.0 to 2.0) of specificity determining position (SDP) scores. (E) Same conserved sequence from (D) compared to other sirtuin classes; (−) non-conserved amino acids. (F) α-helical wheel prediction of conserved region in class I, II, and III sirtuins; ‘P’ indicates proline at start of helix, cyan indicates highly conserved amino acids from (D), and other conserved amino acids within the same region of SIRT3 and SIRT5.
Figure 2
Figure 2. Structural and Modeling Studies on SIRT4 (See also Figure S2)
(A) Structural homology model of human SIRT4; NAD+ (black), catalytic H161 (magenta), zinc-binding cysteines (orange), conserved α-helix (cyan), lysine (green) with substrate (red); HMG-lysine shown as a prototypical substrate. (B) Enlarged view of catalytic pocket of SIRT4. (C) Heat map of energy minimization z-scores (−2.0—2.0) in the SIRT4 catalytic pocket of strong (red) and weak (blue) putative substrates.
Figure 3
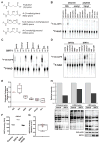
Figure 3. SIRT4 is a Lysine Deacylase (See also Figure S3)
(A) Structures of acyl-lysines removed by SIRT4. (B) SIRT4 activity assay using uncleaved (GST) or cleaved recombinant mouse SIRT4 or catalytically inactive SIRT4HY, targeting methylglutarylated BSA, acetylated BSA or a lipoyl-lysine peptide; lower spot, 32P-NAD+; upper spot, 32P-O-acyl-ADP-ribose (OAADPR). (C) Same assay from (B) using SIRT4 against a range of acylated BSA or peptide substrates. (D) Same assay from (B) using SIRT3 or SIRT5 against a range of acylated BSA or peptide substrates. (E) Profiling SIRT4 activity using AMC-labeled peptide substrates in a fluorogenic assay; results shown are from four independent experiments. (F) A representative experiment of SIRT4 incubated with AMC-labeled methylglutarylated peptide substrate with or without 4 mM nicotinamide; control contains no enzyme. Each column represents the mean +/− standard deviation (N=3). (G) Relative SIRT4FQ mutant enzyme activity compared to wild-type using 50 μM AMC-labeled methylglutarylated peptide substrate in a fluorogenic assay; each data point is derived from an independent experiment. (H) Whole-cell extracts from 293 cells stably over-expressing SIRT4 or a control plasmid were immunoblotted using antibodies against glutaryl-, MG-, or HMG-lysine. Box plots depict the interquartile range with whiskers plotted to the min and max values. The horizontal line within the box is the median value and the “+” is the mean value. ****p<0.0001 by Holm-Sidak post-hoc test.
Figure 4
Figure 4. SIRT4 Ablation Leads to Disrupted MCCC Complex Formation (See also Figure S4)
(A) Schematic representation of enzymes in leucine catabolism. (B) MCCA from wild-type and SIRT4KO liver was immunoprecipitated and immunoblotted using antibodies against MG-lysine and MCCA. Shown is quantification of the MG-lysine signal normalized for total MCCA where n=7/7 WT/SIRT4KO. (C) MCCC activity was measured from wild-type and SIRT4KO liver, n=5/7 WT/SIRT4KO. (D) MCCA was immunoprecipated from SIRT4KO liver and incubated in SIRT4 deacylation reaction buffer with either SIRT4 or SIRT4HY mutant. Deacylation of MCCA was then assessed by immunoblotting using antibodies against MG-lysine and MCCA. (E) Summary table of sites of acylation identified on MCCC by proteomics (PTMs from peptides identified at 1% FDR with site localization probability of greater than 95% are represented by an “X”). PSMs were summed across sites for each PTM type. (F) 1D summary of acylation sites mapped on sub-domains of the MCCC α- and β-subunits, corresponding to colors in panels G–J; sites of acylation are stylized in yellow. (G) Energy minimized mouse homology model of the murine MCCC complex; α-subunits are colored in shades of teal, with one magenta-shaded color-coded α-subunit showing BC, BT, and BCCP domains; β-subunits are colored blue and green. (H) Zoomed view of the location of K677 (yellow) or biotinylated K677 (cyan). (I) Zoomed view of K66 located at the interaction interface between MCCC α-α subunits. (J) Zoomed view the MCCCα BCCP domain, showing acylated Lys residues from (E) highlighted in yellow; amino acids numbers are labeled; binding amino acids are shown in gray and labeled in italics. (K) MCCA from wildtype and SIRT4KO liver was immunoprecipitated and blotted with α-streptavidin, to measure biotinylation, or with α-MCCA (n=7/7 WT/SIRT4KO); Top: summary of quantification of seven pairs of mice; Bottom: representative image. (L) Intact MCCC complex measured by native PAGE and α-MCCCA immunoblotting of hepatic WT and SIRT4KO mouse mitochondrial extracts. (M) Total native proteins from (L) measured by Coomassie staining serving as a loading control. (N) Total MCCCA, SIRT4, and UQCRFS1 (as a control) protein from (L) measured by denaturing SDS-PAGE and immunoblotting with respective antibodies. Box plots depict the interquartile range with whiskers plotted to the min and max values. The horizontal line within the box is the median value and the “+” is the mean value. **p<0.01 by two-tailed Student’s t-test.
Figure 5
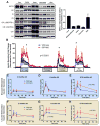
Figure 5. SIRT4 Ablation Reduces Leucine and BCAA Metabolic Flux (See also Figure S5)
(A) Representative trace of α-ketoisocaproate (αKIC) flux measured ex vivo in WT and SIRT4KO mouse liver mitochondria, monitored by NADH fluorescence (excitation 340nm/emission 460nm). (B) Quantification of relative hepatic substrate flux using pyruvate (Pyr), αKIC, α-ketoglutarate (αKG), or glutamate (Glu) as a substrate (n=9/9 WT/SIRT4KO). (C) Representative trace of BCAA flux using αKIC, α-ketoisovalerate (αKIV), or α-ketomethylvalerate (αKMV) measured ex vivo in WT and SIRT4KO mouse liver mitochondria, monitored by NADH fluorescence (n= 2/2 WT/SIRT4KO, excitation 340nm/emission 460nm). (D) Quantified levels and representative blot of phosphorylated BCKDHe1α relative to total levels measured in WT and SIRT4KO mouse liver (n= 3/3 WT/SIRT4KO). (E) Representative trace of αKIC flux measured ex vivo in WT and SIRT4KO mouse cardiac mitochondria, monitored by NADH fluorescence (excitation 340nm/emission 460nm). (F) Quantification of relative cardiac substrate flux using Pyr, αKIC, α-ketoglutarate (αKG), or Glu as a substrate (n=8/8 WT/SIRT4KO). (G–H) Oxygen consumption was assessed in isolated mitochondrial prepared from liver (G) and hearts (H) of WT and SIRT4KO mice. Respiration was assessed in the presence of mitochondria alone (Mi), followed by octanoyl-carnitine/malate (0.2/2mM; Oct/M), ADP (D; 1mM), glutmate (G; 10mM), succinate (S; 10mM) and cytochrome C (0.01mM; Cyt) (n=4/4 WT/SIRT4KO). (I) Respiratory control ratios (RCR) were calculated from respiration in the presence of ADP divided by that with Oct/M (n=4/4 WT/SIRT4KO). Box plots depict the interquartile range with whiskers plotted to the min and max values. The horizontal line within the box is the median value and the “+” is the mean value. *p<0.05, ***p<0.001, ****p<0.0001 by two-tailed Student’s t-test.
Figure 6
Figure 6. SIRT4KO Mice Have Increased Leucine-Stimulated Insulin Secretion (See also Figure S6)
(A) Immunoblot and quantification of SIRT4 expression normalized to 7 different mitochondrial markers: citrate synthase (CS), complex I (CI), complex II (CII), complex III subunit 5, ubiquinol-cytochrome C reductase, Rieske iron-sulfur polypeptide 1 (CIII, UQCRFS1), complex III subunit 2, ubiquinol-cytochrome C reductase core protein II (CIII, UQCRC2), complex IV (CIV), complex V (CV). (B) Pancreatic islets were isolated from 4–5 month old male SIRT4KO mice and then subject to an islet perifusion; 75 islets each from n=8/6 WT/SIRT4KO mice. Islets were washed with Krebs Ringer buffer containing 2.7 mM glucose in between nutrient stimulations. (C–E) Plasma insulin was measured in 2 month old (n=9/11 WT/SIRT4KO), 4 month old (n=6/4), and 8–10 month old (n=11/11) wild-type and SIRT4KO male mice following an oral gavage of 1.5 mg/g glucose. (F–H) Plasma insulin was measured in 2 month old (n=4/7 WT/SIRT4KO), 4 month old (n=15/15), and 8–10 month old (n=11/11) wild-type and SIRT4KO male mice following an oral gavage of 0.3 mg/g leucine. P values less than 0.05 by two-way ANOVA are indicated. Asterisks indicate p<0.05 between wild-type and SIRT4KO by Holm-Sidak post-hoc test.
Figure 7
Figure 7. SIRT4KO Mice Develop Accelerated Age-Induced Disruptions in Glucose Homeostasis
(A–C) Blood glucose was measured in 2 month old (n=9/11 WT/SIRT4KO mice), 4 month old (n=6/4), and 8–10 month old (n=11/11) wild-type and SIRT4KO male mice following an oral gavage of 1.5 mg/g glucose. (D–F) Blood glucose was measured in 2 month old (n=9/5 WT/SIRT4KO, 1 U/kg insulin), 7 month old (n=9/4, 1.2 U/kg insulin), and 11–13 month old (n=13/11, 1.4 U/kg insulin) wild-type and SIRT4KO male mice following an intraperitoneal injection of insulin. (G) Plasma insulin and (H) fasting blood glucose levels were measured in male wild-type and SIRT4KO mice following a 5–6 hour fast (n=4–15 per time point). P values less than 0.05 by two-way ANOVA are indicated. Asterisks indicate p<0.05 between wild-type and SIRT4KO by Holm-Sidak post-hoc test.

Comment in

  • For Certain, SIRT4 Activities!
    Kumar S, Lombard DB. Kumar S, et al. Trends Biochem Sci. 2017 Jul;42(7):499-501. doi: 10.1016/j.tibs.2017.05.008. Epub 2017 Jun 3. Trends Biochem Sci. 2017. PMID: 28587732 Free PMC article.

References

    1. Ahuja N, Schwer B, Carobbio S, Waltregny D, North BJ, Castronovo V, Maechler P, Verdin E. Regulation of insulin secretion by SIRT4, a mitochondrial ADP-ribosyltransferase. J Biol Chem. 2007;282:33583–33592. - PubMed
    1. Allen A, Kwagh J, Fang J, Stanley CA, Smith TJ. Evolution of glutamate dehydrogenase regulation of insulin homeostasis is an example of molecular exaptation. Biochemistry. 2004;43:14431–14443. - PubMed
    1. Anderson KA, Green MF, Huynh FK, Wagner GR, Hirschey MD. SnapShot: Mammalian Sirtuins. Cell. 2014;159:956–956. e951. - PMC - PubMed
    1. Brooks BR, Brooks CL, 3rd, Mackerell AD, Jr, Nilsson L, Petrella RJ, Roux B, Won Y, Archontis G, Bartels C, Boresch S, et al. CHARMM: the biomolecular simulation program. J Comput Chem. 2009;30:1545–1614. - PMC - PubMed
    1. Campbell JE, Ussher JR, Mulvihill EE, Kolic J, Baggio LL, Cao X, Liu Y, Lamont BJ, Morii T, Streutker CJ, et al. TCF1 links GIPR signaling to the control of beta cell function and survival. Nat Med. 2016;22:84–90. - PubMed

MeSH terms