. 2017 Apr 4;25(4):954-960.e6.
doi: 10.1016/j.cmet.2017.03.016.

Using DNA Methylation Profiling to Evaluate Biological Age and Longevity Interventions

Affiliations

Using DNA Methylation Profiling to Evaluate Biological Age and Longevity Interventions

Daniel A Petkovich et al. Cell Metab. .

Abstract

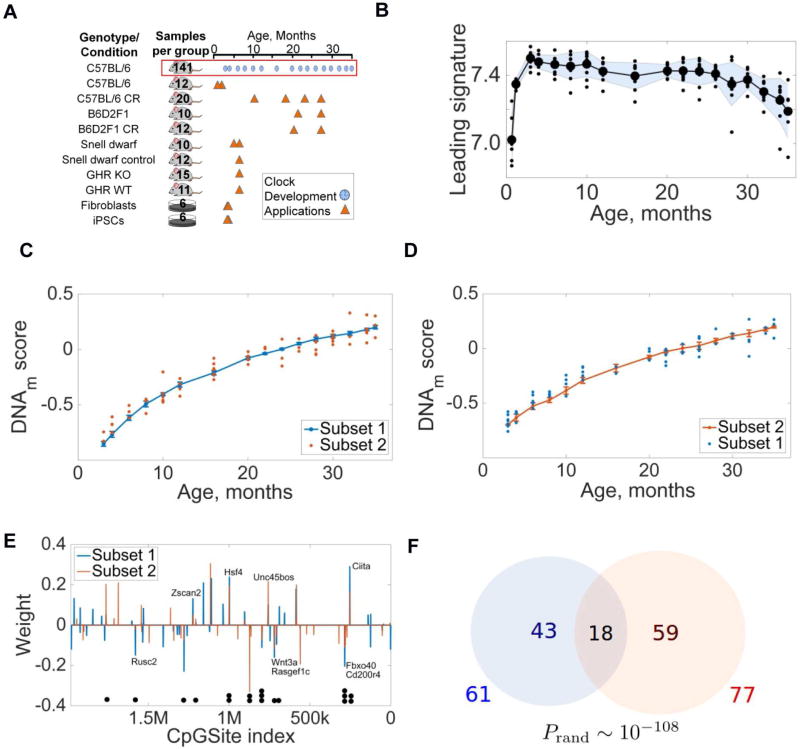
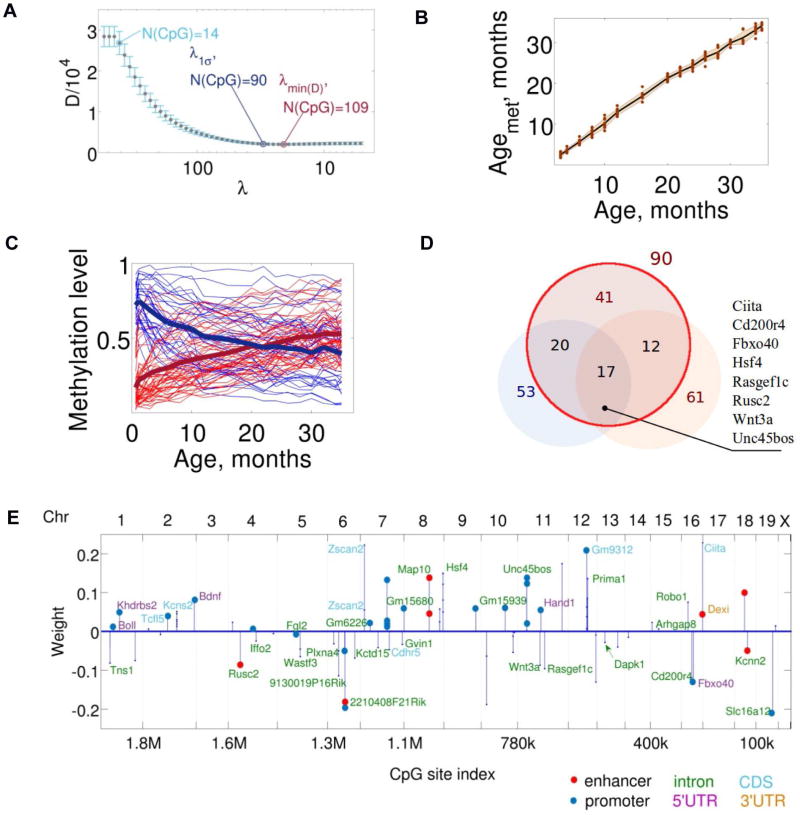
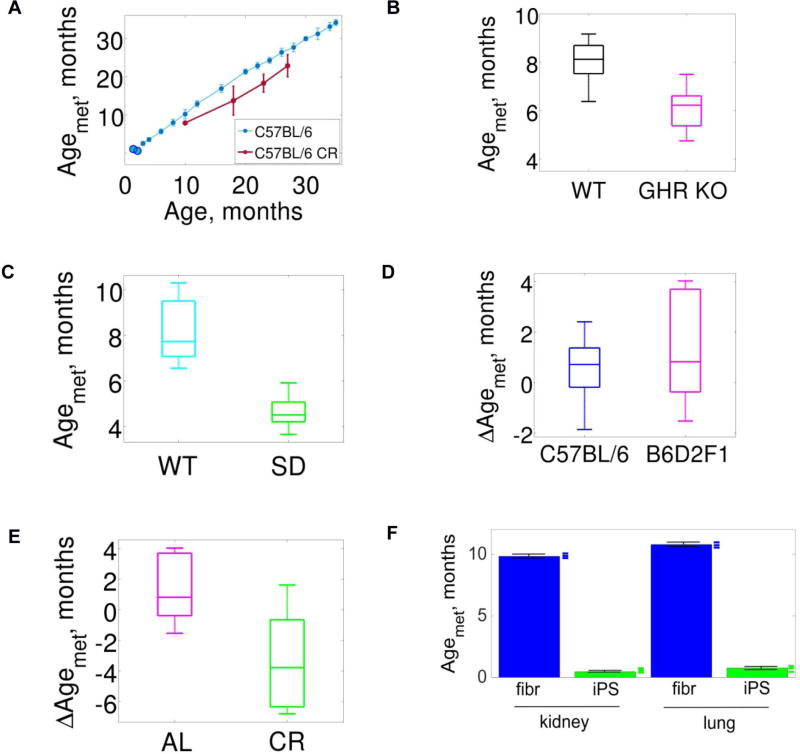
The DNA methylation levels of certain CpG sites are thought to reflect the pace of human aging. Here, we developed a robust predictor of mouse biological age based on 90 CpG sites derived from partial blood DNA methylation profiles. The resulting clock correctly determines the age of mouse cohorts, detects the longevity effects of calorie restriction and gene knockouts, and reports rejuvenation of fibroblast-derived iPSCs. The data show that mammalian DNA methylomes are characterized by CpG sites that may represent the organism's biological age. They are scattered across the genome, they are distinct in human and mouse, and their methylation gradually changes with age. The clock derived from these sites represents a biomarker of aging and can be used to determine the biological age of organisms and evaluate interventions that alter the rate of aging.


Figures

Figure 1
Figure 1. DNA methylation patterns predict the age of mice
(A) Overview of mouse models used in the study. Blue circles show samples used to build the clock, and triangles models analyzed with the clock. Numbers indicate the number of animals or cell cultures for each genotype and cohort; see also Table S1. (B) Behavior of the leading age-dependent DNAm signature for 141 C57BL/6 males with age. (C) Behavior of the Subset 1 clock (blue). Orange dots correspond to samples from Subset 2. Goodness of fit R2 = 0.959, p = 1.16 · 10−49. (D) Behavior of the Subset 2 clock (orange). Blue dots represent samples from Subset 1. Goodness of fit R2 = 0.959, p = 6.26 · 10−49. (E) Weights and genome locations of CpG sites contributing to Subset 1 (blue) and Subset 2 (orange) clocks. Black dots below the graph point to 18 CpG sites common to both clocks. (F) Number of CpG sites contributing to Subset 1 and 2 clocks. The probability to find common 18 sites in two random sets derived from 1.9 million sites is ~10−108.
Figure 2
Figure 2. Development of the mDNAm clock
(A) Selection of the optimally robust mDNAm clock. The clock corresponding to the minimum cross-validation deviation error is a weighted average of DNAm levels of 109 CpG sites. The optimally robust clock is a weighted average of DNAm levels of 90 CpG sites. (B) Estimation of the mDNAm age of C57BL/6 control males. (C) Trajectories of methylation levels of the 90 CpG sites that form the clock. Age-related increases in DNAm are shown in red, and decreases in blue. Solid dark blue and red lines correspond to the signal averaged over the CpG sites with methylation levels decreasing or increasing with age, respectively. (D) The overlap between the CpG sites contributing to the 90-site mDNAm clock (red circle), Subset 1 (lower left) and Subset 2 (lower right) clocks. Gene list on the right shows genes that include 17 CpG sites common to all clocks. (E) Distribution and weights of 90 CpG sites defining the clock along the genome. Positions of the contributing CpG sites within the genome are shown. CpGs were located within the bodies of particular genes, introns and untranslated regions, as well as in intergentic regions. Most mouse chromosomes (except 3, 17, X and Y) contain at least one CpG site contributing to the clock. The color scheme shows the indicated sequence/function elements within which the sites reside.
Figure 3
Figure 3. Applications of the mDNAm clock
(A) Application of the mDNAm clock (light blue) to calorie restricted (CR) C57BL/6 males (red). Light blue blobs not connected to the clock correspond to 20- and 35-day old samples, each cohort including 6 mice (not used to construct the clock). (B) Whole-body growth hormone receptor knockout (GHR KO) and WT ((C57BL/6J × BALB/cByJ)/F2) mice. The chronological age of GHR KO mice was 5.9 ± 0.3 months, and of WT mice 5.9 ± 0.4 months. (C) Snell dwarf (SD) and control (WT; ((DW/J × C3H/HEJ)/F2) mice. The chronological age of both SD and WT mice was 5.9 ± 0.4 months. (D) Comparing mDNAm ages of B6D2F1 and C57BL/6 mice. The differences ΔAgemet between chronological and mDNAm ages were calculated for cohorts of B6D2F1 and C57BL/6 mice. (E) Comparing mDNAm ages of B6D2F1 control (AL) strain and the same calorie restricted (CR) strain. The differences ΔAgemet between chronological and mDNAm ages were calculated for AL and CR cohorts. (F) Mouse lung and kidney fibroblasts and fibroblast-derived iPSCs. Fibroblasts were collected from C57BL/6 mice and grown in culture. iPSCs were then generated from them. Blue and green marks on the right of the bars represent individual samples.

References

    1. Antoulas A, Sorensen D. Approximation of large-scale dynamical systems: an overview. Int. J. Appl. Math. Comput. Sci. 2001;5:1093–1121.
    1. Beerman I, Rossi DJ. Epigenetic regulation of hematopoietic stem cell aging. Exp. Cell Res. 2014;329:192–199. - PMC - PubMed
    1. Benayoun BA, Pollina EA, Brunet A. Epigenetic regulation of ageing: linking environmental inputs to genomic stability. Nat. Rev. Mol. Cell Biol. 2015;16:593–610. - PMC - PubMed
    1. Blattler A, Yao L, Witt H, Guo Y, Nicolet CM, Berman BP, Farnham PJ. Global loss of DNA methylation uncovers intronic enhancers in genes showing expression changes. Genome Biol. 2014;15:469. - PMC - PubMed
    1. Boyle P, Clement K, Gu H, Smith ZD, Ziller M, Fostel JL, Holmes L, Meldrim J, Kelley F, Gnirke A, et al. Gel-free multiplexed reduced representation bisulfite sequencing for large-scale DNA methylation profiling. Genome Biol. 2012;13:R92. - PMC - PubMed