. 2017 Apr 5;18(1):37.
doi: 10.1186/s12868-017-0352-5.

Transcriptional signatures of steroid hormones in the striatal neurons and astrocytes

Affiliations

Transcriptional signatures of steroid hormones in the striatal neurons and astrocytes

Marcin Piechota et al. BMC Neurosci. .

Abstract

Background: The mechanisms of steroids actions in the brain mainly involve the binding and nuclear translocation of specific cytoplasmic receptors. These receptors can act as transcription factors and regulate gene expression. However, steroid-dependent transcriptional regulation in different types of neural cells is not yet fully understood. The aim of this study was to evaluate and compare transcriptional alterations induced by various steroid receptor agonists in primary cultures of astrocytes and neurons from mouse brain.

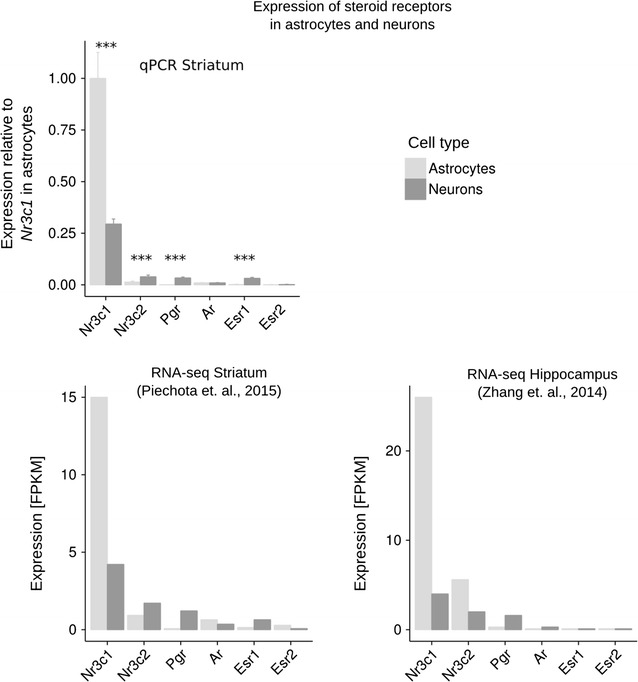
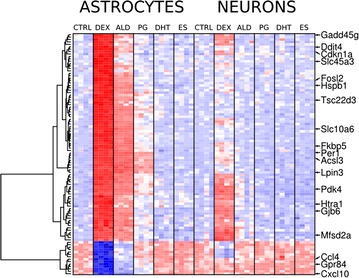
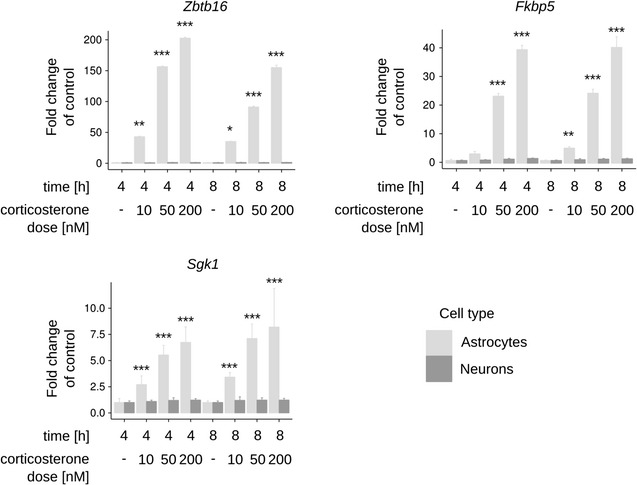
Results: We utilized whole-genome microarrays (Illumina Mouse WG-6) and quantitative PCR analyses to measure mRNA abundance levels. To stimulate gene expression we treated neuronal and astroglial cultures with dexamethasone (100 nM), aldosterone (200 nM), progesterone (200 nM), 5α-dihydrotestosterone (200 nM) and β-Estradiol (200 nM) for 4 h. Neurons were found to exhibit higher levels of expression of mineralocorticoid receptor, progesterone receptor and estrogen receptor 2 than astrocytes. However, higher mRNA level of glucocorticoid receptor mRNA was observed in astrocytes. We identified 956 genes regulated by steroids. In astrocytes we found 381 genes altered by dexamethasone and 19 altered by aldosterone. Functional classification of the regulated genes indicated their putative involvement in multiple aspects of cell metabolism (up-regulated Slc2a1, Pdk4 and Slc45a3) and the inflammatory response (down-regulated Ccl3, Il1b and Tnf). Progesterone, dihydrotestosterone and estradiol did not change gene expression in astrocytes. We found no significant changes in gene expression in neurons.

Conclusions: The obtained results indicate that glial cells might be the primary targets of transcriptional action of steroids in the central nervous system. Substantial changes in gene expression driven by the glucocorticoid receptor imply an important role for the hypothalamic-pituitary-adrenal axis in the hormone-dependent regulation of brain physiology. This is an in vitro study. Hence, the model may not accurately reflect all the effects of steroids on gene expression in neurons in vivo.


Figures

Fig. 1
Fig. 1
Primary cell cultures of neurons and astrocytes. The purity was estimated by immunostaining for specific protein markers. (a) Neuronal cultures were immunostained on glass slides against MAP2 protein (red), GFAP astrocyte specific protein (green) and DAPI (blue). The staining confirmed at least 90% purity of neuronal cultures from the mouse striatum. (b) Primary astrocytes stained against GFAP (green), MAP2 (red) and DAPI (blue). (c) Primary astrocytes stained against GFAP (green), NEUN (red) and DAPI (blue). (d) The enrichment of astrocytes was determined by flow cytometry of immunostained GLAST-positive cells isolated from the brains of 5 days old C57BL/6 J mice. Approximately 80% of the cells were GLAST-positive astrocytes after the separation on MACS columns
Fig. 2
Fig. 2
Levels of steroid hormone receptors in astroglial and neuronal primary cultures. Bar graphs (upper left) summarizing the qPCR-based measurement of gene expression of steroid nuclear receptors Nr3c1, Nr3c2, Pgr, Ar, Esr1, Esr2 (n = 4–6). Significant differences in the expression between astrocytes and neurons are indicated by asterisks (t test, ***p < 0.001). Bar graphs (bottom left) summarizing RNA-seq-based measurement of gene expression of steroid nuclear receptors [24]. Bar graphs summarizing RNA-seq-based measurement of gene expression of steroid nuclear receptors as reported by [13]. Technique and tissue from which the primary cultures were derived are indicated in the titles of the particular plots
Fig. 3
Fig. 3
Dexamethasone-induced regulation of astroglia specific genes in neuronal primary cultures. The bar graph summarizes the induction of gene expression in neurons after dexamethasone treatment. Two groups of genes are presented: astrocyte-specific genes (log2 ratio of astroglial to neuronal expression higher than 2) and neuron-specific genes (log2 ratio of astroglial to neuronal expression lower than −2)
Fig. 4
Fig. 4
Steroid receptor agonist induced transcriptome alterations. Microarray results are shown as a heat map and include the top 100 genes with significant differences shown by two-way ANOVA for the drug factor. Colored rectangles represent transcript abundance in neurons and astrocytes in control samples (CTRL) and after treatment with dexamethasone (DEX), aldosterone (ALD), progesterone (PG), dihydrotestosterone (DHT) or estradiol (ES). The intensity of the color is proportional to the standardized values (blue low, red high). Clustering was performed using correlation distance and complete tree-building method. Particularly interesting gene symbols are shown on the right. The data for neurons and astrocytes were adjusted for means in the control groups to better visualise the effects of steroid compounds. FPKM—fragments per kilobase of exon per million fragments mapped
Fig. 5
Fig. 5
Effects of corticosterone on gene expression of selected genes in astrocytes and neurons. Bar graphs summarizing the qPCR-based measurements of changes in the expression of selected genes following the indicated corticosterone dose and time. Data are presented as the fold change over the control group (without corticosterone) ± standard deviation (n = 3–4). Significant differences from the post hoc analysis using a Tukey’s honest significant difference test (vs. appropriate control) by asterisks (***p < 0.001, **p < 0.01 and *p < 0.05)

References

    1. McEwen BS. Stress, adaptation, and disease. Allostasis and allostatic load. Ann N Y Acad Sci. 1998;840:33–44. doi: 10.1111/j.1749-6632.1998.tb09546.x. - DOI - PubMed
    1. Herman JP, Cullinan WE. Neurocircuitry of stress: central control of the hypothalamo–pituitary–adrenocortical axis. Trends Neurosci. 1997;20:78–84. doi: 10.1016/S0166-2236(96)10069-2. - DOI - PubMed
    1. Fehm HL, Benkowitsch R, Kern W, Fehm-Wolfsdorf G, Pauschinger P, Born J. Influences of corticosteroids, dexamethasone and hydrocortisone on sleep in humans. Neuropsychobiology. 1986;16:198–204. doi: 10.1159/000118326. - DOI - PubMed
    1. Erickson K, Drevets W, Schulkin J. Glucocorticoid regulation of diverse cognitive functions in normal and pathological emotional states. Neurosci Biobehav Rev. 2003;27:233–246. doi: 10.1016/S0149-7634(03)00033-2. - DOI - PubMed
    1. Roozendaal B. Glucocorticoids and the regulation of memory consolidation. Psychoneuroendocrinology. 2000;25:213–238. doi: 10.1016/S0306-4530(99)00058-X. - DOI - PubMed

Publication types

MeSH terms