

FKBP8 recruits LC3A to mediate Parkin-independent mitophagy
- PMID: 28381481
- PMCID: PMC5452039
- DOI: 10.15252/embr.201643147
FKBP8 recruits LC3A to mediate Parkin-independent mitophagy
Abstract
Mitophagy, the selective removal of damaged or excess mitochondria by autophagy, is an important process in cellular homeostasis. The outer mitochondrial membrane (OMM) proteins NIX, BNIP3, FUNDC1, and Bcl2-L13 recruit ATG8 proteins (LC3/GABARAP) to mitochondria during mitophagy. FKBP8 (also known as FKBP38), a unique member of the FK506-binding protein (FKBP) family, is similarly anchored in the OMM and acts as a multifunctional adaptor with anti-apoptotic activity. In a yeast two-hybrid screen, we identified FKBP8 as an ATG8-interacting protein. Here, we map an N-terminal LC3-interacting region (LIR) motif in FKBP8 that binds strongly to LC3A both in vitro and in vivo FKBP8 efficiently recruits lipidated LC3A to damaged mitochondria in a LIR-dependent manner. The mitophagy receptors BNIP3 and NIX in contrast are unable to mediate an efficient recruitment of LC3A even after mitochondrial damage. Co-expression of FKBP8 with LC3A profoundly induces Parkin-independent mitophagy. Strikingly, even when acting as a mitophagy receptor, FKBP8 avoids degradation by escaping from mitochondria. In summary, this study identifies novel roles for FKBP8 and LC3A, which act together to induce mitophagy.
Keywords: FKBP38; FKBP8; LC3A; autophagy; mitophagy.
© 2017 The Authors.
Figures
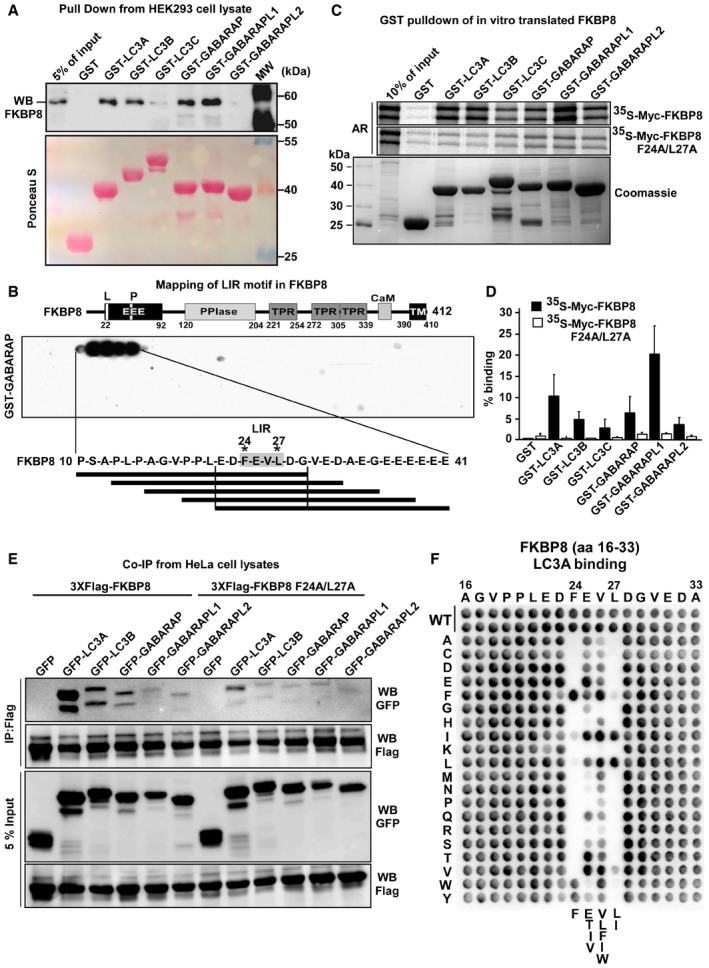
GST‐pulldown assay of endogenous FKBP8 from a RIPA buffer lysate of human HEK293 cells incubated with recombinant GST or GST fused to human ATG8 family proteins immobilized on Glutathione Sepharose beads. The pulled‐down FKBP8 protein and 5% of the input lysate were analyzed by Western blotting using anti‐FKBP8 antibody. GST or GST fusion proteins were visualized by Ponceau S staining (lower panel).
Peptide array of 20‐mer peptides covering full‐length FKBP8 was used for identification of a putative LIR motif in the N‐terminus of FKBP8. Each peptide was shifted three amino acids relative to the previous peptide. The array was probed with 1 μg/ml of GST‐GABARAP for 2 h, and binding to GST‐GABARAP detected with anti‐GST antibody. The sequences of the GABARAP‐interacting peptides are shown. A schematic drawing of the domain architecture of human FKBP8 is displayed above the peptide array. Numbers indicate amino acid positions. L, LIR motif; EEE, glutamate‐rich domain; P, proline‐rich region; PPIase, peptidyl‐prolyl cis‐trans isomerase domain; TPR, tetratricopeptide repeats: CaM, calmodulin‐binding domain; and TM, transmembrane domain. Asterisks indicate the conserved aromatic and hydrophobic residues of the LIR motif.
GST‐pulldown assay using 35S‐labeled Myc‐FKBP8 WT or LIR mutant incubated with recombinant GST or GST fused to ATG8 family proteins. The Coomassie staining represents the amount of GST‐ATG8 fusion proteins on Glutathione Sepharose beads used in the assays. Bound Myc‐FKBP8 WT and LIR mutant were detected by autoradiography.
Quantifications of the binding of Myc‐FKBP8 WT and LIR mutant to the GST‐ATG8 proteins presented as percentage binding relative to the 10% input. The bars represent the mean values with standard deviations of three independent experiments.
Co‐immunoprecipitation experiments performed with Flag antibodies using extracts from HeLa cells transiently transfected with expression vectors for GFP or GFP‐tagged ATG8 proteins together with 3×Flag‐tagged wild‐type (WT) or LIR mutant (F24A/L27A) FKBP8. The blots were probed with anti‐Flag and anti‐GFP antibodies.
A two‐dimensional peptide array scan analyzing the effect of single amino acid substitutions at all positions of the indicated 18‐mer peptide from FKBP8 (amino acids 16–33). The array was probed with 1 μg/ml of GST‐LC3A for 2 h, and binding to GST‐LC3A detected with anti‐GST antibody.
- A, B
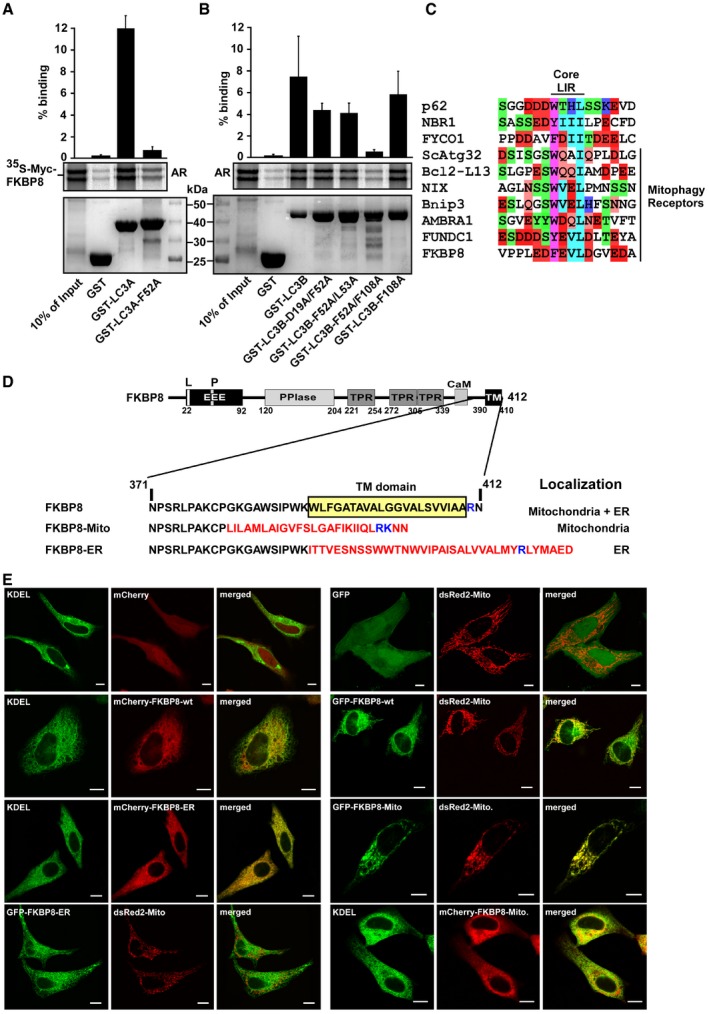
GST‐pulldown assay using 35S‐labeled Myc‐FKBP8 WT incubated with recombinant GST and GST‐LC3A‐WT or GST‐LC3A‐F52A mutation (LDS mutation) (A) or GST‐LC3B or GST‐LC3B indicated mutations (LDS predicted sites) (B). Bound FKBP8 was detected by autoradiography. The bar graphs in the top panel represent the mean values of percentage binding of in vitro‐translated FKBP8 to GST‐LC3A or GST‐LC3B WT and mutant proteins relative to the 10% input with standard deviations based on three independent experiments.
- C
Alignment of core LIR motifs in the autophagy mediators p62, NBR1, FYCO1, and the identified mitophagy receptors as well as FKBP8. Color coding; aromatic residues (magenta), acidic residues (red), hydrophobic residues (turquoise), Ser and Thr residues (green), Gln and Asn (orange), and basic residues (blue).
- D
The transmembrane (TM) domain at the C‐terminus of FKBP8 (depicted schematically) was swapped with the ActA sequence and the cytochrome b5 sequence to generate mitochondria‐ and ER‐specific FKBP8, respectively. The amino acid sequence of the C‐terminus of each construct is shown. The TM domain sequences from ActA and cytochrome b5 are indicated in red with the important basic residue(s) in blue.
- E
HeLa cells were co‐transfected with EGFP‐FKBP8‐Mito and dsRed2‐Mito or EGFP‐KDEL (ER marker) and mCherry‐FKBP8‐ER. Transfected cells were imaged by a Leica SP5 fluorescence confocal microscope to confirm co‐localization. Scale bars, 10 μm.
- A
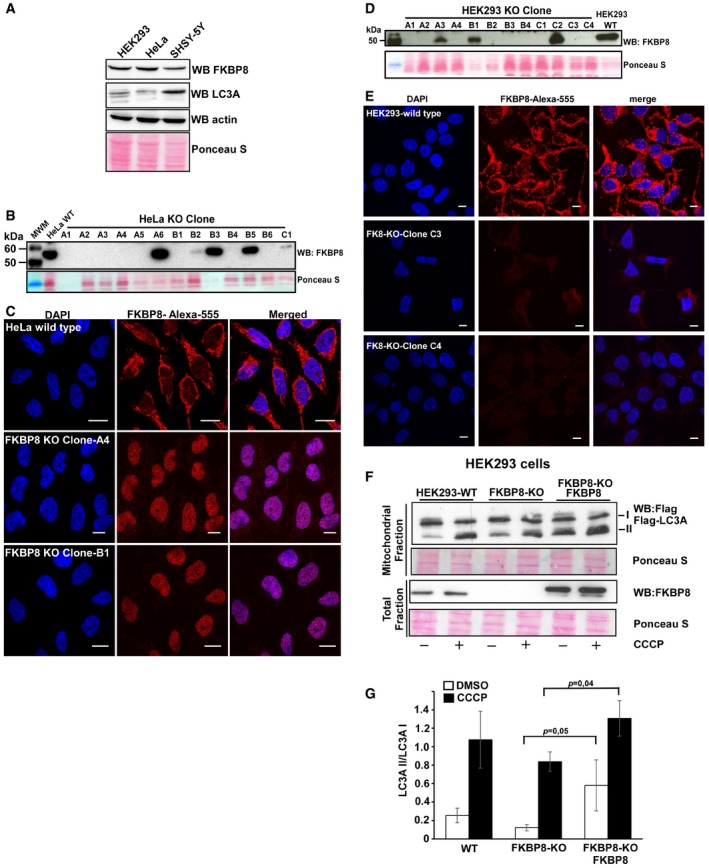
Western blot analysis of cell extracts (40 μg) from HEK293, HeLa, and SH‐SY5Y cells with anti‐FKBP8 and anti‐LC3A antibodies.
- B
Western blot analysis of CRISPR/Cas9 HeLa clones with anti‐FKBP8 antibody in comparison with the mother cell line Flp‐In T‐REx HeLa.
- C
Immunostaining analyses of the wild‐type Flp‐In T‐REx HeLa and knockout clones A4 and B1 with anti‐FKBP8 antibody. The nuclei were stained with DAPI. Scale bars, 10 μm.
- D
Western blot analysis of CRISPR/Cas9 HEK293 clones with anti‐FKBP8 antibody in comparison with the mother cell line Flp‐In T‐REx HEK293.
- E
Immunostaining analysis of the wild‐type Flp‐In T‐REx Hek293 and knockout clones C3 and C4 with anti‐FKBP8 antibody. The nuclei were stained with DAPI. Scale bars, 10 μm.
- F, G
FKBP8 overexpression in Flp‐In T‐REx HEK293 FKBP8 KO cells significantly increases the amount of lipidated Flag‐LC3A in the mitochondrial fraction. Flp‐In T‐REx HEK293 WT and CRISPR/Cas9‐generated KO clone C3 cells were transfected with Flag‐LC3A constructs or Flag‐LC3A and Myc‐FKBP8 expression constructs and treated with DMSO or CCCP (30 μM; 4 h). The amounts of Flag‐LC3A in the mitochondrial fraction (40 μg) and FKBP8 in the total fractions (30 μg) were analyzed by Western blotting. Ponceau S‐stained blots are used as loading controls. The graph in (G) represents the average of quantitated Flag‐LC3A II/Flag‐LC3A I values of three independent experiments performed as in (F) (n = 3). Error bars represent the s.d. The P‐values were calculated using paired Student's t‐test and are indicated above the bars.
- A, B
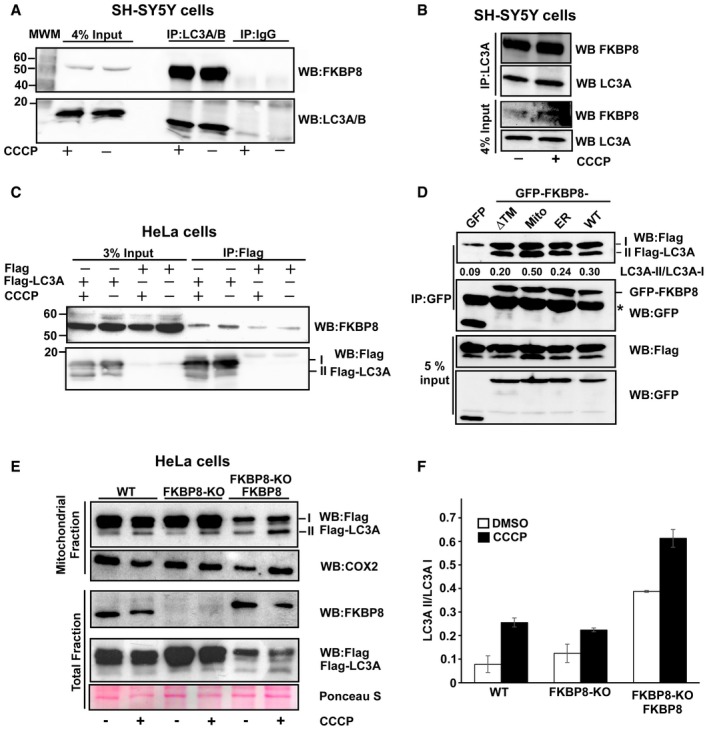
Antibodies to endogenous LC3A/B (A), or LC3A only (B), efficiently co‐precipitated endogenous FKBP8 from SH‐SY5Y cell extracts. SH‐SY5Y cells were treated with DMSO or 10 μM CCCP for 4 h and subjected to immunoprecipitation using an LC3A/B antibody or using rabbit serum (IgG) as negative control. In another set of experiments, an LC3A‐specific antibody was used for immunoprecipitation (B). Co‐precipitated FKBP8 was detected by Western blotting using a FKBP8 antibody.
- C
Flag‐LC3A co‐precipitated endogenous FKBP8 from HeLa cell extracts. HeLa cells were transfected with 3×Flag‐LC3A constructs and treated with DMSO or 10 μM CCCP for 4 h and subjected to immunoprecipitation using a Flag antibody. Co‐precipitated FKBP8 was detected by Western blotting using a FKBP8 antibody.
- D
HeLa cells were co‐transfected with GFP, GFP‐FKBP8‐ΔTM, GFP‐FKBP8‐Mito, or GFP‐FPBP8‐ER, or GFP‐FKBP8‐WT, respectively, and Flag‐LC3A expression constructs, and co‐precipitations performed using a GFP antibody. The star indicates IgG heavy chain. The blot shows one representative experiment out of three independent experiments. The ratios of LC3A II/LC3A I are shown below the upper blot.
- E, F
FKBP8 overexpression in HeLa FKBP8 KO cells significantly increased the amount of lipidated Flag‐LC3A in the mitochondrial fraction. HeLa WT and a CRISPR/Cas9‐generated KO clone were transfected with 3×Flag‐LC3A constructs, or 3×Flag‐LC3A and Myc‐FKBP8 expression constructs, and treated with DMSO or CCCP (30 μM; 4 h). The amounts of Flag‐LC3A in the mitochondrial fraction (40 μg) and FKBP8 in the total fractions (30 μg) were analyzed by Western blotting. Ponceau S staining is used as loading control. Cox2 was used as mitochondrial marker. The blot in (E) is representative of two independent experiments. The graph in (F) represents the average values of quantitated Flag‐LC3A II/Flag‐LC3A I ratio of two independent experiments. Error bars show the s.d.
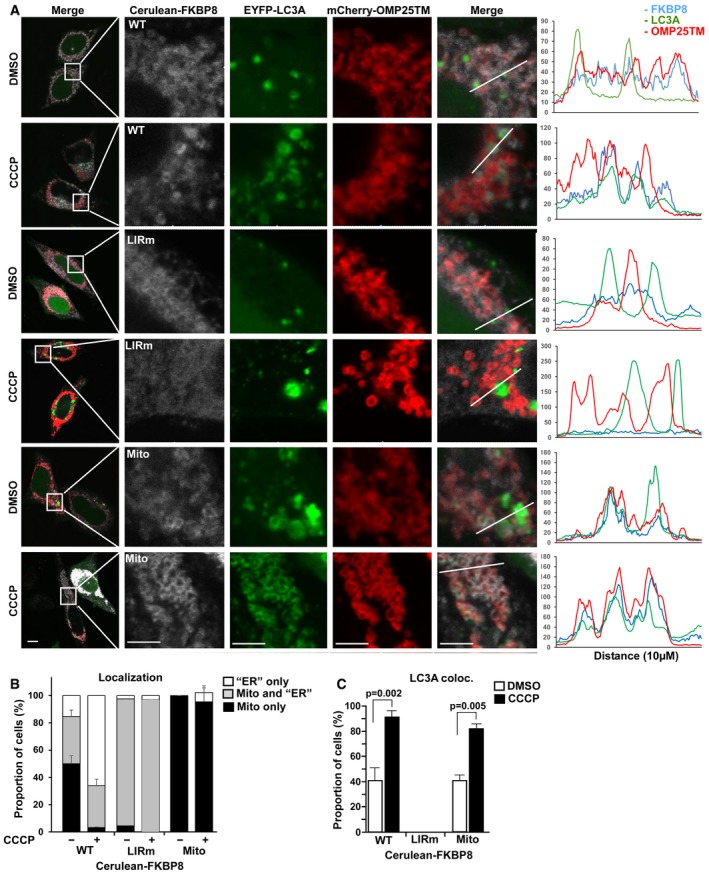
- A
HeLa cells were co‐transfected with plasmids expressing Cerulean‐FKBP8 WT, Cerulean‐FKBP8 LIR mutant, or Cerulean‐FKBP8 Mito together with EYFP‐LC3A and the mCherry‐OMP25TM probe to label the mitochondria. The cells were treated with DMSO or 10 μM CCCP for 6 h and imaged using a Leica SP5 fluorescence confocal microscope. Scale bars, 10 μm; on zoomed images, 5 μm. Line‐profile co‐localization plots of Cerulean‐FKBP8 WT, Cerulean‐FKBP8 LIR mutant (LIRm), or Cerulean‐FKBP8 Mito (Mito) (blue lines); EYFP‐LC3A (green lines); and OMP25TM (red lines) were made using the line‐profile quantification tool in the Leica imaging software (LAS‐AF). The vertical axes represent measurements of fluorescent intensity and the horizontal axis the drawn distances.
- B, C
Proportion in % of cells that display co‐localization between Cerulean‐FKBP8 WT, Cerulean‐FKBP8 LIR mutant, or Cerulean‐FKBP8 Mito and OMP25TM (B) or EYFP‐LC3A (C). The proportion of cells that displayed co‐enrichment in cellular structures/dots of FKBP8 WT/LIRm/Mito and OMP25TM, or with FKBP8 WT/LIRm/Mito and LC3A‐positive structures, were quantitated manually. Thirty cells were analyzed for each condition within each experiment, a total of 100 cells per condition. The graphs represent the average values (n = 3), and error bars represent s.d. for the three independent experiments. P‐values calculated by Student's t‐test, paired, are indicated above the graph (C).
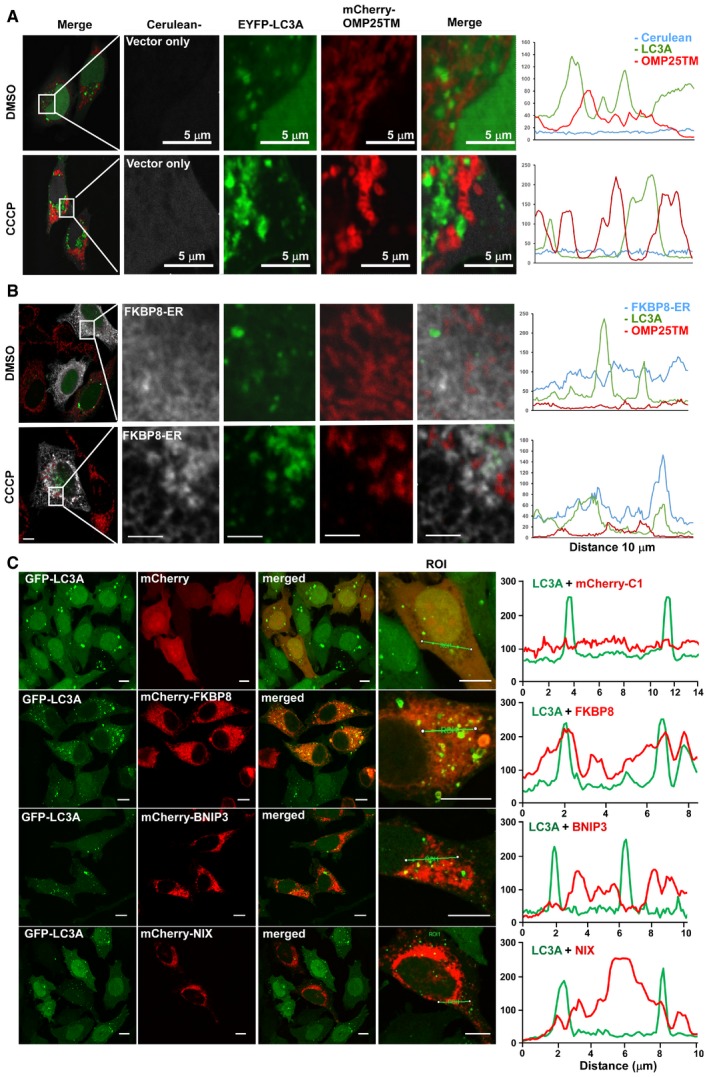
- A, B
HeLa cells were co‐transfected with Cerulean vector control (A) or Myc‐FKBP8‐ER (B), EYFP‐LC3A, and mCherry‐OMP25TM expression constructs. The cells were treated with DMSO or 10 μM CCCP for 4 h and imaged by a Leica SP5 fluorescence confocal microscope. Scale bars, 10 μm; in zoomed images, 5 μm. Line‐profile co‐localization plots of Cerulean or FKBP8 ER (blue line), EYFP‐LC3A (green line), and OMP25TM (red line) were made using the line‐profile quantification tool in the Leica imaging software (LAS‐AF). The vertical axes represent measurements of fluorescent intensity and the horizontal axis the drawn distances.
- C
A HeLa cell line stably expressing GFP‐LC3A was transfected with plasmids expressing the indicated mCherry‐fusion proteins imaged by a Leica SP5 confocal microscope. Scale bars, 10 μm. Line‐profile co‐localization of plots of GFP‐LC3A (green line) and mCherry vector control, mCherry‐FKBP8, mCherry‐NIX, or mCherry‐BNIP3 (red lines) were made using the line‐profile quantification tool in Leica imaging software. The measurements of the intensity (y‐axis) and distance (x‐axis in μm) are plotted on the graph.
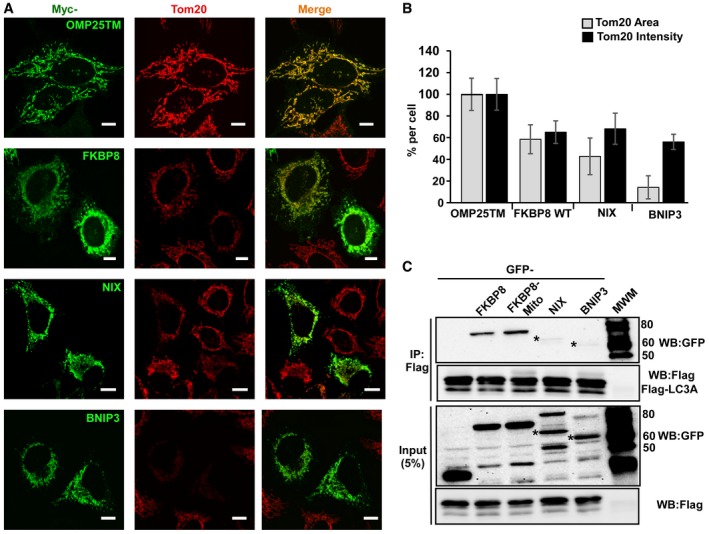
HeLa cells transfected with expression vectors encoding Myc‐tagged OMP25TM, FKBP8, NIX, or BNIP3, respectively, were immunostained with anti‐TOM20 and anti‐Myc antibodies to reveal changes in mitochondrial morphology. Scale bars, 10 μm.
Quantitation of TOM20‐positive mitochondrial area (%) and TOM20 fluorescence intensity (%) per cell for cells expressing vector control (Myc‐OMP25TM), Myc‐tagged FKBP8, NIX, or BNIP3. The data were calculated using Volocity 6.2.1 software (PerkinElmer Inc.). The bars represents the average values with standard deviations of TOM20‐positive area and intensity per cell based on analyzing 40 cells for each protein. The experiment was performed twice with similar results.
HeLa cells were transiently co‐transfected with GFP, GFP‐NIX, or GFP‐BNIP3 and Flag‐LC3A expression constructs. After immunoprecipitation with Flag antibodies, precipitated and co‐precipitated proteins were analyzed by Western blotting using the indicated antibodies. Similar results were obtained in three independent experiments. Asterisks indicate the bands corresponding to full‐length NIX and BNIP3.
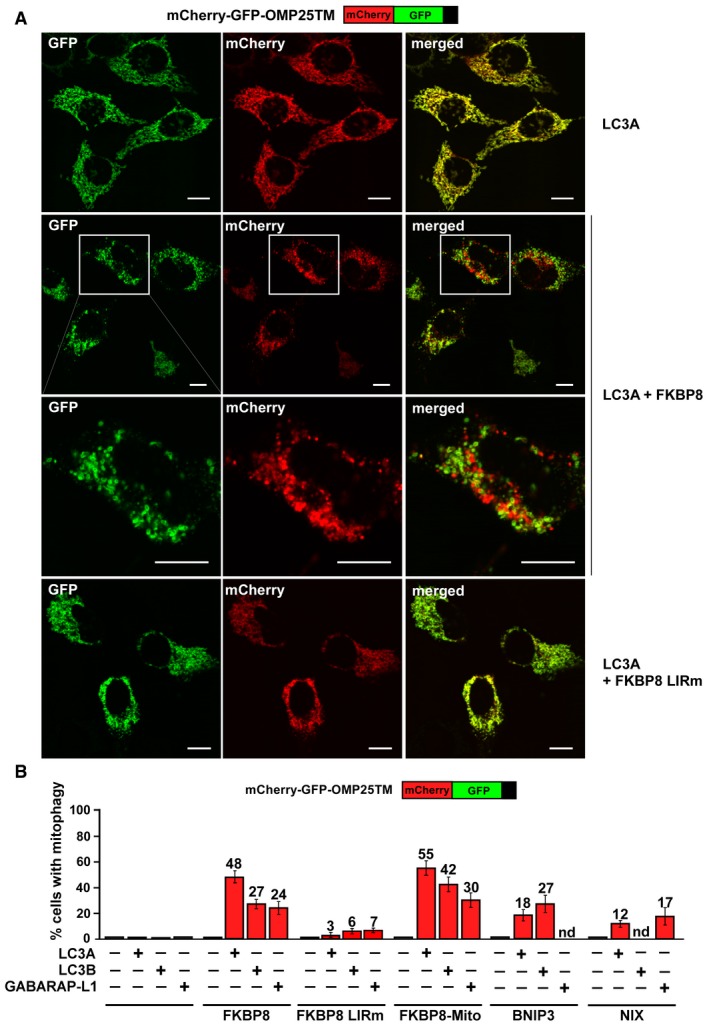
HeLa cells were transiently transfected with mCherry‐GFP‐OMP25‐TM and 3×Flag‐LC3A together with Myc‐C1 as control or Myc‐FKBP8 WT or LIR mutant expression constructs. The appearance of red‐only structures indicates acidified mitochondria. Scale bars, 10 μm.
HeLa cells were transiently overexpressing mCherry‐GFP‐OMP25‐TM, the indicated 3×Flag‐tagged ATG8 proteins LC3A, LC3B, or GABARAPL1, together with Myc‐tagged FKBP8 WT, FKBP8 LIR mutant, or FKBP8‐Mito, or the mitophagy receptors BNIP3 or NIX. The graph bars represent the percentage of transfected cells containing red‐only dots indicative of mitophagy activity. Each bar shows the mean value from measurements on 50–70 cells obtained in three independent experiments (n = 3). Error bars represent the s.d.
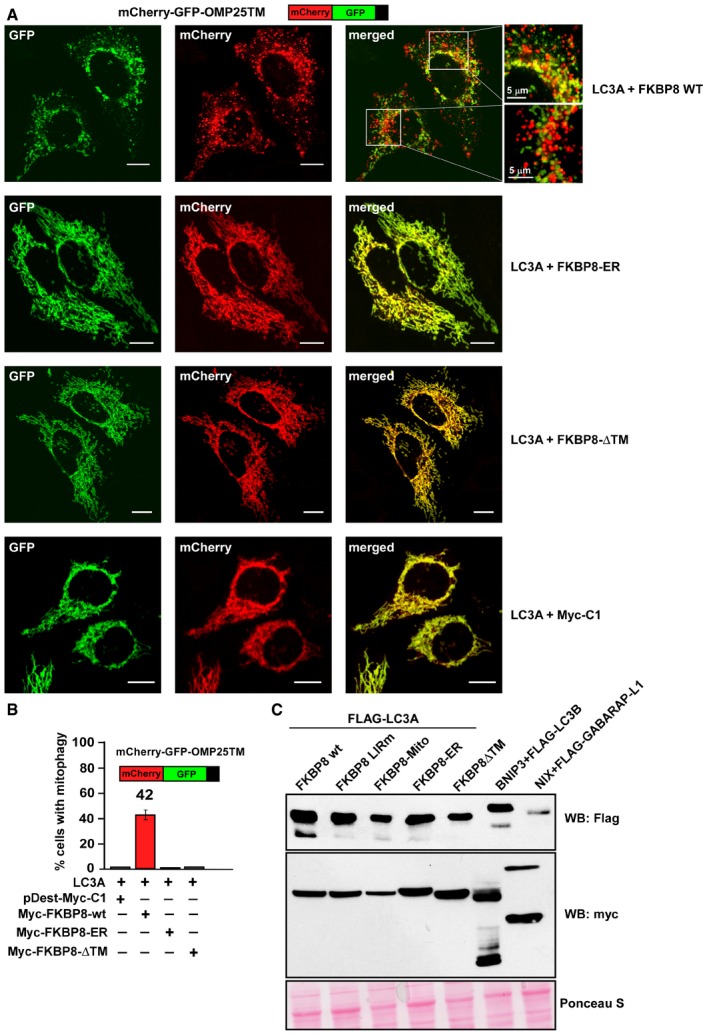
HeLa cells were transiently transfected with mCherry‐GFP‐OMP25‐TM and 3×Flag‐LC3A together with Myc‐C1 as control and Myc‐FKBP8 WT, Myc‐FKBP8‐∆TM, or Myc‐FKBP8‐ER mutant expression constructs. The appearance of red‐only structures indicates acidified mitochondria. Scale bars, 10 μm.
HeLa cells were transiently overexpressing mCherry‐GFP‐OMP25‐TM, 3×Flag‐LC3A, together with Myc‐tagged FKBP8 WT, FKBP8‐∆TM, or FKBP8‐ER. The graph bars represent the percentage of transfected cells containing red‐only dots indicative of mitophagy activity. Each bar shows the mean value with standard deviations from measurements on 50–70 cells obtained in three independent experiments.
Western blot showing the expression levels of FKBP8 WT and mutant constructs, BNIP3, NIX, and the various ATG8 proteins in the cells used for experiments shown in Figs 5 and EV4B. Ponceau S staining is used as the loading control.
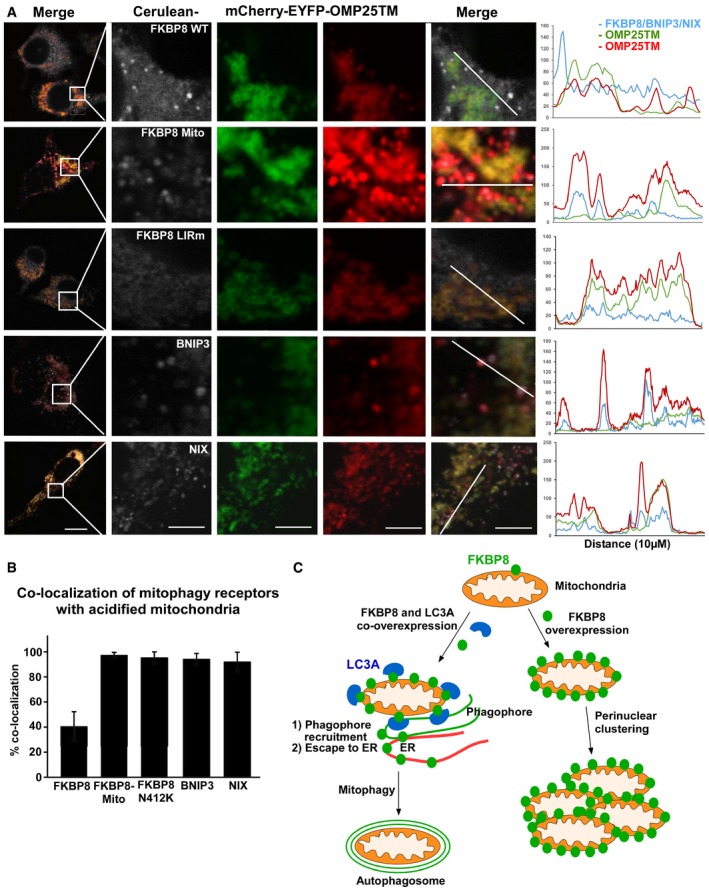
HeLa cells were transiently transfected with mCherry‐EYFP‐OMP25TM and Flag‐LC3A expression constructs, together with Cerulean‐FKBP8 WT, Cerulean‐FKBP8 Mito, or Cerulean‐FKBP8 LIRm expression vectors; or mCherry‐EYFP‐OMP25TM together with Cerulean‐BNIP3 and Flag‐LC3B expression vectors; or mCherry‐EYFP‐OMP25TM together with Cerulean‐NIX and Flag‐GABARAP expression vectors. The cells were imaged using a Leica SP5 fluorescence confocal microscope. Scale bar, 10 μm; in zoomed images, 5 μm. Line‐profile co‐localization plots of Cerulean‐FKBP8 WT, Cerulean‐FKBP8 LIR mutant, Cerulean‐FKBP8 Mito, Cerulean‐BNIP3, or Cerulean‐NIX (blue lines) and mCherry‐EYFP‐OMP25TM (red and green lines) were made using the line‐profile quantification tool in the Leica imaging software (LAS‐AF). The vertical axes represent measurements of fluorescent intensity and the horizontal axis the drawn distances.
Quantification of acidified mitochondria with co‐localized Cerulean‐FKBP8 WT or mutants, co‐localized Cerulean‐BNIP3, or co‐localized Cerulean‐NIX. The numbers of red‐only mCherry‐EYFP‐OMP25TM dots that contained enrichment of FKBP8 WT or mutants, enrichment of BNIP3, or enrichment of NIX, were quantitated manually in two independent experiments. The bars represent the average values from at least 100 cells in two independent experiments. Error bars represent s.d.
Model of FKBP8‐mediated LC3A recruitment and subsequent escape of FKBP8 from mitochondria targeted for degradation by autophagy.
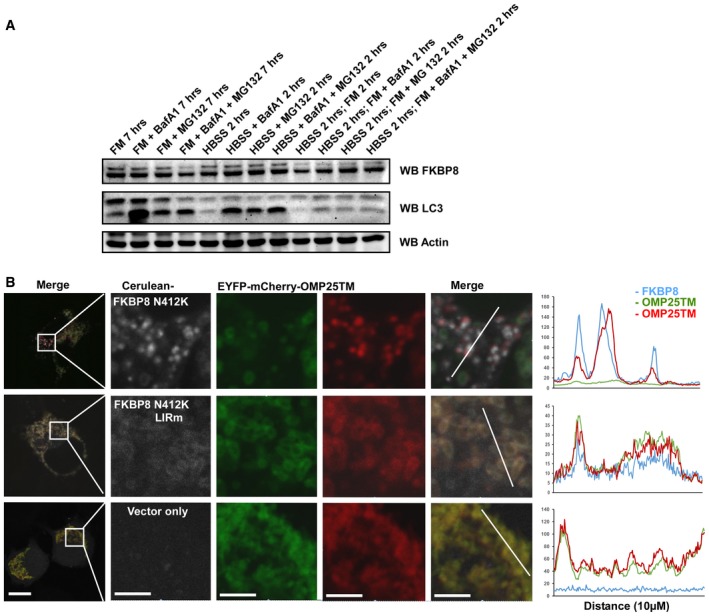
HeLa cells were treated with Baf‐A1 or MG132 or starved with HBSS for the indicated times. Cells were harvested and subjected to Western blotting for analysis of endogenous FKBP8 and LC3B.
HeLa cells were transiently transfected with mCherry‐GFP‐OMP25TM and Flag‐LC3A expression constructs, together with Cerulean‐FKBP8 N412K, Cerulean‐FKBP8 N412K + LIRm, or Cerulean‐only expression vectors. The cells were imaged using a Leica SP5 fluorescence confocal microscope. Scale bars, 10 μm; in zoomed images, 5 μm. Line‐profile co‐localization plots of Cerulean‐FKBP8 mutants (blue line) and mCherry‐GFP‐OMP25TM (red and green lines) were made using the line‐profile quantification tool in the Leica imaging software (LAS‐AF). The vertical axes represent measurements of fluorescent intensity and the horizontal axis the drawn distances.
Comment in
-
Parkin-independent mitophagy-FKBP8 takes the stage.EMBO Rep. 2017 Jun;18(6):864-865. doi: 10.15252/embr.201744313. Epub 2017 May 17. EMBO Rep. 2017. PMID: 28515082 Free PMC article.
References
-
- Detmer SA, Chan DC (2007) Functions and dysfunctions of mitochondrial dynamics. Nat Rev Mol Cell Biol 8: 870–879 - PubMed
MeSH terms
Substances
LinkOut - more resources
Full Text Sources
Other Literature Sources
Molecular Biology Databases
Research Materials
