. 2017 Jul 1;118(1):267-279.
doi: 10.1152/jn.00963.2016. Epub 2017 Apr 5.

Recreational concentrations of alcohol enhance synaptic inhibition of cerebellar unipolar brush cells via pre- and postsynaptic mechanisms

Affiliations

Recreational concentrations of alcohol enhance synaptic inhibition of cerebellar unipolar brush cells via pre- and postsynaptic mechanisms

Ben D Richardson et al. J Neurophysiol. .

Abstract

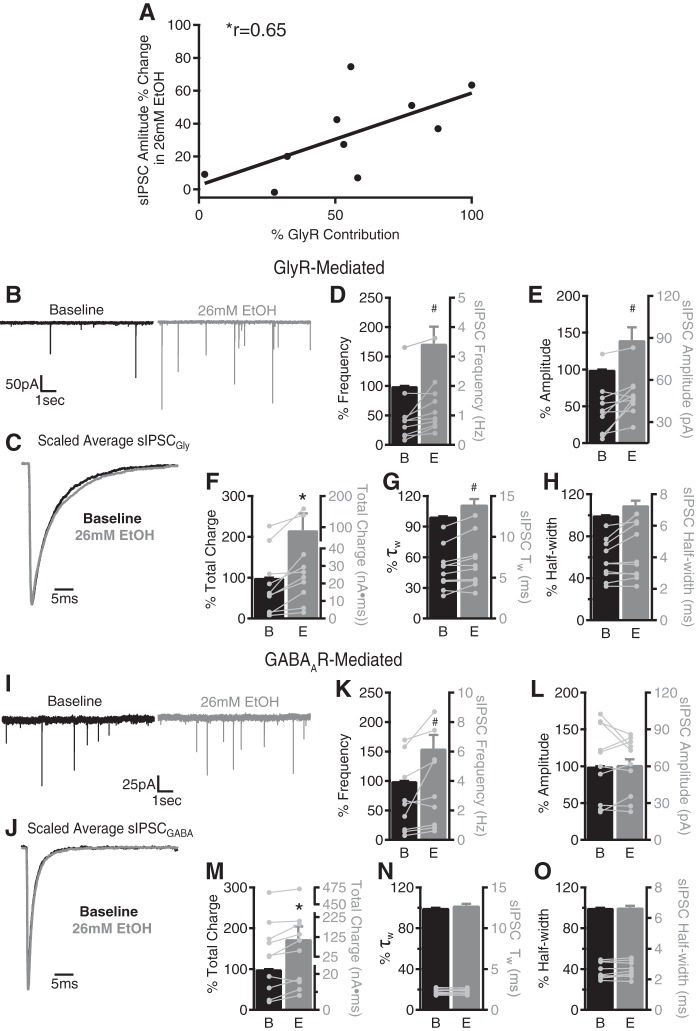
Variation in cerebellar sensitivity to alcohol/ethanol (EtOH) is a heritable trait associated with alcohol use disorder in humans and high EtOH consumption in rodents, but the underlying mechanisms are poorly understood. A recently identified cellular substrate of cerebellar sensitivity to EtOH, the GABAergic system of cerebellar granule cells (GCs), shows divergent responses to EtOH paralleling EtOH consumption and motor impairment phenotype. Although GCs are the dominant afferent integrator in the cerebellum, such integration is shared by unipolar brush cells (UBCs) in vestibulocerebellar lobes. UBCs receive both GABAergic and glycinergic inhibition, both of which may mediate diverse neurological effects of EtOH. Therefore, the impact of recreational concentrations of EtOH (~10-50 mM) on GABAA receptor (GABAAR)- and glycine receptor (GlyR)-mediated spontaneous inhibitory postsynaptic currents (sIPSCs) of UBCs in cerebellar slices was characterized. Sprague-Dawley rat (SDR) UBCs exhibited sIPSCs mediated by GABAARs, GlyRs, or both, and EtOH dose-dependently (10, 26, 52 mM) increased their frequency and amplitude. EtOH increased the frequency of glycinergic and GABAergic sIPSCs and selectively enhanced the amplitude of glycinergic sIPSCs. This GlyR-specific enhancement of sIPSC amplitude resulted from EtOH actions at presynaptic Golgi cells and via protein kinase C-dependent direct actions on postsynaptic GlyRs. The magnitude of EtOH-induced increases in UBC sIPSC activity varied across SDRs and two lines of mice, in parallel with their respective alcohol consumption/motor impairment phenotypes. These data indicate that Golgi cell-to-UBC inhibitory synapses are targets of EtOH, which acts at pre- and postsynaptic sites, via Golgi cell excitation and direct GlyR enhancement.NEW & NOTEWORTHY Genetic variability in cerebellar alcohol/ethanol sensitivity (ethanol-induced ataxia) predicts ethanol consumption phenotype in rodents and humans, but the cellular and molecular mechanisms underlying genetic differences are largely unknown. Here it is demonstrated that recreational concentrations of alcohol (10-30 mM) enhance glycinergic and GABAergic inhibition of unipolar brush cells through increases in glycine/GABA release and postsynaptic enhancement of glycine receptor-mediated responses. Ethanol effects varied across rodent genotypes parallel to ethanol consumption and motor sensitivity phenotype.

Keywords: alcohol; cerebellum; unipolar brush cell.


Figures

Fig. 1.
Fig. 1.
Cerebellar UBCs receive mixed GABAergic and/or glycinergic synaptic inhibition. A, left: DIC image of lobe X within a sagittal cerebellar slice with patch pipette at right recording from a UBC (white arrowhead), which stands out with its larger soma size relative to granule cells (white “>”). Right: 3-dimensional projection of confocally acquired fluorescent image planes (rotated slightly to improve visibility of brush) of the same patched cell from image on left after recording session with Alexa 568 dye present in the pipette. The observed round soma and short brushlike dendrite, typical of UBCs, is the morphological phenotype used to confirm a cell’s identity as a UBC after each recording. B: recordings from 3 different UBCs representing each class of sIPSC (inward/downward deflections) that are only GABAAR mediated [gabazine (GBZ) sensitive; top], only GlyR mediated [strychnine (Strych) sensitive; middle], or GABAAR and GlyR mediated displaying strychnine and GBZ-sensitive components (bottom). C: normalized sIPSC population amplitude histograms for all UBCs recorded in the presence of strychnine (gray, n = 2,209 events from 10 cells from 6 animals) or gabazine (black, n = 1,024 events from 10 cells from 6 animals) are both bimodal, presumably representing quantal and multiquantal events, with large GABAergic events occurring at higher probabilities than large glycinergic events. Raw amplitude distribution from all cells (dotted line) are overlaid with bimodal fit functions (solid lines). D: histogram of total % of glycinergic contribution to the cumulative inhibitory activity (sIPSC frequency × amplitude) for SDR UBCs (n = 49 cells from 18 animals; distribution mean ± SE shown).
Fig. 2.
Fig. 2.
Recreational concentrations of EtOH dose-dependently enhance sIPSC frequency and amplitude in SDR UBCs. A: representative recording of mixed (not pharmacologically isolated) sIPSCs (downward deflections) in 3 different UBCs shows a dose-dependent increase from baseline in sIPSC frequency and amplitude in response to 10, 26, and 52 mM EtOH. B and C: time course plots (20-s bins) of mean ± SE sIPSC frequency (B) and amplitude (C) expressed as % of baseline before, during, and after bath application (gray shaded region) of 10 (n = 10 cells), 26 (n = 11 cells), and 52 (n = 13 cells) mM EtOH. Insets: expanded time course (40-s bins) and increased gain for 10 mM EtOH with error bars removed for clarity. D–G: mean ± SE % change (normalized to baseline) in sIPSC frequency (D), sIPSC amplitude (E), cumulative sIPSC activity (frequency × amplitude; F), and total charge movement (sum of area for all sIPSCs; G) in response to bath-applied 10 (n = 14 cells from 7 animals), 26 (n = 11 cells from 6 animals), and 52 (n = 13 cells from 7 animals) mM EtOH. H: scatterplot of individual UBC % change in average sIPSC amplitude (y-axis) plotted against % change in frequency (x-axis) in 26 mM EtOH for each cell (n = 10 cells from 6 animals). #P < 0.05, *P < 0.01, **P < 0.00, 2-tailed paired t-test (D–F) or Pearson correlation (H).
Fig. 3.
Fig. 3.
EtOH-induced changes in SDR UBC sIPSC activity are action potential dependent (TTX sensitive). A: representative recordings of mixed (not pharmacologically isolated) sIPSCs from a cerebellar UBC in standard ACSF (baseline), after 500 nM TTX application to isolate mIPSCs, and after the subsequent addition of 26 mM EtOH followed by washout of EtOH into TTX only. B and C: normalized mean ± SE (bars, left axis) and raw values for individual UBC (gray circles, right axis) IPSC frequency (B) and amplitude (C) for each indicated condition (n = 8 cells from 2 animals). *P < 0.01, 1-way repeated-measures ANOVA with Bonferroni post hoc comparing all treatments to the TTX condition. NS, not significant.
Fig. 4.
Fig. 4.
EtOH enhances glycinergic and GABAergic sIPSC frequency and selectively increases glycinergic sIPSC amplitude in SDR UBCs. A: scatterplot of individual UBC % change in average sIPSC amplitude in 26 mM EtOH (y-axis) plotted against % contribution of GlyRs (strychnine sensitive) to the cumulative sIPSC activity (x-axis) for each cell (n = 10 cells from 6 animals). The correlation coefficient (r) for the distribution is shown. B: representative recordings of UBC GlyR-mediated sIPSCs (sIPSCGly) in the presence of 10 µM gabazine before (black, baseline) and during (gray) 26 mM EtOH indicate a significant increase in sIPSCGly frequency (D), amplitude (E), and total charge transfer (F). C: superimposed scaled averages of sIPSCGly traces before (black) and during (gray) 26 mM EtOH indicate a modest increase in weighted decay time constant (τw; G) and half-width (H). I: representative recordings of GABAAR-mediated sIPSCs in the presence of 1 µM strychnine (sIPSCGABA) before (black) and during (gray) 26 mM EtOH indicate a significant increase in sIPSCGABA frequency (K) and total charge transfer (M) with no change in amplitude (L). J: superimposed scaled averages of sIPSCGABA traces before (black) and during (gray) 26 mM EtOH indicate that weighted τw (N) and half-width (O) are not affected. Note the slower decay kinetics of isolated sIPSCGly (C, G, H) relative to sIPSCGABA (J, N, O). For D and E, F–H, K and L, and M–O, bars are means ± SE (left axis) and circles are raw values (right axis), with values from the same UBC in different conditions being connected. For sIPSCGly, n = 10 cells from 6 animals and for sIPSCGABA, n = 10 cells from 6 animals. B, baseline; E, 26 mM EtOH. #P < 0.05, *P < 0.01 with 2-tailed paired t-test, Wilcoxon signed-rank test, or Pearson correlation (A).
Fig. 5.
Fig. 5.
Selective EtOH-induced postsynaptic increase in UBC GlyR-mediated current amplitude is dependent on postsynaptic protein kinase C activity. A: representative recordings of isolated mIPSCGly (10 µM gabazine, 500 nM TTX) before (black, top) and after (gray, bottom) 26 mM EtOH demonstrate an increase in mIPSCGly amplitude with no change in frequency in SDR cerebellar UBCs. B: cumulative probability histogram of mIPSCGly amplitudes corresponding to the UBC shown in A demonstrates the rightward shift from baseline (black) in the distribution toward larger-amplitude mIPSCGly in the presence of 26 mM EtOH (gray). C: mean ± SE % change in UBC mIPSCGly amplitudes (n = 8 cells from 4 animals) in 26 mM EtOH (EtOH, gray) and in washout (wash, white). D: brief (10 ms) focal application of 100 µM glycine (Gly) (black vertical bar) at 20-s intervals to UBCs evokes stable (left) GlyR-dependent transient inward currents that increase in amplitude in the presence of 26 mM EtOH (center), except when the PKC inhibitor calphostin C (100 nM) is present in the intracellular solution (right). E: focal application of the GABAAR agonist THIP (100 µM) results in stable transient inward currents that are unaltered by bath application of 26 mM EtOH. In D and E, traces are averages of 6 responses (2-min total duration) for each condition normalized to the average baseline peak amplitude. F: mean ± SE pharmacologically evoked GlyR-mediated current amplitudes (each point is an average of 2 responses) were stable near 100% of baseline throughout 5-min vehicle application (n = 5 cells from 3 animals, black circles) but increased gradually over the 5-min exposure to 26 mM EtOH (n = 9 cells from 5 animals, open squares), unless calphostin C was included in the recording pipette (n = 8 cells from 3 animals, gray triangles). GABAR-mediated currents (evoked by THIP) were not affected by application of 26 mM EtOH (n = 6 cells from 3 animals, open diamonds). G and H: plots showing that during EtOH perfusion (G) and after EtOH washout (H) only the magnitude of the evoked GlyR-mediated response was significantly increased by EtOH under control conditions but not when calphostin C was included in the recording pipette. All recordings for D–H were performed in the presence of 500 nM TTX and 50 µM d-AP5, with the addition of 10 µM gabazine to isolate glycinergic responses or 1 µM strychnine to isolate GABAergic responses, and all agonist-evoked responses were subsequently blocked by the addition of 2 µM strychnine or 10 µM gabazine, respectively (not shown). #P < 0.05, *P < 0.01 with 2-tailed paired t-test.
Fig. 6.
Fig. 6.
UBC mIPSCs are predominantly GABAergic. A and B: representative recordings of UBC mIPSCGlys (A) and mIPSCGABAs (B) in the presence of 500 nM TTX, 50 µM d-AP5, and 10 µM gabazine (0.19 Hz; A) or 1 µM strychnine (0.96 Hz; B), where downward deflections represent mIPSC events. C and D: average (mean ± SE) basal mIPSCGly (n = 14 cells from 5 animals) frequency (C) and amplitude (D) were significantly lower than for average basal mIPSCGABA (n = 7 cells from 3 animals). **P < 0.001 with 2-tailed t-test.
Fig. 7.
Fig. 7.
EtOH-induced enhancement of UBC synaptic inhibition varies across rodent genotypes according to EtOH consumption phenotype. A: representative recordings of mixed (not pharmacologically isolated) sIPSCs before (top) and during (bottom) application of 26 mM EtOH from cerebellar UBCs of a SDR (left), a DBA/2 mouse (D2, middle), and a C57BL/6 mouse (B6, right). B–E: EtOH-induced change in UBC sIPSC frequency (B), amplitude (C), cumulative activity (D), and total charge transfer (E) from SDRs (n = 11 cells from 6 animals) and D2 (n = 11 cells from 5 animals) and B6 (n = 11 cells from 5 animals) mice. #P < 0.05, *P < 0.01, **P < 0.001 with 2-tailed paired t-test for within cell comparisons; §P < 0.05 with SNK method for pairwise comparisons between groups with Kruskal-Wallis 1-way ANOVA on ranks.

References

    1. Agrawal A, Lynskey MT. Are there genetic influences on addiction: evidence from family, adoption and twin studies. Addiction 103: 1069–1081, 2008. doi:10.1111/j.1360-0443.2008.02213.x. - DOI - PubMed
    1. Aguayo LG, Castro P, Mariqueo T, Muñoz B, Xiong W, Zhang L, Lovinger DM, Homanics GE. Altered sedative effects of ethanol in mice with α1 glycine receptor subunits that are insensitive to Gβγ modulation. Neuropsychopharmacology 39: 2538–2548, 2014. doi:10.1038/npp.2014.100. - DOI - PMC - PubMed
    1. Aguayo LG, Pancetti FC. Ethanol modulation of the gamma-aminobutyric acidA- and glycine-activated Cl− current in cultured mouse neurons. J Pharmacol Exp Ther 270: 61–69, 1994. - PubMed
    1. Aguayo LG, Tapia JC, Pancetti FC. Potentiation of the glycine-activated Cl− current by ethanol in cultured mouse spinal neurons. J Pharmacol Exp Ther 279: 1116–1122, 1996. - PubMed
    1. Arenz A, Silver RA, Schaefer AT, Margrie TW. The contribution of single synapses to sensory representation in vivo. Science 321: 977–980, 2008. doi:10.1126/science.1158391. - DOI - PMC - PubMed

Publication types

MeSH terms

LinkOut - more resources