. 2017 Jul 1;313(1):C27-C41.
doi: 10.1152/ajpcell.00225.2016. Epub 2017 Apr 5.

Melamine induces Ca2+-sensing receptor activation and elicits apoptosis in proximal tubular cells

Affiliations

Melamine induces Ca2+-sensing receptor activation and elicits apoptosis in proximal tubular cells

Allen J Yiu et al. Am J Physiol Cell Physiol. .

Abstract

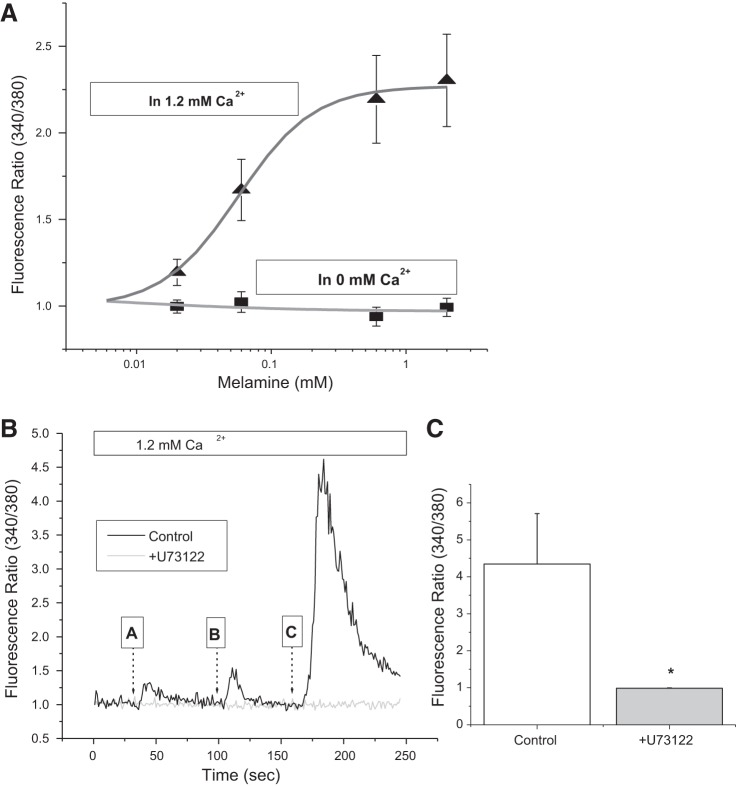
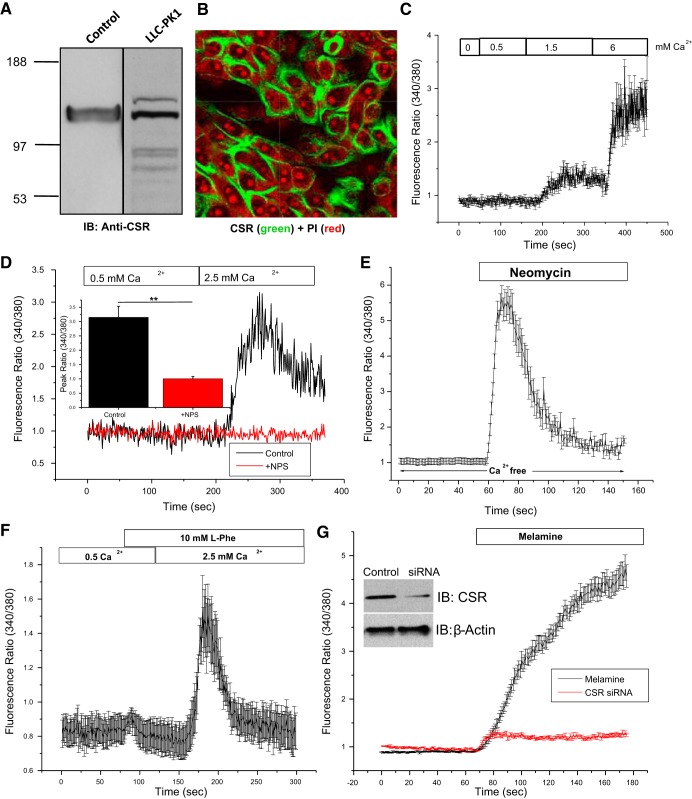
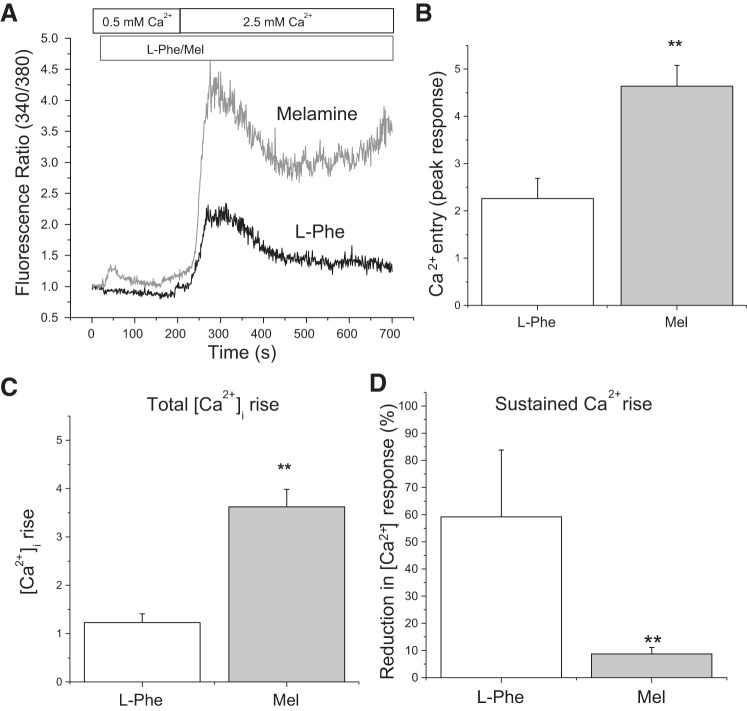
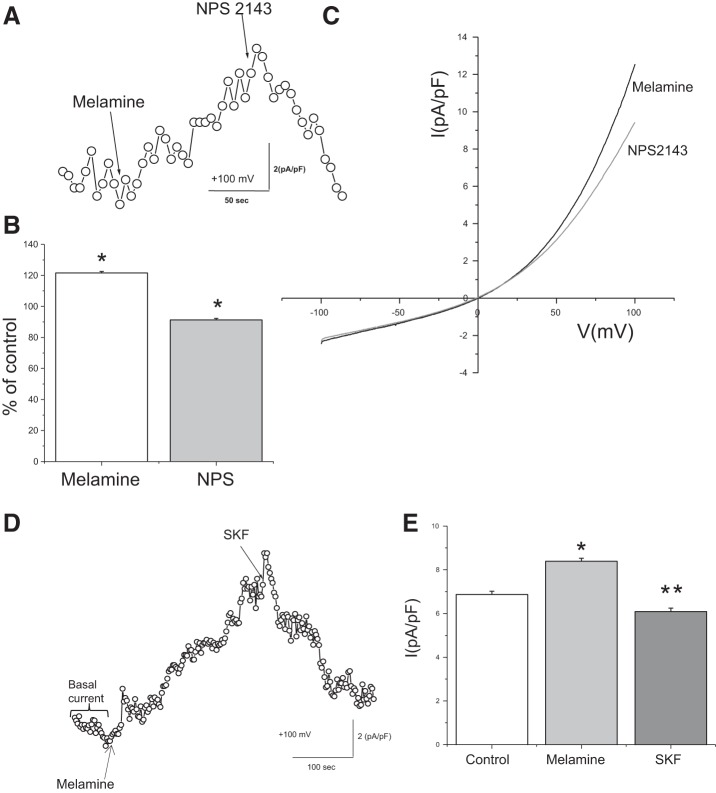
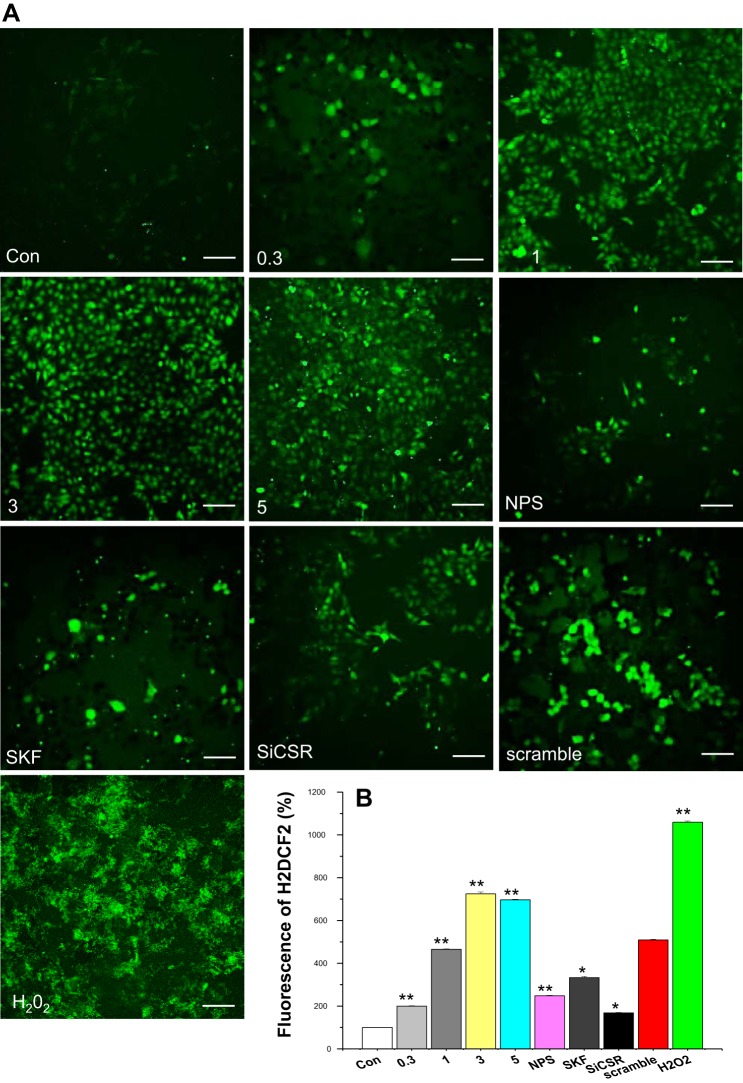
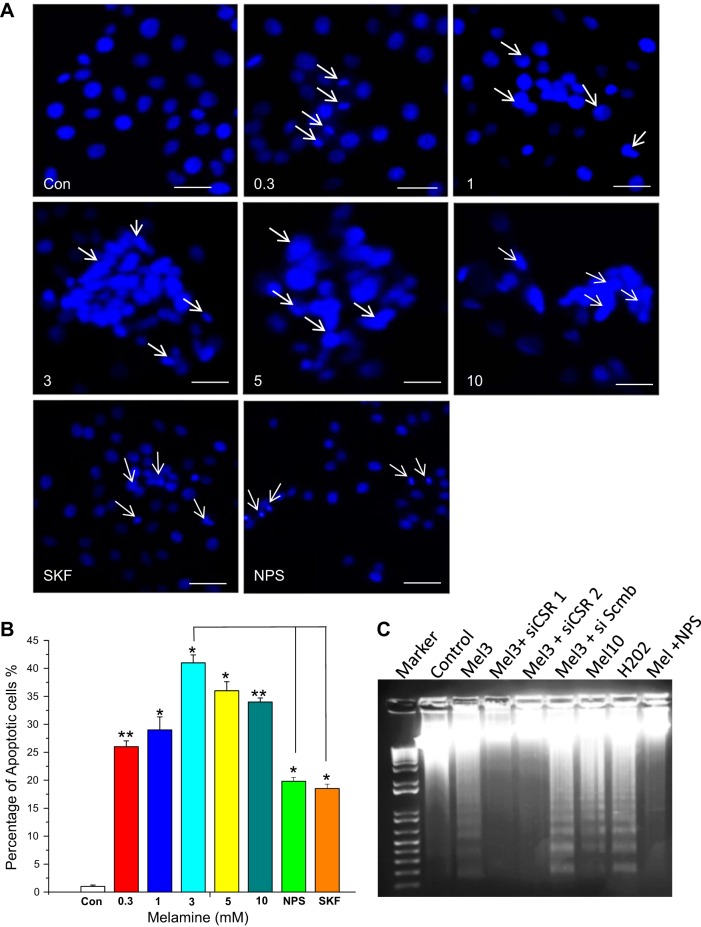
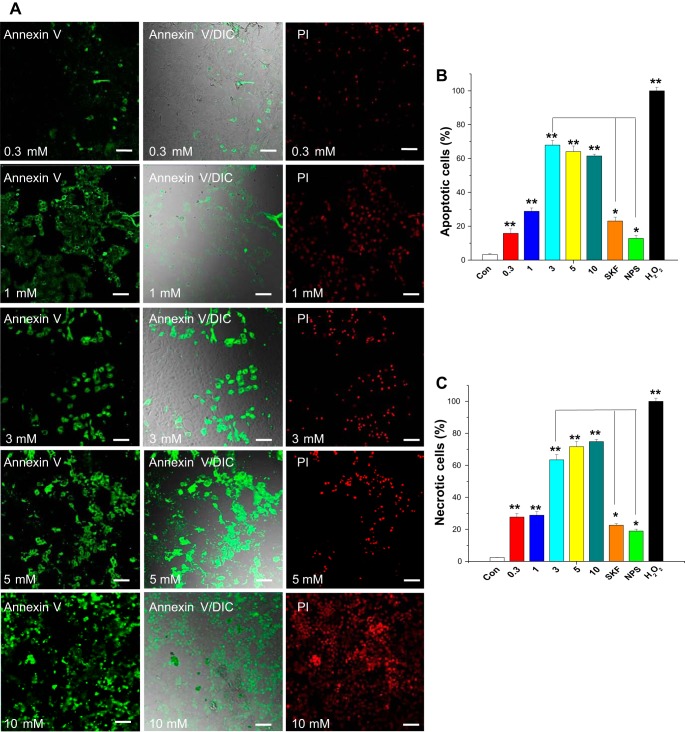
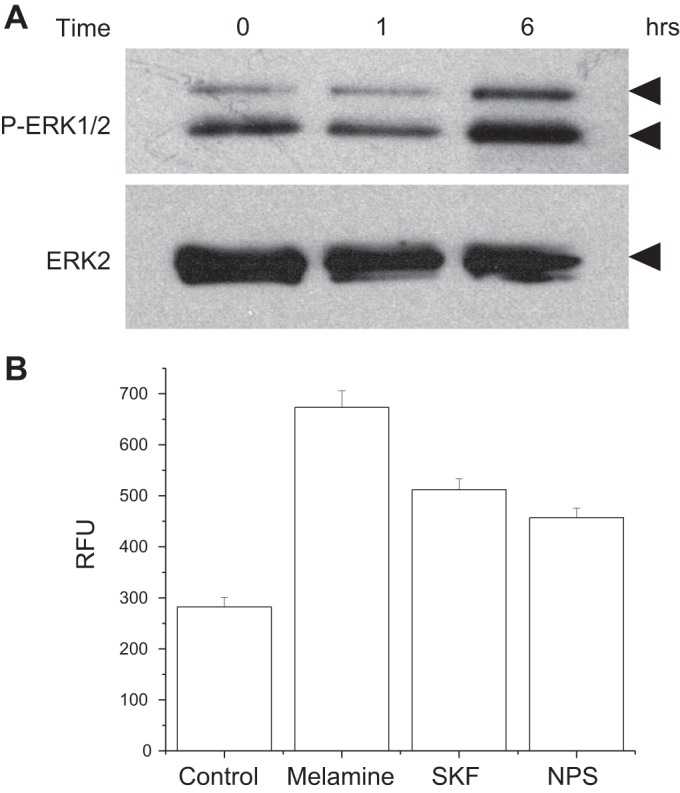
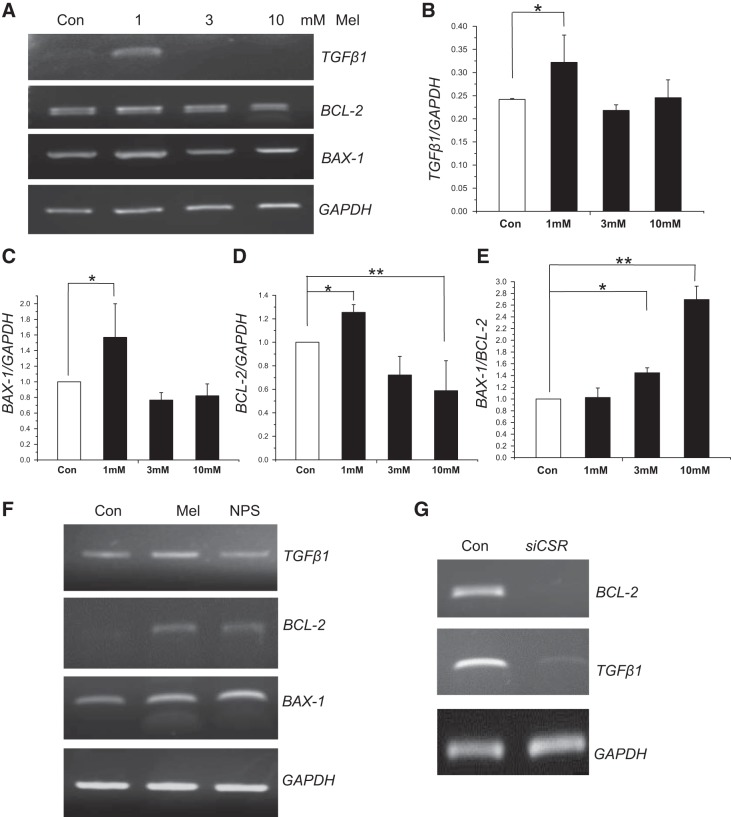
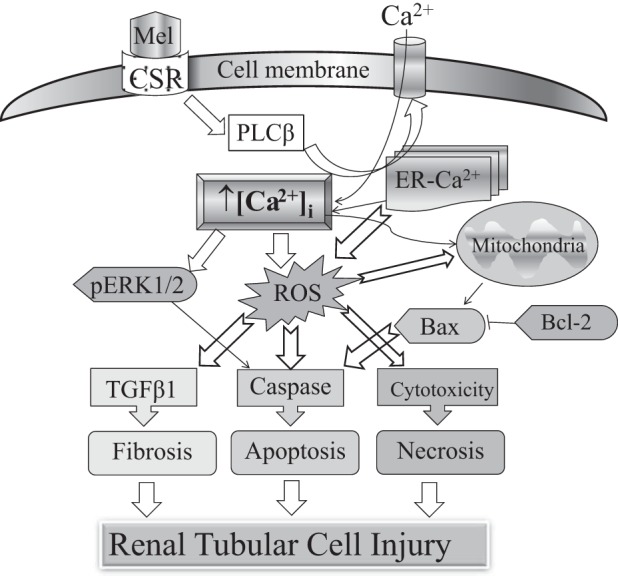
Melamine causes renal tubular cell injury through inflammation, fibrosis, and apoptosis. Although melamine affects the rise in intracellular Ca2+ concentration ([Ca2+]i), reactive oxygen species (ROS) production, and proapoptotic pathway activation, the mechanism of upstream Ca2+ signaling is unknown. Because melamine has some structural similarities with l-amino acids, which endogenously activate Ca2+-sensing receptors (CSR), we examined the effect of melamine on CSR-induced Ca2+ signaling and apoptotic cell death. We show here that melamine activates CSR, causing a sustained Ca2+ entry in the renal epithelial cell line, LLC-PK1. Moreover, such CSR stimulation resulted in a rise in [Ca2+]i, leading to enhanced ROS production. Furthermore, melamine-induced elevated [Ca2+]i and ROS production caused a dose-dependent increase in apoptotic (by DAPI staining, DNA laddering, and annexin V assay) and necrotic (propidium iodide staining) cell death. Upon examining the downstream mechanism, we found that transforming growth factor β1 (TGF-β1), which increases extracellular matrix genes and proapoptotic signaling, was also upregulated at lower doses of melamine, which could be due to an early event inducing apoptosis. Additionally, cells exposed to melamine displayed a rise in pERK activation and lactate dehydrogenase release resulting in cytotoxicity. These results offer a novel insight into the molecular mechanisms by which melamine exerts its effect on CSR, causing a sustained elevation of [Ca2+]i, leading to ROS generation, fibronectin production, proapoptotic pathway activation, and renal cell damage. Together, these results thus suggest that melamine-induced apoptosis and/or necrosis may subsequently result in acute kidney injury and promote kidney stone formation.

Keywords: Ca2+-sensing receptor; acute kidney injury; apoptosis; cell cytotoxicity; intracellular Ca2+; kidney stone; kidney tubular cells; melamine.


Figures

Fig. 1.
Fig. 1.
Melamine activates Ca2+ mobilization in LLC-PK1 cells. A: concentration-dependent [Ca2+]i rise by melamine (0.03 mM, 0.10 mM, 0.30 mM, and 3.00 mM) in Ca2+-free (gray trace) and 1.2 mM Ca2+ (black trace) media. Mean fluorescence traces of fura-2 AM-loaded LLC-PK1 cells were bathed in 1.2 mM Ca2+ media showing changes in the fluorescence ratio (340/380 excitation). B: with the application of increasing doses of melamine [(in mM) 0.5 at 30s, 2.0 at 100 s, 3.0 at 160 s] incubated with phospholipase (PLC) inhibitor, U73122 (gray trace), and without (control, black trace). C: peak fluorescence ratio values after 3 mM melamine application, without any inhibitor (control, open bar) and incubated in PLC inhibitor, U73122 (shaded bar). Values are means ± SE. *P < 0.05.
Fig. 2.
Fig. 2.
Melamine induced a Ca2+ sensing in LLC-PK1 cells. A: immunoblotting (IB) using anti-calcium-sensing receptor (CSR) antibody (rabbit, 1:500 dilution) showing the expression of exogenous CSR protein in HEK (lane 1; control) and LLC-PK1 (lane 2). B: representative image of confocal XY sections of LLC-PK1 cells shows expression of CSR (green signal) and nuclei stained with propidium iodide (PI; red signal). C–F: mean fluorescence traces of fura-2 AM-loaded LLC-PK1 cells showing changes in fluorescence ratio (340/380 excitation) measured to assess the changes in [Ca2+]i evoked by elevating [Ca2+]o to cells bathed in Ca2+-free media. C: cells were bathed in Ca2+-free media and then exposed to a Ca2+ gradient (0.5–6.0 mM [Ca2+]o). D: cells were bathed in 0.5 mM Ca2+, and then 2.5 mM [Ca2+]o was applied with (NPS 2143, red trace) and without (control, black) CSR inhibitor. Inset: bar diagram of peak fluorescence ratio values in response to 2.5 mM [Ca2+]o. E: CSR activator, neomycin (500 µM), was added to cells in a Ca2+-free medium, causing a [Ca2+]i rise attributable to G protein-coupled receptor activation. F: l-phe (10 mM) induced activation of CSR, leading to intracellular release of Ca2+ in 0.5 mM Ca2+ media, followed by Ca2+ entry after application of 2.5 mM [Ca2+]o. G: melamine (3 mM) induces activation of CSR in LLC-PK1 cells in the presence of in 1.2 mM [Ca2+]o, which is further blocked by CSR-specific siRNA-treated LLC-PK1 cells (red trace). Cells were transiently transfected with CSR-specific siRNA (siCSR) and a scrambled (control) siRNA as described (5). Changes in [Ca2+]o and other conditions are indicated in the figure. Western blot (inset in G) using anti-CSR antibody confirms the inhibition of CSR proteins, where β-actin antibody labeling was used as a loading control. Values are means ± SE. **P < 0.01.
Fig. 3.
Fig. 3.
CSR activation induced Ca2+ signaling by melamine in LLC-PK1 cells. A: mean fluorescence traces of fura-2 AM-loaded LLC-PK1 cells. Changes in the fluorescence ratio (340/380 excitation) were measured in cells bathed in 0.5 mM Ca2+-containing media; then 3 mM melamine (Mel; gray trace) and 10 mM l-phe (black trace) were applied, followed by a readdition of 2.5 mM [Ca2+]o in the media. Bar diagrams of the fluorescence ratio (340/380) in response to applied [Ca2+]o at peak (B) and at the conclusion of the experiment (C) represent a sustained [Ca2+]i rise in l-phe-treated (open bar) and melamine-treated (shaded bar) conditions. D: percentage reduction in l-phe-treated (open bar) and melamine-treated (shaded bar) cells between the peak 340/380 fluorescence ratio and end of Ca2+ imaging session. Values are means ± SE. **P < 0.01.
Fig. 4.
Fig. 4.
Melamine generated a Ca2+ current in LLC-PK1 cells. A: whole cell patch-clamp recording (average data of 4 separate experiments) of LLC-PK1 cells, shown after application of melamine (3 µM) and its inhibition by CSR blocker (NPS 2143; 1 µM). B: bar diagram represents the current densities of melamine and NPS 2143 compared with the basal current at +100 mV after melamine (open bar) application and its effects on NPS 2143 (shaded bar). Values are means ± SE. *P < 0.05. C: average (3–4 separate experiments) data represent the I/V relationship of ramps from −100 mV to +100 mV before (control, black) and after (gray) melamine application. D: time course of whole cell current measurements in LLC-PK1 cells with Ca2+ (1.2 mM) containing extracellular solution are showing currents at +100 mV after exposure to melamine and SKF 96365 [transient receptor potential canonical (TRPC) channel blocker]. E: bar diagram represents current densities [compared with the basal current at +100 mV (open bar)] attributable to melamine (shaded bar) and the application of TRPC inhibitor (SKF 96365; dark shaded bar). Values are means ± SE. *P < 0.05, **P < 0.01.
Fig. 5.
Fig. 5.
Melamine-induced CSR stimulated reactive oxygen species (ROS) production in LLC-PK1 cells. A: cells were treated with 0.3–5.0 mM (0.3, 1.0, 3.0, 5.0 as indicated) of melamine in the presence and absence of 10 nM NPS 2143 (NPS), 100 nM SKF 96365 (SKF), CSR-specific siRNA (siCSR), and control siRNA (scramble) for 18 h before incubation with 10 μM H2DCFDA. Untreated cells were used as negative control (Con), and the cells treated with H2O2 (100 μM) were used as positive control. H2DCFDA fluorescence was examined under a microscope, and the data were quantified as indicated in materials and methods. Representative images of cells are from 3 independent experiments. Scale bar = 90 μm. B: bar diagram represents fluorescence intensity percentage change indicator of ROS production in treated cells compared with control (untreated cells) and calculated as described in materials and methods. Each reported value represents the mean ± SE from 3 to 4 independent experiments (*P < 0.05 and **P < 0.01 compared with untreated control). NPS-, SKF-, and siRNA-treated cells, including control (scramble) siRNA, were compared with 3 mM melamine-treated cells.
Fig. 6.
Fig. 6.
Melamine-induced DNA damage and fragmentation influenced by CSR-mediated pathway. A: to examine the DNA damage, LLC-PK1 cells were exposed to melamine for 18 h with 0.3–10.0 mM (0.3, 1.0, 3.0, 5.0 and 10.0 as indicated), in the presence and absence of inhibitors of CSR (300 nM NPS 2143) and TRPC channels (100 nM SKF 96365), before staining with DAPI (1 μg/ml). White arrows indicate apoptotic nuclei. Untreated cells were used as control. Scale bar = 100 μm. B: bar diagram represents percentage of apoptotic cells as an indicator of apoptosis compared with control and calculated as described in materials and methods. Each reported value represents the mean ± SE from 3 to 4 independent experiments (*P < 0.05 and **P < 0.01compared with untreated control). NPS- and SKF-treated cells were compared with 3 mM melamine-treated cells. C: detection of DNA fragmentation by agarose gel electrophoresis in LLC-PK1 cells induced by melamine. Lanes are marked as indicated; Control, untreated cells; Mel3, 3 mM melamine; Mel10, 10 mM melamine; siCSR, CSR-specific siRNA; siCSR 2, CSR-specific siRNA 2; si Scmb, control (nonspecific) siRNA; NPS, NPS 2143 (CSR inhibitor); H2O2 (100 μM) was used as positive control. Cells were transiently transfected with siCSR. DNA was isolated and subjected to ethidium bromide 1% agarose gel electrophoresis. Details are described in materials and methods. Typical fragmented DNA in gel electrophoresis image shown is the representation of 3 independent experiments.
Fig. 7.
Fig. 7.
Melamine induces apoptosis through CSR-mediated Ca2+ signaling in LLC-PK1 cells. A: representative images show LLC-PK1 cells undergoing both apoptosis [using Alexa Fluor 488-labeled annexin V (green signal; left)] and necrosis [using PI (red signal; right). Differential staining was performed to determine melamine-induced apoptosis and necrosis in live cells. Middle: overlay of differential interference contrast (DIC) pictures with Alexa Fluor 488-labeled annexin V. LLC-PK1 cells were exposed to melamine for 18 h with 0.3–10.0 mM (0.3, 1.0, 3.0, 5.0, and 10.0 as indicated). Cells are also treated with 3 mM melamine in the presence and absence of inhibitors of CSR (300 nM NPS 2143) and TRPC channels (100 nM SKF 96365), before staining with annexin-V/PI. Untreated cells were used as control. Scale bar = 100 μm. B: bar diagram represents percentage of apoptotic cells (bright green fluorescence) as an indicator of apoptosis compared with control and calculated as described in materials and methods. C: quantification of necrosis shown in bar diagram shown as percentage of necrotic cells (red fluorescence) compared with control. Images are from 3 independent experiments showing cell populations undergoing apoptosis and necrosis, which were quantified and expressed as percentage of total cells. Each value represents the mean ± SE (*P < 0.05 and **P < 0.01) compared with control (untreated). NPS- and SKF-treated cells were compared with cells treated with 3 mM melamine. H202-treated (100 μM) cells were used as positive control.
Fig. 8.
Fig. 8.
Melamine-induced ERK pathway activation and lactate dehydrogenase (LDH) release. A: Western blots showing that melamine activates the pERK pathway. LLC-PK1 cells were exposed to 3 mM melamine in a physiological Ca2+-containing media for various durations (0–6 h), and the results were analyzed by Western blots using antibodies to phospho-ERK1/2 and ERK2 (control) antibodies. B: to determine the LDH release, LLC-PK1 cells were treated with 3 mM melamine, 3 mM melamine plus 100 nM SKF 96365, or 3 mM melamine with 300 nM NPS 2143 over 12 h. Untreated cells were used as control. LDH activity is shown as relative fluorescence units (RFU). Data represent means ± SE.
Fig. 9.
Fig. 9.
Melamine-induced fibrotic and apoptotic gene expression in LLC-PK1 cells. To observe the melamine-induced fibrotic (transforming growth factor β1, TGF-β1) and apoptotic (BCL-2 and BAX-1) gene expression, cells were treated with 1 mM, 3 mM, and 10 mM of melamine for 18 h. GAPDH was used as an internal control. The mRNA was detected by semiquantitative RT-PCR. The PCR products were examined on a 1% agarose gel with ethidium bromide (A). The intensities of PCR products were determined by densitometric analysis. B–E: bar diagrams are the relative mRNA expression of the genes TGFβ1 (B), BAX-1 (C), BCL-2 (D), and BAX-1/BCL-2 (E) as apoptotic index. The error bar indicates the variation of the experiments. Data represent means ± SE. *P < 0.05; **P < 0.01 compared with control. F and G: agarose gel images of semiquantitative RT-PCR experiments using pharmacological (NPS 2143) and siRNA inhibitors of inhibitor of CSR. The PCR products were examined on a 1% agarose gel with ethidium bromide staining. Expressions are of GAPDH used as an internal control. mRNA expressions of both TGFβ1 and BCL2 were markedly reduced in NPS 2143-treated condition, which were confirmed by CSR-specific siRNA treatment.
Fig. 10.
Fig. 10.
A schematic diagram summarized as a possible mechanism of action of melamine causing tubular cell injury via CSR-mediated Ca2+ signaling pathway. Melamine activates CSR and generates a PLC-β-mediated Ca2+ entry, leading to a rise in [Ca2+]i, causing sustained Ca2+ entry, which could be attributable to an endoplasmic reticulum (ER) store depletion. Such prolonged elevation in [Ca2+]i can in turn produce an ER stress response, subsequently induce ROS generation, which further can initiate the downstream DNA damage, resulting in apoptotic and necrotic cell death, leading to tubular cell injury. Melamine-induced CSR activation leads to ROS generation that subsequently activates(AKI the following pathways to mediate tubular cell death: 1) activation of mitochondrial proapoptotic (BAX/BCL-2) pathway, 2) expression of TGF-β1, promoting fibronectin production, 3) cytotoxicity resulting in necrosis, and 4) caspase activation via pERK1/2.

Similar articles

Cited by

References

    1. Bahar E, Kim H, Yoon H. ER Stress-mediated signaling: action potential and Ca(2+) as key players. Int J Mol Sci 17: E1558, 2016. doi:10.3390/ijms17091558. - DOI - PMC - PubMed
    1. Bahar E, Lee GH, Bhattarai KR, Lee HY, Choi MK, Rashid HO, Kim JY, Chae HJ, Yoon H. Polyphenolic extract of euphorbia supina attenuates manganese-induced neurotoxicity by enhancing antioxidant activity through regulation of ER stress and ER stress-mediated apoptosis. Int J Mol Sci 18: E300, 2017. doi:10.3390/ijms18020300. - DOI - PMC - PubMed
    1. Bandyopadhyay BC, Pingle SC, Ahern GP. Store-operated Ca2+ signaling in dendritic cells occurs independently of STIM1. J Leukoc Biol 89: 57–62, 2011. doi:10.1189/jlb.0610381. - DOI - PMC - PubMed
    1. Bandyopadhyay BC, Swaim WD, Liu X, Redman RS, Patterson RL, Ambudkar IS. Apical localization of a functional TRPC3/TRPC6-Ca2+-signaling complex in polarized epithelial cells. Role in apical Ca2+ influx. J Biol Chem 280: 12908–12916, 2005. doi:10.1074/jbc.M410013200. - DOI - PubMed
    1. Bandyopadhyay BC, Swaim WD, Sarkar A, Liu X, Ambudkar IS. Extracellular Ca(2+) sensing in salivary ductal cells. J Biol Chem 287: 30305–30316, 2012. doi:10.1074/jbc.M112.394122. - DOI - PMC - PubMed

MeSH terms

LinkOut - more resources