. 2017 Jun 1;77(11):2834-2843.
doi: 10.1158/0008-5472.CAN-16-2238. Epub 2017 Apr 5.

SETD1B Activates iNOS Expression in Myeloid-Derived Suppressor Cells

Affiliations

SETD1B Activates iNOS Expression in Myeloid-Derived Suppressor Cells

Priscilla S Redd et al. Cancer Res. .

Abstract

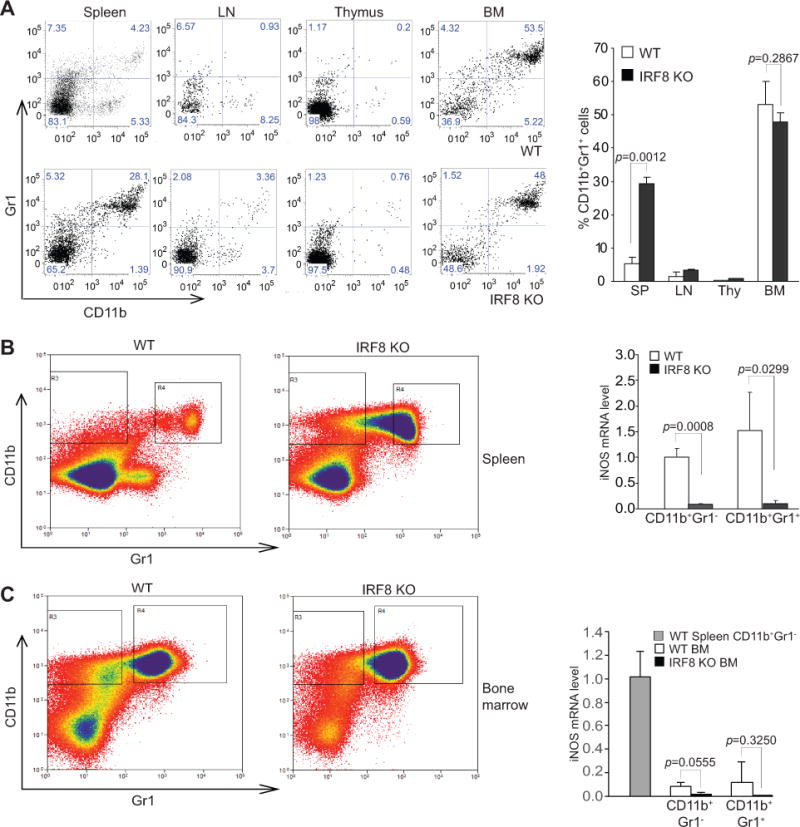
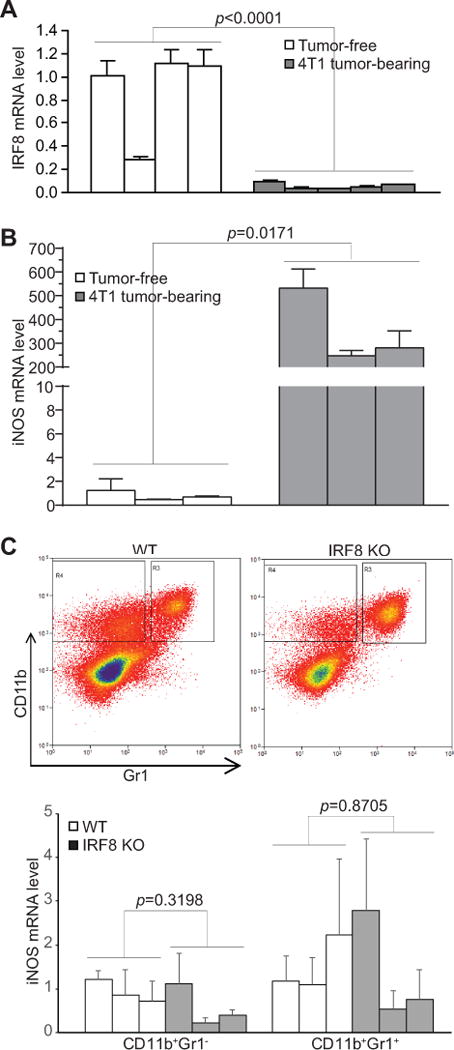
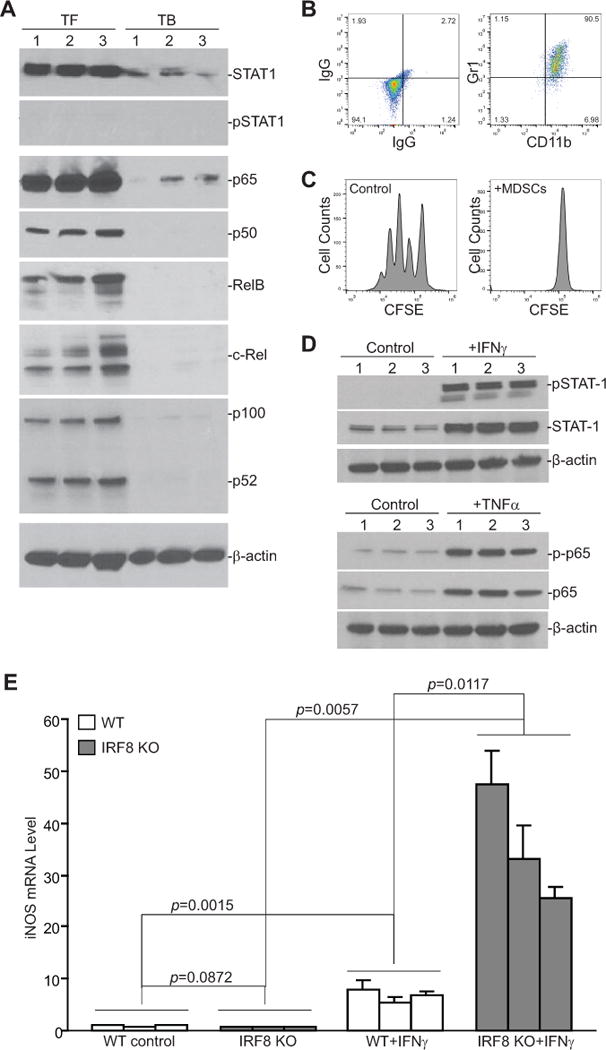
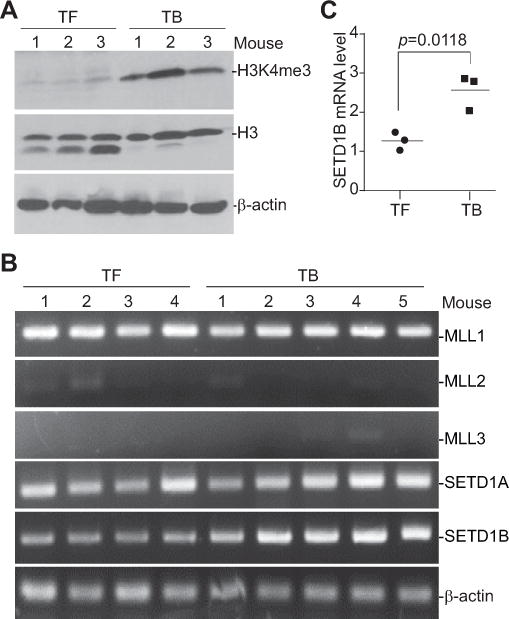
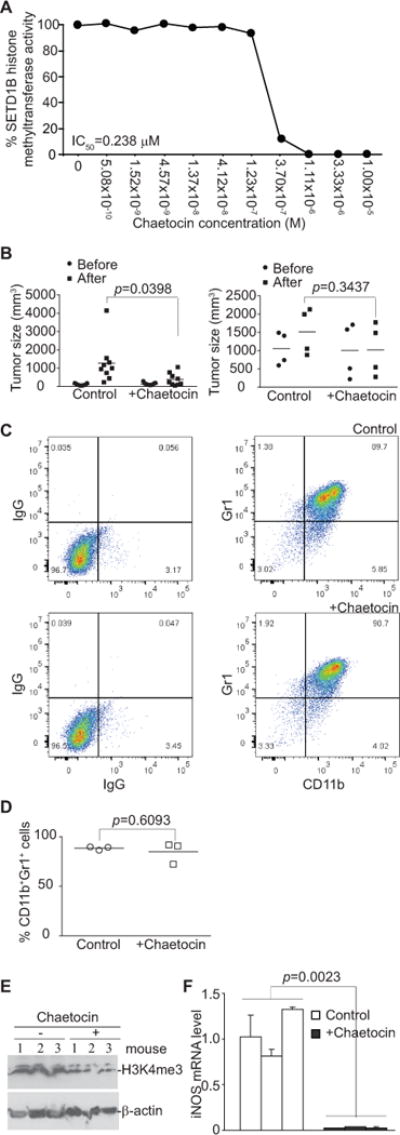
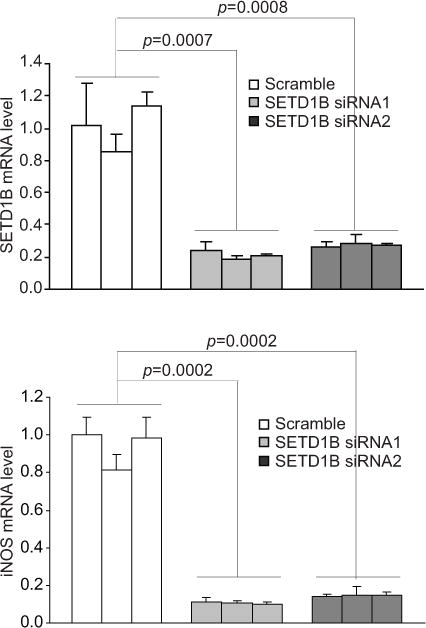
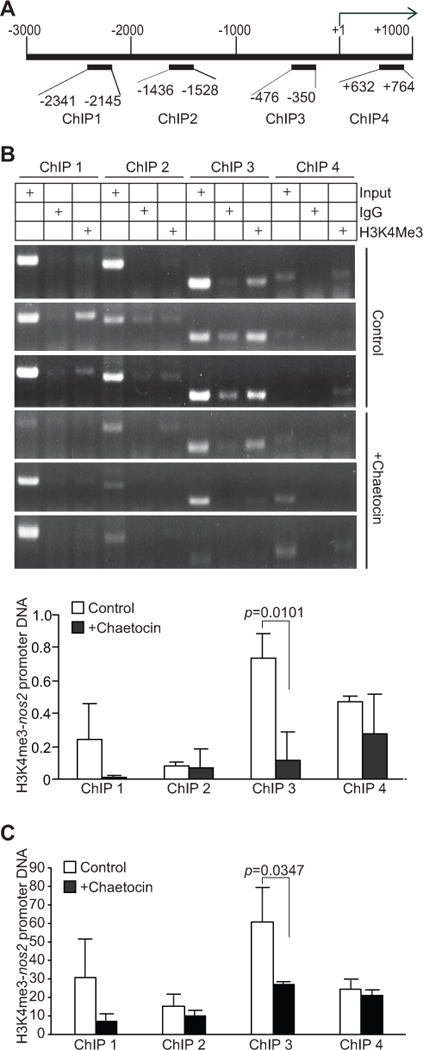
Inducible nitric oxide synthase (iNOS) generates nitric oxide (NO) in myeloid cells that acts as a defense mechanism to suppress invading microorganisms or neoplastic cells. In tumor-bearing mice, elevated iNOS expression is a hallmark of myeloid-derived suppressor cells (MDSC). MDSCs use NO to nitrate both the T-cell receptor and STAT1, thus inhibiting T-cell activation and the antitumor immune response. The molecular mechanisms underlying iNOS expression and regulation in tumor-induced MDSCs are unknown. We report here that deficiency in IRF8 results in diminished iNOS expression in both mature CD11b+Gr1- and immature CD11b+Gr1+ myeloid cells in vivo Strikingly, although IRF8 was silenced in tumor-induced MDSCs, iNOS expression was significantly elevated in tumor-induced MDSCs, suggesting that the expression of iNOS is regulated by an IRF8-independent mechanism under pathologic conditions. Furthermore, tumor-induced MDSCs exhibited diminished STAT1 and NF-κB Rel protein levels, the essential inducers of iNOS in myeloid cells. Instead, tumor-induced MDSCs showed increased SETD1B expression as compared with their cellular equivalents in tumor-free mice. Chromatin immunoprecipitation revealed that H3K4me3, the target of SETD1B, was enriched at the nos2 promoter in tumor-induced MDSCs, and inhibition or silencing of SETD1B diminished iNOS expression in tumor-induced MDSCs. Our results show how tumor cells use the SETD1B-H3K4me3 epigenetic axis to bypass a normal role for IRF8 expression in activating iNOS expression in MDSCs when they are generated under pathologic conditions. Cancer Res; 77(11); 2834-43. ©2017 AACR.


Conflict of interest statement

Conflict of interest: The authors declare no potential conflicts of interest

Figures

Figure 1
Figure 1. IRF8 is an essential transcriptional activator of iNOS in myeloid cells
A. Spleen, LN, thymus and BM cells from tumor-free WT and IRF8 KO C57BL/6 mice were stained with CD11b- and Gr1-specific mAbs and analyzed by flow cytometry. Shown are representative images of CD11b+Gr1+ cells from the indicated tissues. The CD11b+Gr1+ cells in the indicated tissues from WT (n=3) and IRF8 KO (n=3) as shown at the left panel were quantified and presented in the right panel. Column: mean; Bar: SD. B. Spleen cells of WT and IRF8 KO C57BL/6 mice were stained with CD11b- and Gr1-specific mAbs and sorted for subsets of CD11b+Gr1 and CD11b+Gr1+ cells. Left panel shows gating of the sorted subsets of cells. The sorted CD11b+Gr1 and CD11b+Gr1+ cells from WT (n=3) and IRF8 KO (n=3) mice were analyzed by qPCR for iNOS mRNA level and presented at the right. Column: mean; Bar: SD. C. BM cells of WT and IRF8 KO mice were stained with CD11b- and Gr1-specific mAbs and sorted for subsets of CD11b+Gr1 and CD11b+Gr1+ cells. Left panel shows gating of the sorted subsets of cells. The sorted BM CD11b+Gr1 and CD11b+Gr1+ cells from WT (n=3) and IRF8 KO (n=3) mice were analyzed by qPCR for iNOS mRNA level and presented at the right. CD11b+Gr1 cells sorted from WT spleen were used as an iNOS positive control. Column: mean; Bar: SD
Figure 2
Figure 2. IRF8 is silenced but iNOS is upregulated in MDSCs of tumor-bearing mice
A. CD11b+Gr1+ cells were purified from spleens of tumor-free (n=4) and 4T1 tumor-bearing (n=5) BALB/c mice and analyzed by qPCR for IRF8 mRNA level. B. CD11b+Gr1+ cells were purified from spleens of tumor-free (n=3) and 4T1 tumor-bearing (n=3) BALB/c mice and analyzed by qPCR for iNOS mRNA level. C. Tumors were excised from AT3 tumor-bearing WT (n=3) and IRF8 KO (n=3) C57BL/6 mice and a single cell suspension was prepared. Tumor mixtures were then sorted for infiltrating CD11b+Gr1 and CD11b+Gr1+ cells. Top panel shows gating of sorted cells. Bottom panel shows analysis of the sorted cells by qPCR for iNOS mRNA level.
Figure 3
Figure 3. The IFNγ and NF-κB signaling pathways and MDSCs
A. MDSCs were purified from the spleens of 4T1 tumor-bearing (TB, n=3) and their equivalent in tumor-free (TF, n=3) mice and analyzed by Western blotting for STAT1, pSTAT1, p65, p50, RelB, c-Rel, and p100/52. β-actin was used as a normalization control. B. 4T1 conditioned media was collected from 4T1 tumor cell culture flasks. BM cells from three WT mice were cultured in the presence of 4T1 conditioned media for 6 days. Cells were stained with IgG- or CD11b- and Gr1-specific mAb and analyzed by flow cytometry. Shown is the phenotype of the 4T1 conditioned media-induced MDSCs. C. CD3+ T cells were purified from the spleen of a tumor-free WT mouse and labeled with CFSE. The labeled T cells were then cultured in the absence or presence of 4T1 conditioned media-induced MDSCs at a 2:1 ratio for 3 days and analyzed for CFSE intensity by flow cytometry. Shown are representative data of proliferation of T cells from one of three replicates. D. BM cells from three WT mice were cultured in the presence of 4T1 conditioned media for 6 days. The resultant MDSCs were then either untreated (control) or treated with IFNγ (100 U/ml) or TNFα (100 U/ml) for approximately 20 hours, respectively. Cells were then analyzed by Western blotting for the indicated proteins. β-actin was used as a normalization control. E. BM cells from WT (n=3) and IRF8 KO (n=3) mice were cultured in the presence of 4T1 conditioned media for 6 days and then treated with IFNγ (100 U/ml) for approximately 20 hours. Cells were then analyzed by qPCR for iNOS mRNA level.
Figure 4
Figure 4. SETD1B and H3K4me3 levels are elevated in tumor-induced MDSCs
A. 4T1 tumor cells were injected s.c. into the mammary glands of BALB/c mice. Spleens were collected from tumor-free (TF, n=3) and 4T1 tumor-bearing (TB, n=3) mice. CD11b+Gr1+ cells were purified from spleen cells and analyzed for H3K4me3 level by Western blotting. Histone 3 (H3) and β-actin proteins were used as normalization controls. B. CD11b+Gr1+ cells were purified from the spleens of TF (n=4) and TB (n=5) mice and analyzed by RT-PCR with gene-specific primers as indicated. β-actin was used as a normalization control. C. CD11b+Gr1+ cells were purified from spleens of TF (n=3) and TB (n=3) mice and analyzed by qPCR for SETD1B expression level.
Figure 5
Figure 5. Inhibition of SETD1B diminishes H3K4me3 level and iNOS expression in MDSCs in tumor-bearing mice
A. Chaetocin was tested in a 10-dose IC50 mode with 3-fold serial dilutions using [3H]S-adenosyl-methionine as a substrate with recombinant human HMTases as indicated. The enzyme activity was then analyzed and plotted against chaetocin concentrations. IC50 was calculated using the GraphPad Prism program. B. 4T1 tumor cells were injected s.c. into the mammary glands of BALB/c mice. Tumor-bearing mice were treated i.p. 9 (left panel, small tumor group) and 21 (right panel, large tumor group) days after tumor cell injection with solvent control (9 day tumor-bearing mice: n=9. 21 day tumor-bearing mice: n=4) or chaetocin (9 day tumor-bearing mice: n=9. 21 day tumor-bearing mice: n=4) daily for 7 days. Shown is the quantification of tumor sizes before and after chaetocin treatment. C. Spleens were collected from control and chaetocin-treated tumor-bearing mice from the large tumor group. CD11b+Gr1+ cells were isolated from the spleens using CD11b Microbeads and LS columns. Purity of the isolated cells was determined by staining cells with IgG or CD11b- and Gr1-specific mAbs and flow cytometry analysis. Shown are representative images of IgG isotype control and CD11b-/Gr1-specific mAb staining of the purified cells from control mice (top panel) and chaetocin-treated mice (bottom panel). D. Comparison of MDSC purity from control and chaetocin-treated mice as shown in C. E. The purified MDSCs from control and chaetocin-treated mice as shown in C were analyzed by Western blotting for total cellular H3K4me3 levels. β-actin was used as normalization control. F. MDSCs were purified from spleens of control (n=3) and chaetocin-treated (n=3) tumor-bearing mice with large tumors and analyzed for iNOS mRNA level by qPCR.
Figure 6
Figure 6. SETD1B regulates iNOS expression in tumor-induced MDSCs
BM cells from three mice were cultured in the presence of 4T1 conditioned media for 6 days. The BM-derived MDSCs were transiently transfected with scramble siRNA and SETD1B-specific siRNAs for 48h and analyzed for SETD1B (top panel) and iNOS (bottom panel) mRNA level by qPCR. Each column represents data of 4T1 conditioned media-induced MDSCs from one mouse. Column: Mean. Bar: SD.
Figure 7
Figure 7. Inhibition of SETD1B significantly decreases H3K4me3 level at the nos2 promoter region in tumor-induced MDSCs in vivo
A. Structure of the nos2 promoter region. The number above the bar indicates nucleotide locations relative to the nos2 transcription initiation site. The ChIP PCR primer regions are also indicated. B. CD11b+Gr1+ cells from control (n=3) and chaetocin-treated (n=3) 4T1 tumor-bearing mice were analyzed by ChIP using IgG control antibody and H3K4me3-specific antibody, respectively, followed by PCR analysis with nos2 promoter specific PCR primers as shown in A. Input DNA was used as an normalization control. The intensities of H3K4me3 ChIP, IgG ChIP, and input PCR bands as shown in B were quantified using Image J. The IgG background was subtracted from the H3K4me3 band intensities, which was then normalized to the respective input band intensities and presented at the bottom panel. C. In a separate experiment, CD11b+Gr1+ cells from control (n=3) and chaetocin-treated (n=3) tumor-bearing mice were analyzed by ChIP anti-H3K4me3-specific antibody. The immunoprecipitated DNA was then analyzed by qPCR in triplicates. The IgG background was subtracted from H3K4me3-DNA level. The input of each ChIP primer set was arbitrarily set at 1 and the H3K4me3 was normalized to input DNA level. Column: average of 3 mice. Bar: SD.

References

    1. Stiff A, Trikha P, Wesolowski R, Kendra K, Hsu V, Uppati S, et al. Myeloid-derived suppressor cells express Bruton’s tyrosine kinase and can be depleted in tumor bearing hosts by ibrutinib treatment. Cancer Res. 2016 - PMC - PubMed
    1. Gabrilovich DI, Ostrand-Rosenberg S, Bronte V. Coordinated regulation of myeloid cells by tumours. Nat Rev Immunol. 2012;12:253–68. - PMC - PubMed
    1. Paschall AV, Zhang R, Qi CF, Bardhan K, Peng L, Lu G, et al. IFN Regulatory Factor 8 Represses GM-CSF Expression in T Cells To Affect Myeloid Cell Lineage Differentiation. J Immunol. 2015;194:2369–79. - PMC - PubMed
    1. Bronte V, Brandau S, Chen SH, Colombo MP, Frey AB, Greten TF, et al. Recommendations for myeloid-derived suppressor cell nomenclature and characterization standards. Nat Commun. 2016;7:12150. - PMC - PubMed
    1. Beury DW, Carter KA, Nelson C, Sinha P, Hanson E, Nyandjo M, et al. Myeloid-Derived Suppressor Cell Survival and Function Are Regulated by the Transcription Factor Nrf2. J Immunol. 2016;196:3470–8. - PMC - PubMed

Publication types